Greenfield Care Center of Fullerton
CMS overall rating Info CMS (the Centers for Medicare & Medicaid Services) is the federal agency that rates nursing home quality. Its Overall Rating runs from 1 to 5 stars, combining health inspections, staffing, and quality measures, with inspections weighted most heavily.

Greenfield Care Center of Fullerton

CMS overall rating Info CMS (the Centers for Medicare & Medicaid Services) is the federal agency that rates nursing home quality. Its Overall Rating runs from 1 to 5 stars, combining health inspections, staffing, and quality measures, with inspections weighted most heavily.
Calculator: See prices in your area
Greenfield Care Center of Fullerton accepts Medicare, Medicaid, and private pay.

Overview of Greenfield Care Center of Fullerton

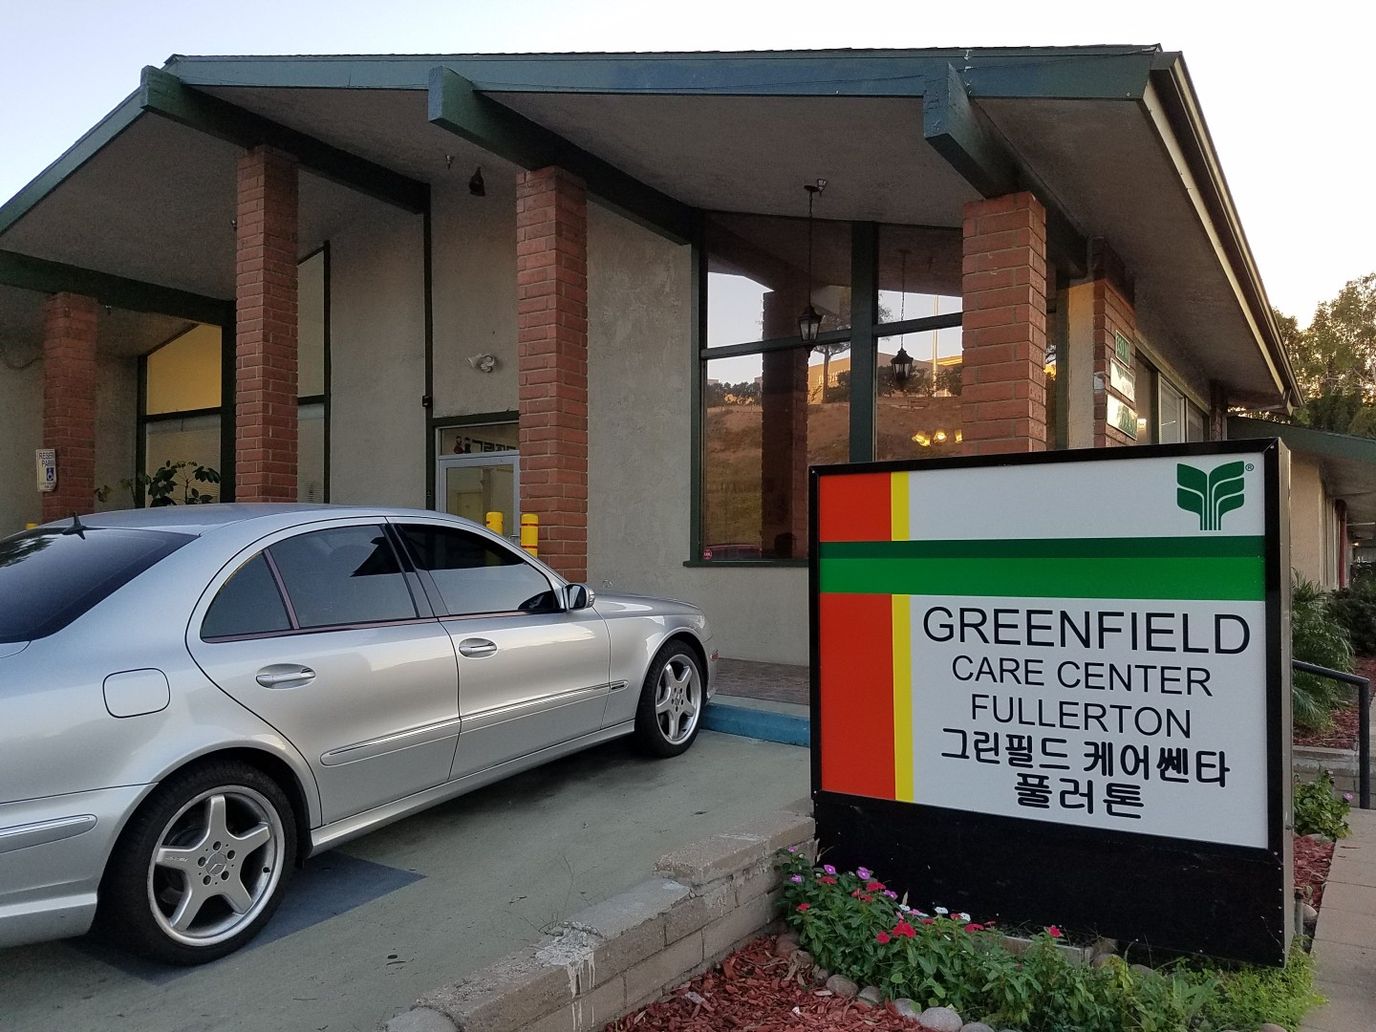
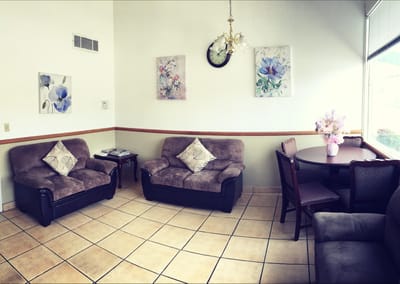
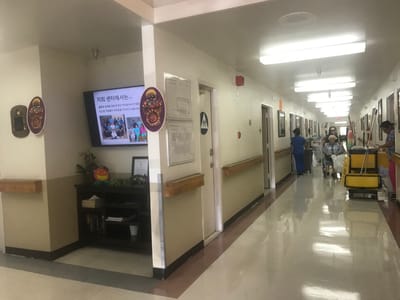
Greenfield Care Center of Fullerton is an astounding nursing home in Fullerton, CA, that offers long-term care, rehabilitation, hospice, and respite care. The community ensures older adults are treated like a family, providing individualized care for their unique needs. 24-hour care, therapy services, and wound care are also offered to meet residents’ healthcare needs. With its dedication to residents’ well-being, the community provides care plans based on their physician’s order and a comprehensive health assessment.

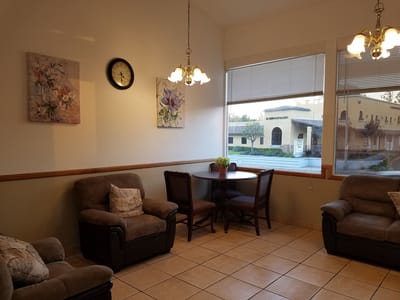
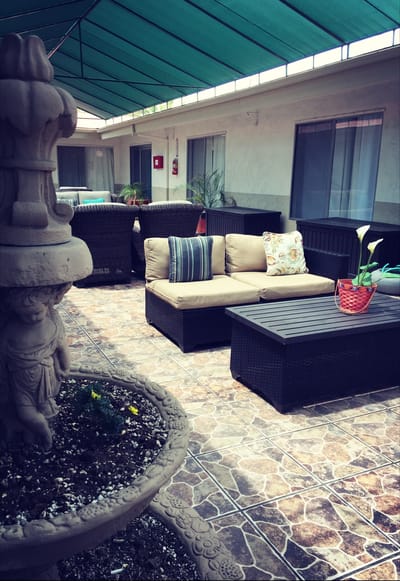
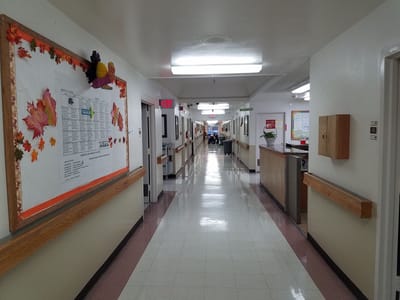
Recreational activities and fitness programs are conducted, so residents can spend their free time as they please. With activity rooms, outdoor patio, and spacious courtyards, residents have plenty of options for leisure. This nursing home is one of the trusted choices for retirement in Fullerton, California, especially with its comprehensive services and extensive amenities.

Quality ratings

Measured by Centers for Medicare & Medicaid Services (CMS)

Overall rating Info The Overall CMS Rating combines results from health inspections, staffing levels and quality measures. Health inspections carry the most weight. Staffing and quality scores can increase or decrease the final rating based on performance compared to state and national standards.
▲ 38.9% Above CA avg. ▲ 38.9% Above CA avg.Click the badge to see the full State ranking.Click here to see the full State ranking.
Health Inspection Info Based on the results of the facility's three most recent standard inspections and any complaint investigations. CMS reviews the number, scope, and severity of deficiencies, with more recent findings weighted more heavily.
▲ 27.0% Above CA avg. ▲ 27.0% Above CA avg.Click the badge to see the full State ranking.Click here to see the full State ranking.
Staffing Info Measures average nursing staff hours per resident per day, including Registered Nurses (RNs) and total nursing staff. Ratings are adjusted based on the level of care residents require and are compared to state and national benchmarks.
▲ 44.9% Above CA avg. ▲ 44.9% Above CA avg.Click the badge to see the full State ranking.Click here to see the full State ranking.
Quality Measures Info Based on clinical and physical health indicators reported to CMS, such as hospital readmissions, falls, pressure ulcers, and improvements in mobility. These measures reflect how well residents' health needs are being managed.
▲ 17.4% Above CA avg. ▲ 17.4% Above CA avg.Click the badge to see the full State ranking.Click here to see the full State ranking.

Staffing hours breakdown

Info Daily nursing hours per resident by staff type, reported to CMS. Higher is generally better — compare this facility to state and national averages to see where staffing stands.

Hours per resident per day — compared to California state averages

Total nursing care / resident Info This home is ranked 104th out of 345 homes in California for nurse hours. Total adjusted nursing hours per resident per day, combining RN, LPN, and aide time. CMS adjusts this for case-mix so facilities can be fairly compared.
4h 23m per day
Rank #104 / 345Nurse hours — State benchmarkedThis home is ranked 104th out of 345 homes in California for nurse hours. Shows adjusted nurse hours per resident per day benchmarked to the California average, with a ranking across 345 California SNFs. More hours mean more direct care. The national average is about 3.5 hrs; below 3.0 is a red flag.Click the rank badge to see the full State ranking.Click here to see the full State ranking.
This facility California avg (4h 23m per day)
vs California avg
+0%

3 of 6 metrics below state avg

Standout metric Physical Therapist is +40% above state avg
Staff typeHours / Day / Residentvs state avg
Registered Nurse (RN) Info RNs hold the highest nursing license and can assess residents, interpret test results, and direct care plans. More RN hours per day often signals stronger clinical oversight and faster response to health changes. 45m per day ▲ 15% State avg: 39m per day · National avg: 41m per day
LPN / LVN Info Licensed Practical Nurses (LPNs) or Licensed Vocational Nurses (LVNs) deliver routine hands-on care — medication administration, wound dressing, and monitoring vital signs. They work under RN supervision and make up a large share of daily bedside care. 51m per day ▼ 30% State avg: 1h 13m per day · National avg: 52m per day
Nurse Aide Info Certified Nurse Aides (CNAs) provide the most direct day-to-day assistance: bathing, dressing, feeding, and mobility. Nurse aide hours are typically the largest staffing category and directly affect residents' quality of life. 2h 32m per day ▼ 4% State avg: 2h 39m per day · National avg: 2h 21m per day
Weekend Total Nursing Info Combined nursing hours (RN + LPN + Nurse Aide) per resident per day on weekends. Staffing often drops on weekends — this figure reveals whether the facility maintains adequate coverage outside of weekday hours. 3h 49m per day ▼ 7% State avg: 4h 5m per day · National avg: 3h 26m per day
Physical Therapist Info Hours per resident per day provided by licensed Physical Therapists (PTs) or PT Assistants. PT services help residents recover mobility after injury or illness and are especially important for post-acute (short-stay) rehabilitation. 7m per day ▲ 40% State avg: 5m per day · National avg: 4m per day
Weekend RN Info Registered nurse hours specifically on weekends. Facilities sometimes reduce RN presence on Saturdays and Sundays — a low weekend RN figure compared to weekday hours can indicate reduced clinical oversight when most administrative staff are absent. 38m per day ▲ 27% State avg: 30m per day · National avg: 29m per day

Capacity and availability

This home is often near full

Higher occupancy than the California average: 84.7%
Occupancy rate
183.8% Rank #220 / 1530Occupancy rate — State benchmarkedThis home is ranked 220th out of 1530 homes in California for occupancy rate. Shows this facility's occupancy rate versus the California average, with its Statewide rank out of 1530. Higher occupancy signals strong local demand and financial stability.Click the rank badge to see the full State ranking.Click here to see the full State ranking.
Avg. Length of Stay
255 days
Years in operation
56 years in operation Rank #1 / 1487Years in operation — State benchmarkedThis home is ranked 1st out of 1487 homes in California for years in operation. Shows how long this facility has been in operation compared to other California SNFs. Longer operating histories may benefit residents, families, and staff.Click the rank badge to see the full State ranking.Click here to see the full State ranking.
A longer operating history, which may indicate experience navigating regulations and delivering ongoing care.
Walk Score
Walk Score: 50 / 100 Rank #1346 / 2093Walk Score — State benchmarkedThis home is ranked 1346th out of 2093 homes in California for walk score. Shows how walkable this facility's neighborhood is compared to the average Walk Score across California SNFs. Higher scores benefit residents, families, and staff.Click the rank badge to see the full State ranking.Click here to see the full State ranking.
Moderately walkable. Some errands can be accomplished on foot, with a mix of nearby amenities.
BBB Rating
BBB Rating: A+ (Not Accredited)
An independent rating from the Better Business Bureau based on factors such as complaint history, transparency, and business practices.
How BBB ratings work

About this community

License Details

CMS Certification Number56151

Staffing

Key information about the people who lead and staff this community.

Leadership

ContactMr. Anthony Padama

Therapy & Rehabilitation

2 services
Rehabilitation Services
Respite Care

Staffing & Medical

1 service
24-Hour Staffing

Amenities & Lifestyle

Specific ProgramsHospice & Respite Care

Contact Greenfield Care Center of Fullerton

Inspection History

In California, the Department of Social Services (for assisted living facilities) and the Department of Public Health (for nursing homes) conduct inspections to ensure resident safety and regulatory compliance.

Health Inspection History

Inspections since 2021
Total health inspections 4

California average 12.5


Last Health inspection on Sep 2025

Total health citations
31 Rank #114 / 352Health citations — State benchmarkedThis home is ranked 114th out of 352 homes in California for health citations. Shows this facility's total health deficiency citations benchmarked to the California State average, with a ranking across all 352 CA SNFs. Lower citation counts earn a better rank.Click the rank badge to see the full State ranking.Click here to see the full State ranking.

California average 50.2

Citations per inspection
7.75 Rank #334 / 352Citations per inspection — State benchmarkedThis home is ranked 334th out of 352 homes in California for citations per inspection. Shows average deficiency citations per CMS inspection for this facility versus the California mean across 352 SNFs with citation data. Lower is better.Click the rank badge to see the full State ranking.Click here to see the full State ranking.

California average 4.65


Health citations are formal notices following inspections when they fail to comply with safety and care standards.

29 of 31 citations resulted from standard inspections; and 2 of 31 resulted from complaint investigations.

Breakdown of citation severity (last 5 years)
Critical health citations
0
100% better than California average

California average: 0.4


Serious health citations
0
100% better than California average

California average: 1

0 critical citations California average: 0.4

0 serious citations California average: 1

28 moderate citations California average: 47.2

3 minor citations California average: 1.5
Citations history (last 5 years)
Infection Control moderate citation Sep 11, 2025
Corrected

Nutrition moderate citation Sep 11, 2025
Corrected

Pharmacy moderate citation Sep 11, 2025
Corrected

Pharmacy moderate citation Sep 11, 2025
Corrected

Staffing Data

Reporting period: October 1 – December 31, 2025 (Q4 2025). Source: CMS Payroll-Based Journal report.

Total staff 105
Employees 84
Contractors 21
Staff to resident ratio 1.19 : 1
34% fewer staff per resident than California average
California average ratio: 1.81 : 1 California average ratio: 1.81 : 1See full California ranking
Avg staff/day 53
Average shift 7.4 hours
0% compared with California average
California average: 7.7 hours California average shift: 7.7 hoursSee full California ranking
Total staff hours (quarter) 36,199

Nursing staff breakdown

Q4 2025 · Oct 1 – Dec 31 More info This data comes from the CMS Payroll-Based Journal report covering October 1 – December 31, 2025.
Registered Nurse

Manages medical care and health needs.

RN Staff Info 15 total: 14 full-time employees and 1 contractor. 15
Average shift length Info Average shift length. Calculated as total hours divided by days worked and average staff per day. 7.6 hours
Licensed Practical Nurse

Assists with medical care and medications.

LPN Staff Info All 14 LPN Staff are full-time employees. No contractors work on this role. 14
Average shift length Info Average shift length. Calculated as total hours divided by days worked and average staff per day. 7.5 hours
Certified Nursing Assistant

Helps with daily care and mobility.

CNA Staff Info All 46 CNA Staff are full-time employees. No contractors work on this role. 46
Average shift length Info Average shift length. Calculated as total hours divided by days worked and average staff per day. 7.6 hours

Contractor staffing

Q4 2025 · Oct 1 – Dec 31 More info This data comes from the CMS Payroll-Based Journal report covering October 1 – December 31, 2025.

Total hours from contractors

8.3%

2,991 contractor hours this quarter

Respiratory Therapy Technician: 4 Physical Therapy Assistant: 4 Therapeutic Recreation Specialist: 2 Qualified Social Worker: 2 Physical Therapy Aide: 2 Registered Nurse: 1 Speech Language Pathologist: 1 Occupational Therapy Assistant: 1 Occupational Therapy Aide: 1 Diagnostic X-ray Services Staff: 1 Medical Director: 1 Other Social Services Staff: 1

Staff by category

Q4 2025 · Oct 1 – Dec 31 More info This data comes from the CMS Payroll-Based Journal report covering October 1 – December 31, 2025.
Certified Nursing Assistant4604619,00492100%7.6
Licensed Practical Nurse140145,07092100%7.5
Registered Nurse141154,71792100%7.6
RN Director of Nursing3031,1967582%8
Other Dietary Services Staff20296392100%7.7
Respiratory Therapy Technician0449167885%5.9
Physical Therapy Assistant0447297986%6.5
Administrator1015286672%8
Nurse Practitioner1015286672%8
Dietitian1015126470%8
Dental Services Staff1015126470%8
Clinical Nurse Specialist1014886166%8
Therapeutic Recreation Specialist0223836773%5.7
Speech Language Pathologist0112165560%3.9
Qualified Social Worker0221404043%3.5
Physical Therapy Aide0221293134%3.6
Occupational Therapy Aide011961213%8
Medical Director011421314%3.2
Occupational Therapy Assistant0112433%8
Other Social Services Staff011311%3
Diagnostic X-ray Services Staff011333%1
46 Certified Nursing Assistant
% of Days 100%
14 Licensed Practical Nurse
% of Days 100%
15 Registered Nurse
% of Days 100%
3 RN Director of Nursing
% of Days 82%
2 Other Dietary Services Staff
% of Days 100%
4 Respiratory Therapy Technician
% of Days 85%
4 Physical Therapy Assistant
% of Days 86%
1 Administrator
% of Days 72%
1 Nurse Practitioner
% of Days 72%
1 Dietitian
% of Days 70%
1 Dental Services Staff
% of Days 70%
1 Clinical Nurse Specialist
% of Days 66%
2 Therapeutic Recreation Specialist
% of Days 73%
1 Speech Language Pathologist
% of Days 60%
2 Qualified Social Worker
% of Days 43%
2 Physical Therapy Aide
% of Days 34%
1 Occupational Therapy Aide
% of Days 13%
1 Medical Director
% of Days 14%
1 Occupational Therapy Assistant
% of Days 3%
1 Other Social Services Staff
% of Days 1%
1 Diagnostic X-ray Services Staff
% of Days 3%

Penalties and fines

Federal penalties imposed by CMS for regulatory violations, including civil money penalties (fines) and denials of payment for new Medicare/Medicaid admissions.

Source: CMS Penalties Database (Data as of Jan 2026)

Total fines amount $3K Rank #191 / 352Federal fines — State benchmarkedThis home is ranked 191st out of 352 homes in California for federal fines. Shows this facility's cumulative CMS federal fine dollars versus the California average among facilities with fines, and where it ranks among 352 skilled nursing facilities in the pool. Lower total dollars mean a better rank.Click the rank badge to see the full State ranking.Click here to see the full State ranking.
94% lower than California average

California average: $55K

Number of fines 1
58% fewer fines than California average

California average: 2.4

Payment Denials Info Serious action where Medicare and/or Medicaid temporarily stops payments for new residents until issues are fixed. 0
100% fewer payment denials than California average

California average: 0.5

Fines amount comparison
This facility $3K
California average $55K

No penalties in the past 3 years

No civil money penalties or payment denials were reported in the last 3 years.

Quality of care over time

These measures show how residents usually do over time at this home, based on health outcomes and preventive care.

High-risk clinical events score Info A composite score based on pressure ulcers, falls with injury, weight loss, walking ability decline, and activities of daily living decline. 4.1
39% better than California average

California average: 6.6

Functional decline score Info A composite score based on activities of daily living decline, walking ability decline, and incontinence. 4.8
57% better than California average

California average: 11.3

Long-stay resident measures
Significantly above average California avg: 4.2 Info CMS star rating based on long-stay quality measure performance. 5 stars = significantly above average, 1 star = significantly below average.
Need for Help with Daily Activities Increased Info Percent of long-stay residents whose need for help with daily activities has increased 4.3%
61% better than California average

California average: 11.1%

Walking Ability Worsened Info Percent of long-stay residents whose ability to move independently worsened 6.9%
42% better than California average

California average: 12.0%

Low Risk Residents with Bowel/Bladder Incontinence Info Percent of low risk long-stay residents who lose control of their bowels or bladder 3.4%
70% better than California average

California average: 11.3%

Falls with Major Injury Info Percent of long-stay residents experiencing one or more falls with major injury 2.2%
33% worse than California average

California average: 1.7%

High Risk Residents with Pressure Ulcers Info Percent of long-stay high risk residents with pressure ulcers 0.5%
90% better than California average

California average: 5.0%

Urinary Tract Infection Info Percent of long-stay residents with a urinary tract infection 0.7%
47% better than California average

California average: 1.2%

Lost Too Much Weight Info Percent of long-stay residents who lose too much weight 6.5%
54% worse than California average

California average: 4.2%

Depressive Symptoms Info Percent of long-stay residents who have depressive symptoms 0.0%
100% better than California average

California average: 6.7%

Antipsychotic Use Info Percent of long-stay residents who received an antipsychotic medication 0.0%
100% better than California average

California average: 10.1%

Pneumococcal Vaccine Info Percent of long-stay residents assessed and appropriately given the pneumococcal vaccine 100.0%
In line with California average

California average: 98.5%

Influenza Vaccine Info Percent of long-stay residents assessed and appropriately given the seasonal influenza vaccine 100.0%
In line with California average

California average: 98.2%

Hospitalizations per 1,000 days Info Number of hospitalizations per 1,000 long-stay resident days. 1.10
51% better than California average

California average: 2.25

ED visits per 1,000 days Info Number of outpatient emergency department visits per 1,000 long-stay resident days. 0.70
56% better than California average

California average: 1.59

Short-stay resident measures
Below average California avg: 3.5 Info CMS star rating based on short-stay quality measure performance. 5 stars = much above average, 1 star = much below average.
Pneumococcal Vaccine Info Percent of short-stay residents assessed and appropriately given the pneumococcal vaccine 100.0%
6% better than California average

California average: 94.0%

Antipsychotic medication increase Info Percent of short-stay residents who newly received an antipsychotic medication 0.0%
100% better than California average

California average: 1.5%

Influenza Vaccine Info Percent of short-stay residents assessed and appropriately given the seasonal influenza vaccine 100.0%
7% better than California average

California average: 93.2%

Re-hospitalized after SNF stay Info Percentage of short-stay residents who were re-hospitalized after their nursing home admission. 28.2%
22% worse than California average

California average: 23.2%

Emergency department visits Info Percentage of short-stay residents who had an outpatient emergency department visit. 10.8%
In line with California average

California average: 11.2%

Falls with major injury Info Percentage of SNF residents who experience falls with major injury during their stay. 0.0%
100% better than California average

California average: 0.8%

Ability to care for self at discharge Info Percentage of residents at or above expected ability to care for themselves at discharge. 47.6%
11% worse than California average

California average: 53.7%

Successful return to home or community Info Rate of successful return to home or community from a skilled nursing facility. 38.0%
25% worse than California average

California average: 50.6%

Breakdown by payment type

Medicare

69% of new residents, usually for short-term rehab.

Typical stay 1 - 2 months

Private pay

25% of new residents, often for short stays.

Typical stay 1 - 2 months

Medicaid

5% of new residents, often for long-term daily care.

Typical stay 10 - 11 years

Facility Characteristics

Source: CMS Long-Term Care Facility Characteristics (Data as of Jan 2026)

Total residents 88
Medicare
15
17% of residents
Medicaid
68
77.3% of residents
Private pay or other
5
5.7% of residents
Programs & Services
Residents Group

Residents meet regularly to discuss policies, care quality, and activities

Nurse Aide Training

State-approved Nurse Aide Training and Competency Evaluation Program on-site

Active Resident Council

Organized group of residents that meets regularly to discuss facility policies, quality of life, and activities.

Finances and operations

Privately-owned community
Operated by a business corporation.
Home revenue
$14.0M
Profit
$246.9K
Privately-owned community Operated by a business corporation.
Home revenue
$14.0M Rank #222 / 346Revenue — State benchmarkedThis home is ranked 222nd out of 346 homes in California for revenue. Shows this facility's annual revenue compared to the California SNF average. Higher revenue generally means more resources for staffing and capital — read alongside Payroll %.Click the rank badge to see the full State ranking.Click here to see the full State ranking.
Profit
$246.9K
Payroll costs Info The portion of the home's budget spent on staff, including nurses, caregivers, and other employees who support care and operations. Rank #210 / 346Payroll — State benchmarkedThis home is ranked 210th out of 346 homes in California for payroll. Shows total annual staff payroll benchmarked to the California average. Higher payroll investment relative to peers often signals better staffing and less reliance on cheaper contract labor.Click the rank badge to see the full State ranking.Click here to see the full State ranking.
$7.6M
54.1% of revenue Rank #124 / 346Payroll % — State benchmarkedThis home is ranked 124th out of 346 homes in California for payroll %. Shows payroll as a percentage of revenue versus the California average. Well-run California SNFs typically land around 56–67% — the top third Statewide. Below 25% may signal understaffing or heavy agency use — read with Staffing ratings.Click the rank badge to see the full State ranking.Click here to see the full State ranking.
Other operating costs Info All remaining costs needed to run the home, such as food, utilities, building maintenance, supplies and administrative expenses.
$6.2M
Total costs $13.8M

What does this home offer?

Housing options icon

Housing Options: Private / Shared Rooms

Building type icon
Building type icon

Building Type: Single-story

Social and recreational activities icon

Social and Recreational Activities

Housekeeping icon
Housekeeping icon

Housekeeping Services

On-site medical care and health services icon

On-site Medical Care and Health Services

Rehabilitative support icon

Rehabilitative Support

Who this home usually serves

TYPE OF STAY

Mostly short-term rehab stays

Most residents typically stay for a few weeks or months before returning home or moving on.

Managed by Sarah Park

Administrator

Sarah Park serves as the Administrator at Greenfield Care Center of Fullerton. She is recognized by families for her instrumental role in providing professional and compassionate care, contributing significantly to residents' recovery and well-being. Her leadership ensures a supportive environment where staff and families collaborate closely to deliver the best care plans.

Places of interest near Greenfield Care Center of Fullerton

Address 2.1 miles from city center Info Estimated distance in miles from Fullerton's city center to Greenfield Care Center of Fullerton's address, calculated via Google Maps.

Calculate Travel Distance to Greenfield Care Center of Fullerton

Add your location

Address

Financial Assistance for
Nursing Home in California

Greenfield Care Center of Fullerton is located in Fullerton, California.
Here are the financial assistance programs available to residents in California.

Get Financial aid guidance

Multipurpose Senior Services Program

MSSP (Medi-Cal Waiver)

Age 65+
General California resident, Medi-Cal eligible, nursing home risk.
Income Limits (2025) ~$2,829/month 300% FBR, individual
Asset Limits $2,000 (individual), $3,000 (couple).
CA

County-managed; waitlists possible.

Benefits
In-home support (4-6 hours/day) Respite care (14 days/year) Meals (~$6/meal) Transportation (8 trips/month) Care management

In-Home Supportive Services (IHSS)

California IHSS

Age 65+
General California resident, Medicaid-eligible or low-income.
Income Limits ~$1,732/month individual, Medi-Cal threshold
Asset Limits $2,000 individual
CA

Can hire family as caregivers.

Benefits
Personal care (up to 283 hours/month) Homemaker services Respite (varies)

Multipurpose Senior Services Program (MSSP)

CA MSSP

Age 65+
General California resident, Medi-Cal-eligible, nursing home-eligible but community-capable.
Income Limits ~$2,829/month 300% FBR, individual
Asset Limits $2,000 individual
CA

Available in 38 counties; waitlists common.

Benefits
Case management Respite care (up to 10 days/year) Minor home mods (avg. $500) Adult day care (~$50/day)

Property Tax Postponement Program (PTP)

CA PTP

Age 62+
General California resident, own and live in home, 40% equity.
Income Limits (2025) ~$51,500/year household, adjusted annually
Asset Limits Equity-based; no strict asset cap.
CA

Deferred taxes accrue interest (5% as of 2024); repaid upon sale/death.

Benefits
Property tax deferral (avg. $1,000-$3,000/year, varies by county)

Assisted Living Waiver (ALW)

CA ALW

Age 65+ or disabled
General California resident, Medi-Cal-eligible, nursing home-eligible.
Income Limits ~$2,829/month 300% FBR, individual
Asset Limits $2,000 individual
CA

Available in 15 counties (e.g., LA, Sacramento); waitlists common.

Benefits
Personal care in ALFs (5-7 hours/day) Medication management Social services

California CARES Program

CA CARES

Age
General Caregivers of California residents 60+ needing help with 3+ daily activities; no caregiver age limit.
Income Limits No strict limit; cost-sharing above ~$2,500/month threshold.
Asset Limits Not applicable; need-based.
CA

High demand in urban areas; complements IHSS respite.

Benefits
Respite care (up to 10 days/year) Counseling (4-6 sessions/year) Training (2-3 workshops/year) Supplies (~$200/year)

Frequently Asked Questions about Greenfield Care Center of Fullerton

What neighborhood is Greenfield Care Center of Fullerton in?

Greenfield Care Center of Fullerton is in the Sunny Hills neighborhood of Fullerton.

Is Greenfield Care Center of Fullerton in a walkable area?

Greenfield Care Center of Fullerton has a walk score of 50. Moderately walkable. Some errands can be accomplished on foot, with a mix of nearby amenities.

What is the occupancy rate at Greenfield Care Center of Fullerton?

Greenfield Care Center of Fullerton's occupancy is 86.9%.

Are there photos of Greenfield Care Center of Fullerton?

Yes — there are 6 photos of Greenfield Care Center of Fullerton in the photo gallery on this page.

What is the address of Greenfield Care Center of Fullerton?

Greenfield Care Center of Fullerton is located at 330 W Bastanchury Rd, Fullerton, CA 92835, United States.

What is the phone number of Greenfield Care Center of Fullerton?

(714) 879-4511 will put you in contact with the team at Greenfield Care Center of Fullerton.

Is Greenfield Care Center of Fullerton Medicare or Medicaid certified?

Yes — Greenfield Care Center of Fullerton is a CMS-certified provider of Medicare and Medicaid.

Guides for Better Senior Living

Care Cost Calculator: See Prices in Your Area

Nursing Home Data Explorer

Don’t Wait Too Long: 7 Red Flag Signs Your Parent Needs Assisted Living Now

The True Cost of Assisted Living in 2025 – And How Families Are Paying For It

Understanding Senior Living Costs: Pricing Models, Discounts & Financial Assistance

Explore Open Rooms
1 Contact details
2 What type of senior care service are you looking for?
3 What budget do you have in mind for senior care?
4 How soon do you need to find care?
5 Additional details

Thank you for your interest!

Our team will be in touch shortly to help with next steps.