Explore Open Rooms

1 Contact details
2 What type of senior care service are you looking for?
3 What budget do you have in mind for senior care?
4 How soon do you need to find care?
5 Additional details

Thank you for your interest!

Our team will be in touch shortly to help with next steps.

Senior Living in Cape Coral

Gulf Coast Village

Senior Living in Cape Coral

Gulf Coast Village

1333 Santa Barbara Blvd, Cape Coral, FL 33991 View map
Overview of Gulf Coast Village

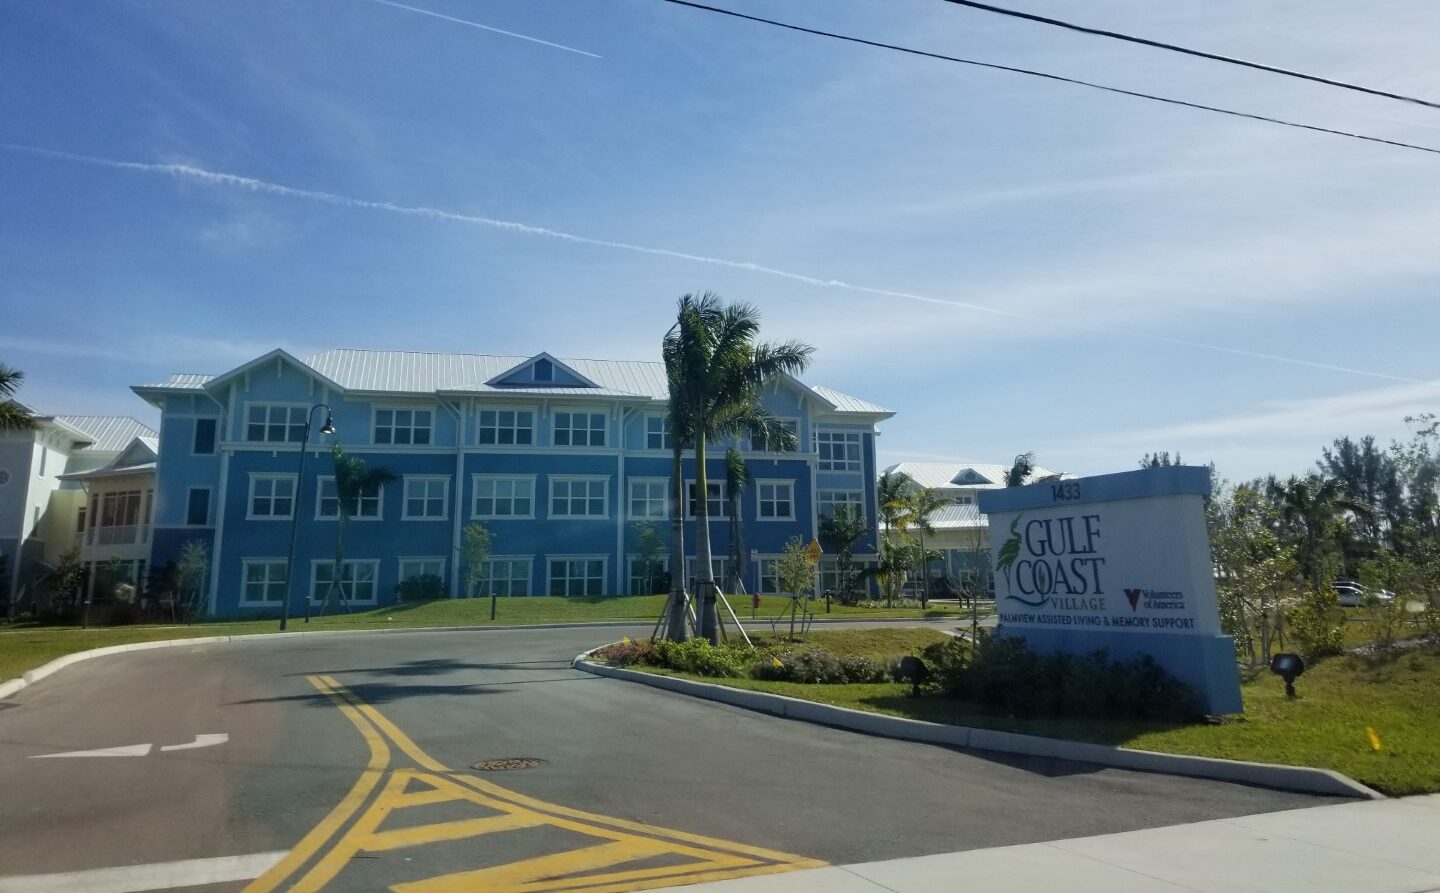
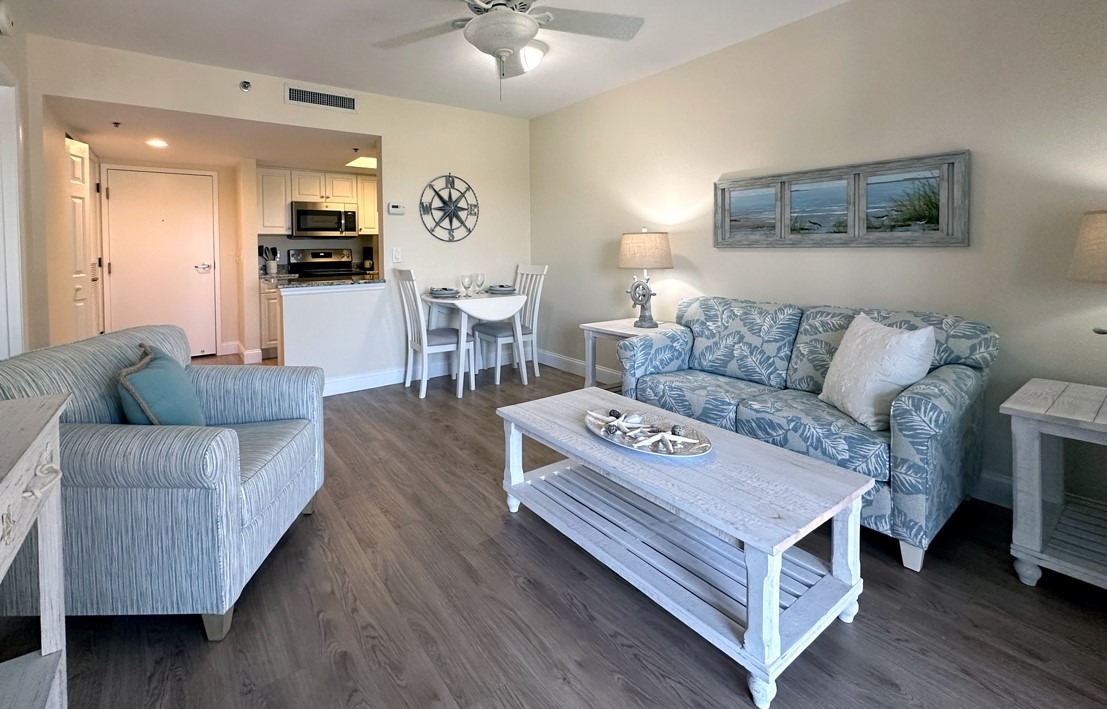
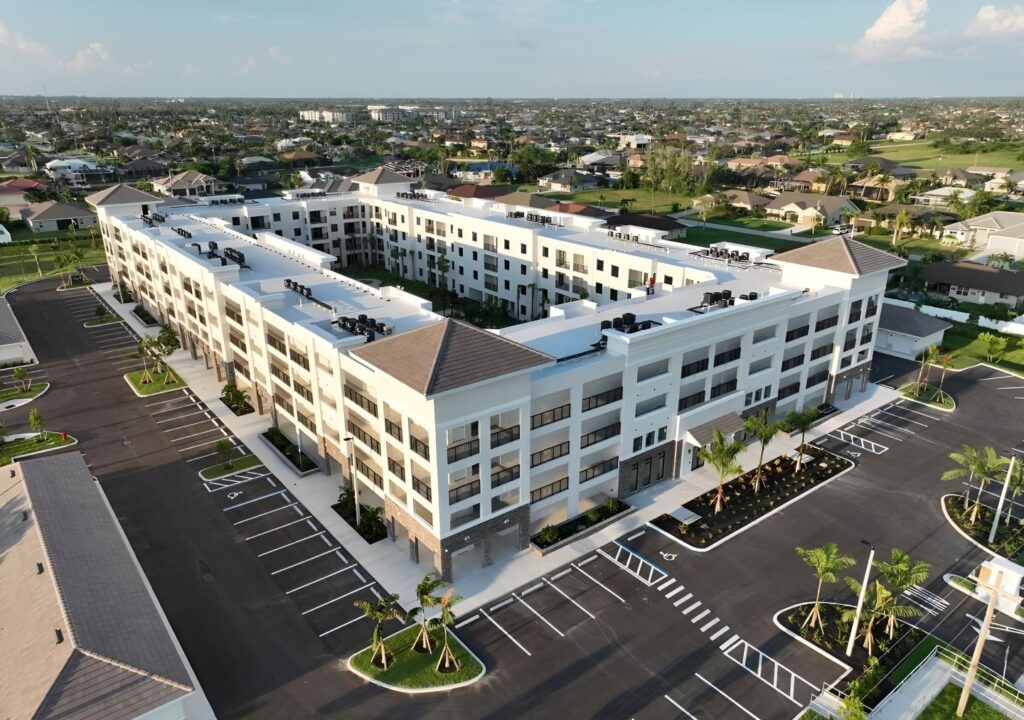
Find the care you need at Gulf Coast Village, an exceptional continuing care retirement community in Cape Coral, FL, offering independent living, assisted living, memory care, skilled nursing, and rehabilitation. Residents enjoy a worry-free lifestyle with biweekly housekeeping and concierge services. All utilities, except telephone, are also included in the monthly rent, easing financial burdens.

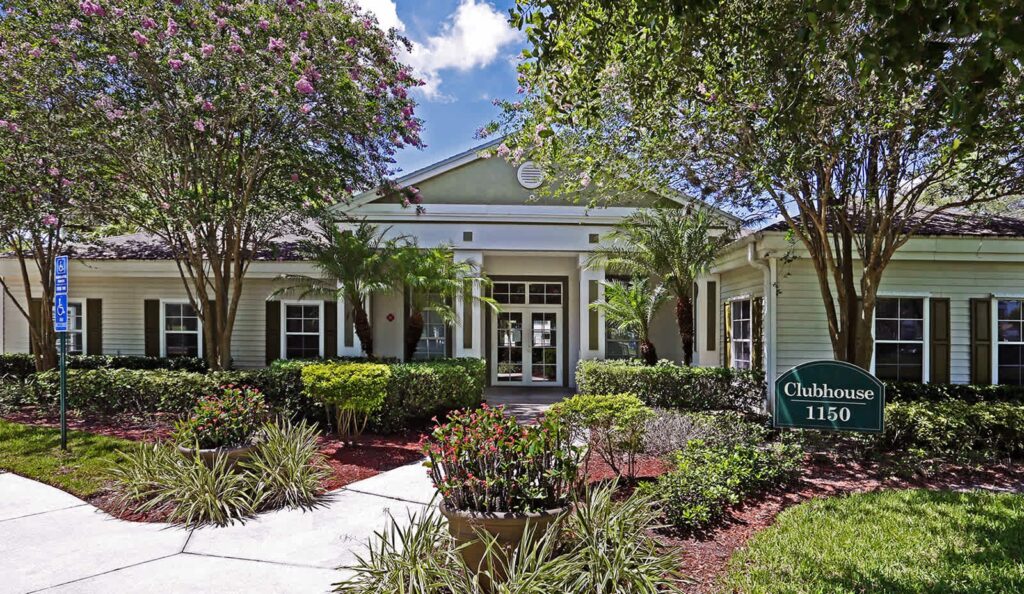
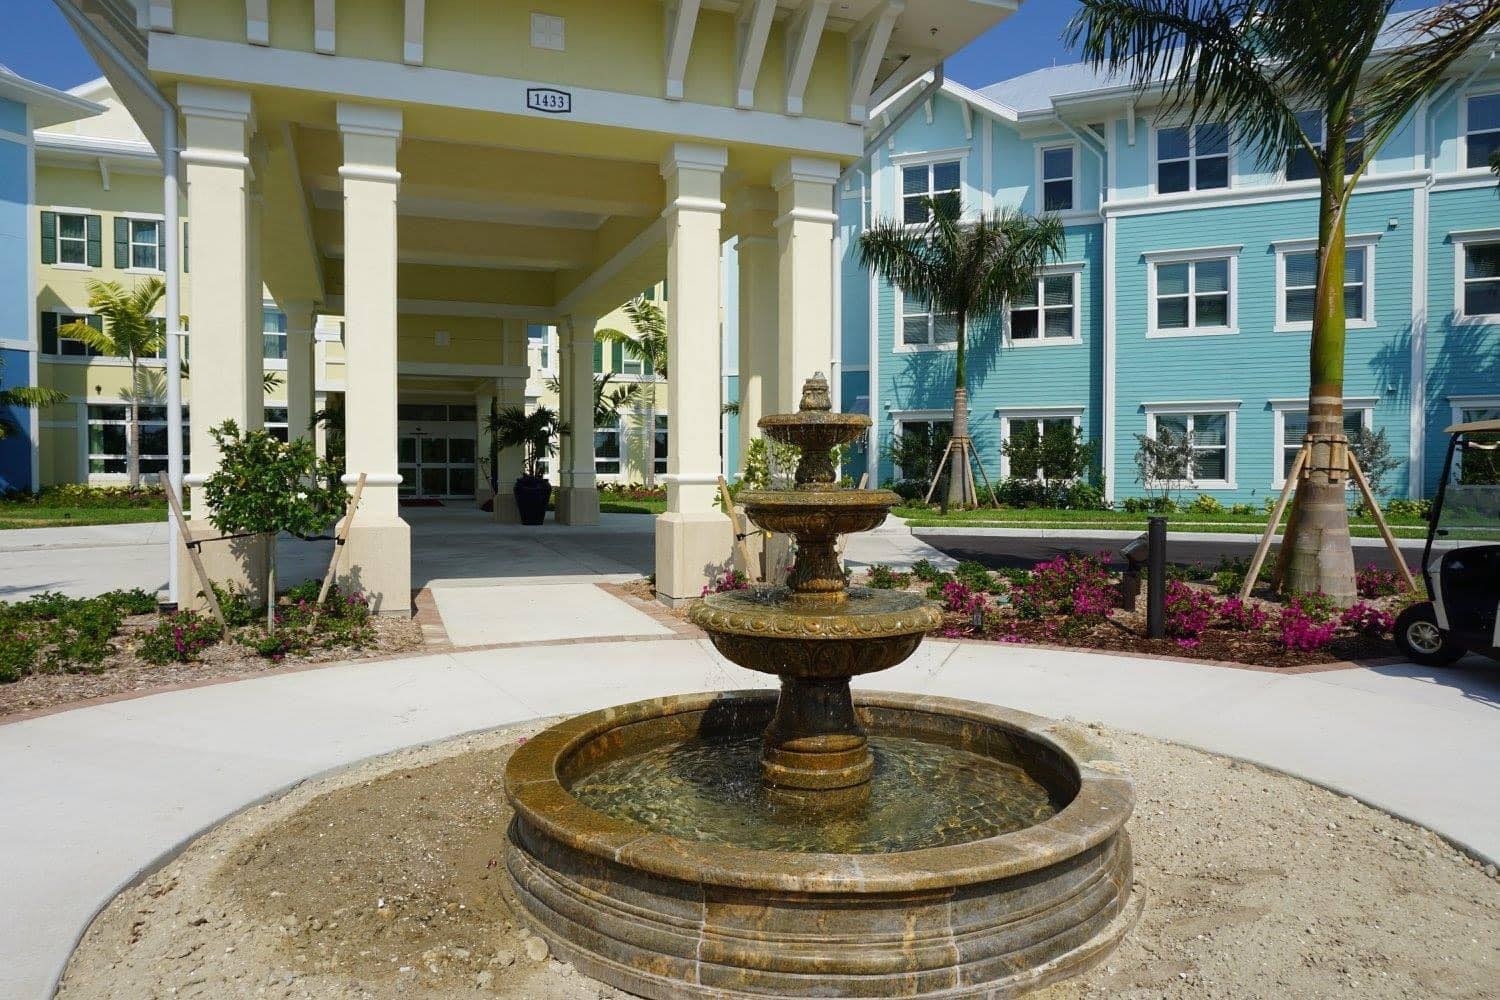
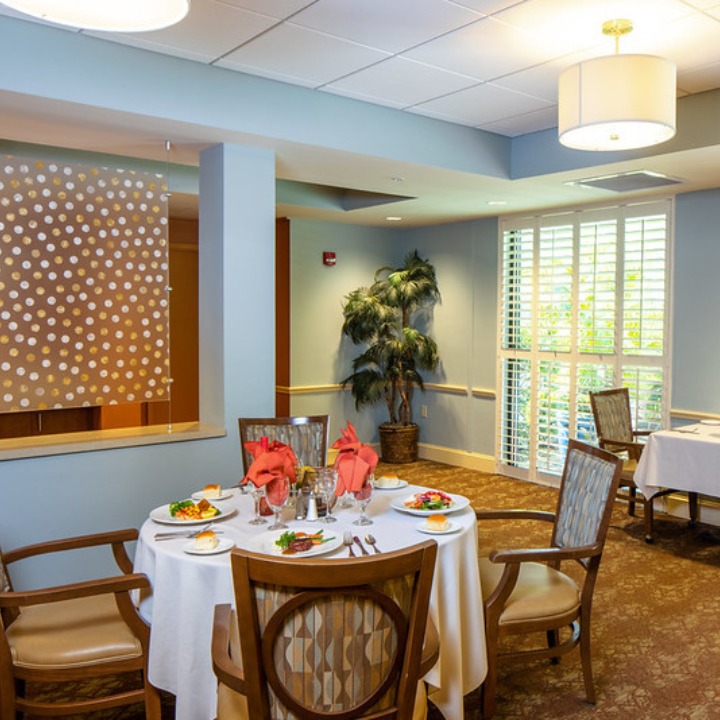
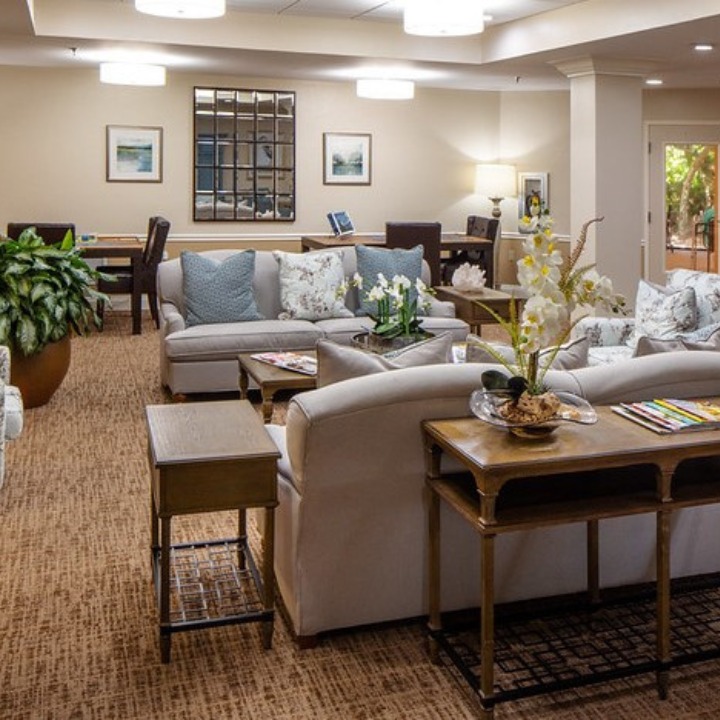
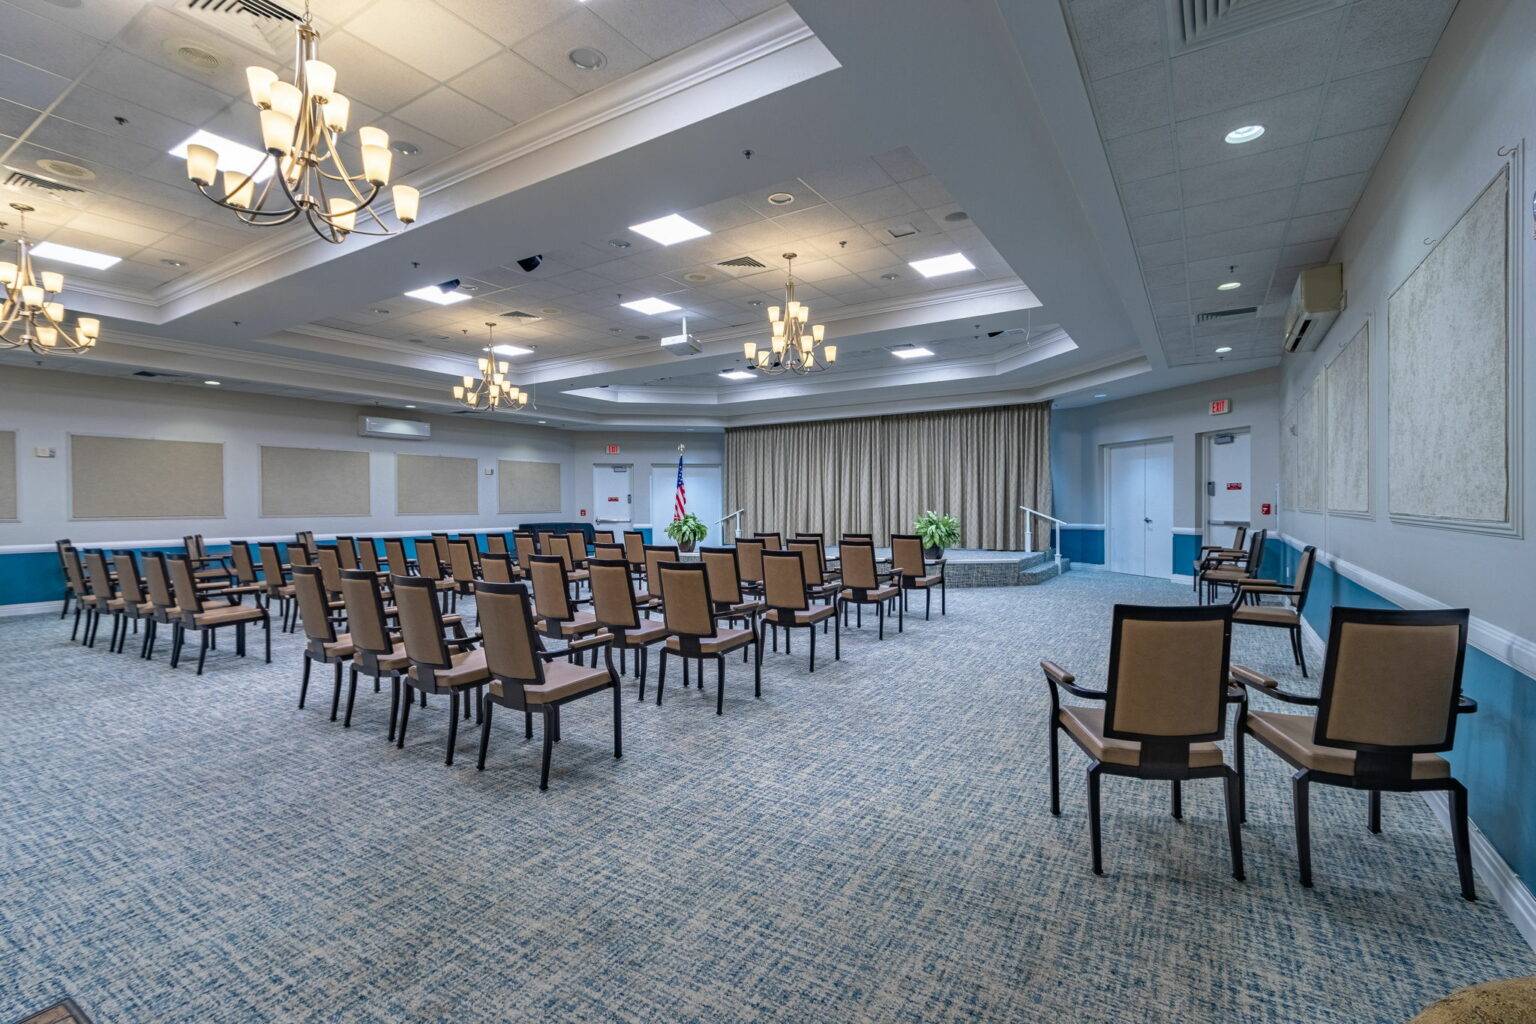
Residents can spend their days as they please with a thoughtfully curated calendar of engaging activities and enriching programs. Delectable and well-balanced chef-prepared dining options are also available to meet residents’ dietary needs and preferences. Amenities include a fitness center, a library, an art gallery, a big screen theater, a chapel, an outdoor pool, a spa, and a community center, ensuring residents’ recreation and wellness.

(407) 232-6080

Managed by Sarah Richard

Executive Director and Interim Care Center and TCU Administrator

Sarah Richard serves as the Executive Director and Interim Care Center and TCU Administrator at Gulf Coast Village. She leads the community with a focus on providing quality care and overseeing daily operations to ensure residents' well-being and comfort.

Capacity and availability

Medium-capacity home

Offers a balance of services and community atmosphere.

Total beds 151

This home usually has limited availability

Occupancy is moderate, suggesting balanced demand.

Similar demand to the Florida average
Occupancy rate 87.5%
Residents per day (avg) 85
Occupancy rate
87.5%
Residents per day (avg)
85

Who this home usually serves

TYPE OF STAY

Mix of rehab and long-term care

This home supports both short-term rehab and long-term care, with residents staying for a wide range of durations.

Breakdown by payment type

Medicare

49% of new residents, usually for short-term rehab.

Typical stay 26 days

Private pay

49% of new residents, often for short stays.

Typical stay 5 - 6 months

Medicaid

2% of new residents, often for long-term daily care.

Typical stay 2 years

Finances and operations

Voluntary non-profit community
Home revenue
$51.2M
Operating deficit
-$5.1M
Voluntary non-profit community
Home revenue
$51,210,323.00
Operating deficit
$-5,084,954.00
Payroll costs Info The portion of the home's budget spent on staff, including nurses, caregivers, and other employees who support care and operations.
$16.0M
31.3% of revenue
Other operating costs Info All remaining costs needed to run the home, such as food, utilities, building maintenance, supplies and administrative expenses.
$40.3M
Total costs $56.3M
Bed community size
151-bed community
A large-scale community that may provide a wide range of amenities, services, and structured programs.
Walk Score
Walk Score: 12 / 100
Car-dependent. Most errands require a car, with limited nearby walkable options.

Payment Types

Other

About this community

Occupancy

Occupancy rate
88%
In line with Florida average
Occupied beds
132 / 151
Average residents 108 per day

License Details

Facility TypeAssisted Living Facility
StatusLicensed
IssuanceJune 12, 2025
ExpirationJune 11, 2027
CountyLee

Additional Licensing Details

License Number12982
CMS Certification Number105672
SNF LicenseSNF License #1188096
State License TypesAL License #12982, HHA License #299993155, HHA License #299991969

Ownership & Operating Entity

Gulf Coast Village is legally operated by Gulf Care Inc, and administrated by Kendra Noble.

Profit StatusNot-For-Profit

Safety & Compliance

Wheelchair Accessible
Emergency SystemsYes

Staffing

Key information about the people who lead and staff this community.

Languages Spoken

Creole English Spanish

Payment & Insurance

1 service
Accept Medicare

Therapy & Rehabilitation

2 services
Rehabilitation Services
Respite Care

Staffing & Medical

3 services
Nursing Services
Skilled Nursing
24-Hour Staffing

Additional Policies & Features

Continuing Care Retirement Community (CCRC)
Minimum Age65

Amenities & Lifestyle

11 amenities
Casual And Fine Dining Venues
Cocktail Lounge
Outdoor Heated Swimming Pool And Spa
Fully Equipped Fitness Center
Walking And Biking Trails
Pet Play Area
Woodworking Shop
Craft Room
Library
Salon
Big-Screen Theater
ActivitiesA variety of recreational, educational, and wellness-related activities are offered.
Specific ProgramsIndependent Living, Assisted Living, Memory Support, Skilled Nursing, Rehabilitation, In-Home Care, Senior Choice at Home
Religious ServicesYes
Volunteer ProgramsYes

Pricing & Financial Information

Dining & Nutrition

Food DescriptionDining options include upscale dining venues and casual bistros, with a focus on senior nutrition.
Special DietsYes

Activities in this home

What does this home offer?

Pets allowed icon
Pets allowed icon

Pets Allowed: Yes, Pets Allowed

Housing options icon

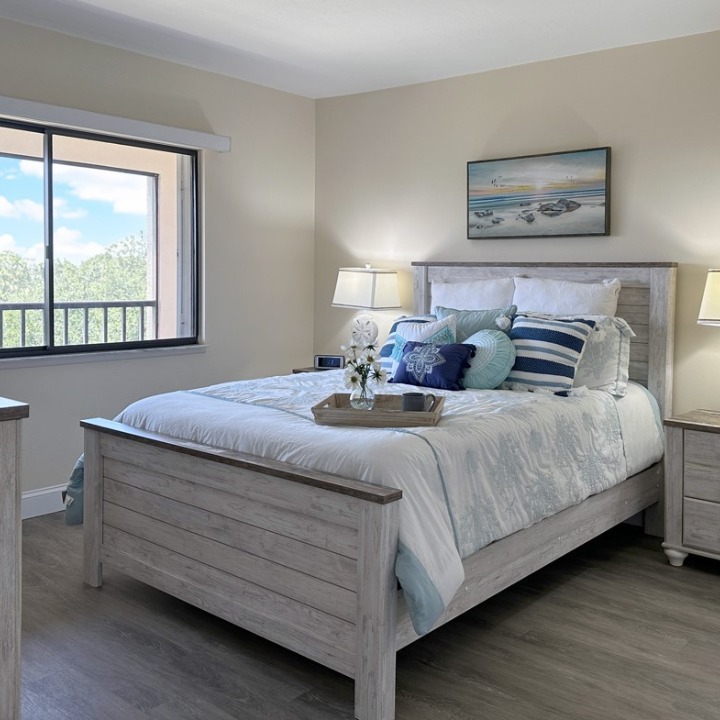
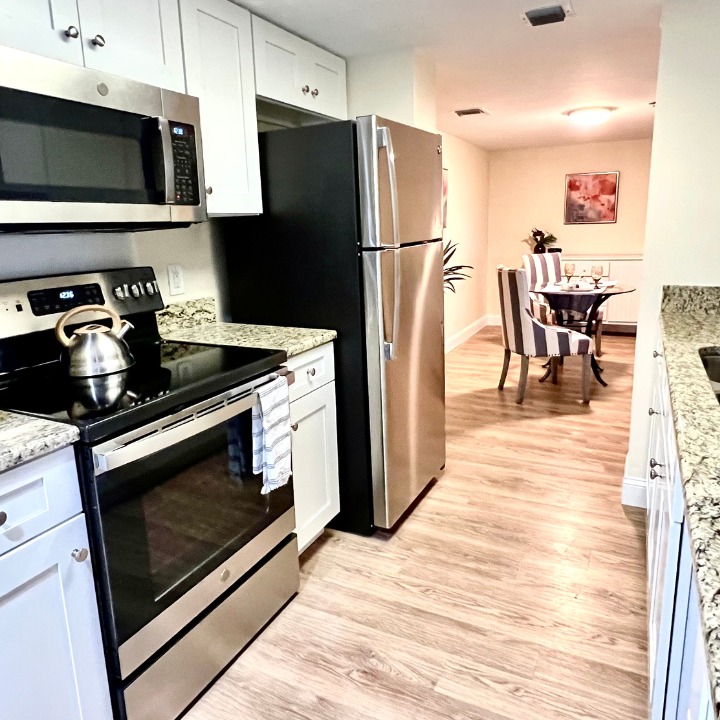
Housing Options: Studio / 1 Bed / 2 Bed

Building type icon
Building type icon

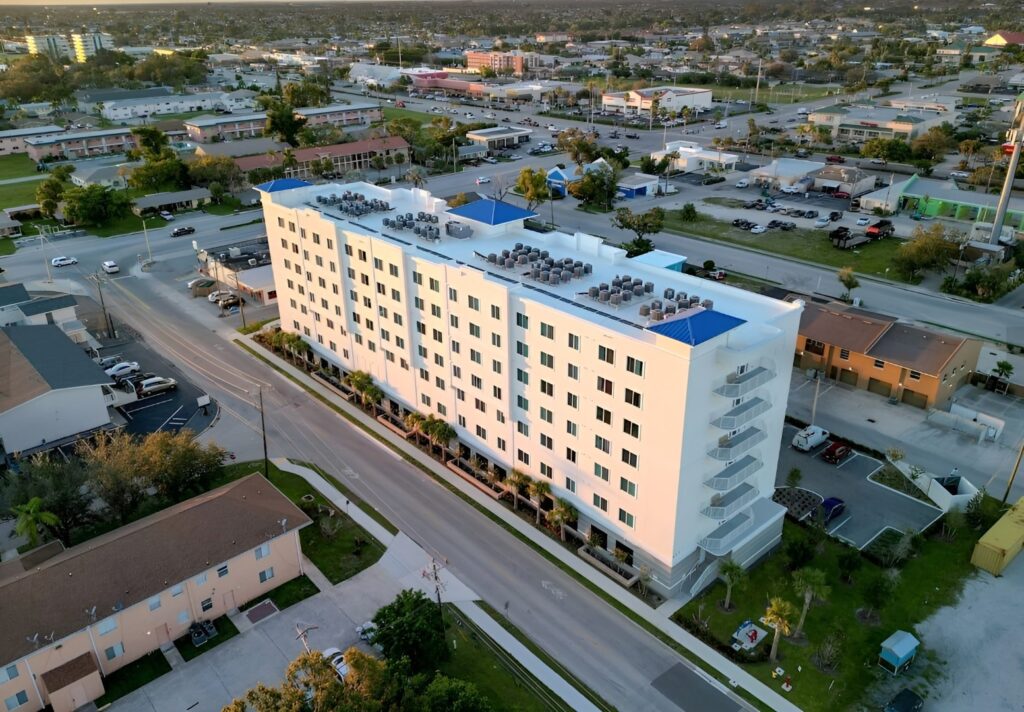
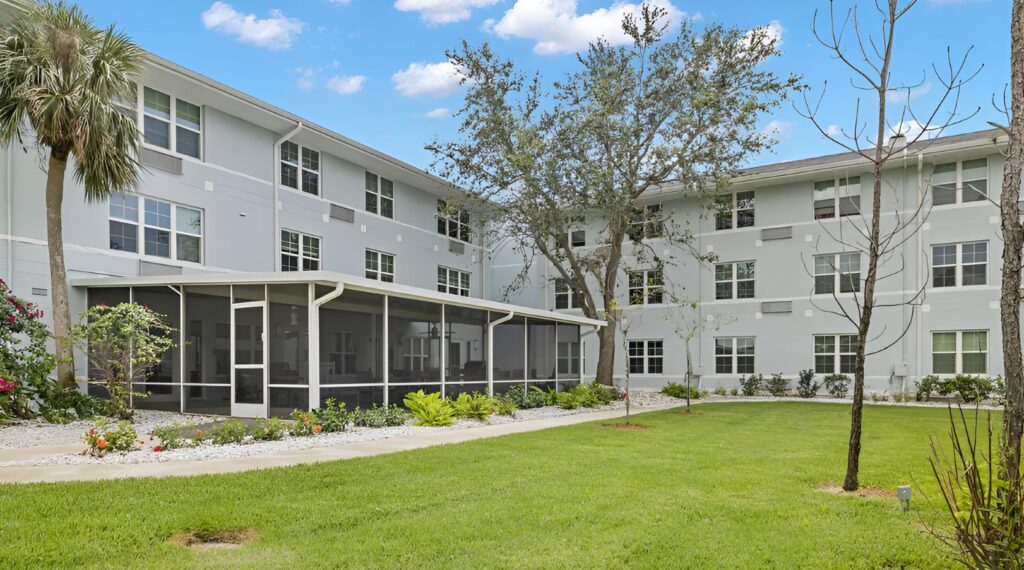
Building Type: 3-story

Dining services icon

Dining Services

Social and recreational activities icon

Social and Recreational Activities

Swimming pool icon
Swimming pool icon

Swimming Pool

Types of Care at Gulf Coast Village

Independent Living Assisted Living
Contact Gulf Coast Village

Access & Eligibility

Ways to qualify for care at this community, including accepted programs and payment options.

Medicare Accepted

This facility is certified for eligible Medicare services.

Payment & Funding Options

Medicare Long-term care insurance

Inspection History

In Florida, the Agency for Health Care Administration (AHCA) is the primary authority that conducts unannounced inspections and completes official health quality reports for all healthcare facilities.

21 visits/inspections

Results

8 with citations

13 without citations

Florida average: 16 inspections with citations

Latest inspection

Date July 28, 2025
Complaint Investigation

24 total citations

Citations indicate regulatory violations. A higher number implies the facility had several areas requiring improvement.

Florida average: 33 citations

11 deficiencies

Deficiencies indicate regulatory issues. A higher number implies the facility had several areas requiring improvement.

Florida average: 19 deficiencies

2 fines

Florida average: 5 fines

Total amount fined: $5,500.00

Florida average: $11,623.53

Inspection Report Summary for Gulf Coast Village

The most recent inspection on July 28, 2025, showed no deficiencies. Earlier inspections presented a mixed pattern, with some citations related mainly to resident care, do not resuscitate orders, staffing standards, staff training, and background screening compliance. Complaint investigations were generally unsubstantiated, and no fines, immediate jeopardy findings, or enforcement actions were listed in the available reports. Prior deficiencies were corrected over time, and the facility’s recent inspections indicate improvement with no current issues noted. This suggests a positive trend toward maintaining compliance in recent years.

Health Inspection History

Inspections
Total health inspections 4

Florida average 4.3


Last Health inspection on May 2025

Total health citations 29

Florida average 19.7

Citations per inspection
7.25

Florida average 4.48


Health citations are formal notices following inspections when they fail to comply with safety and care standards.

24 of 29 citations resulted from standard inspections; and 5 of 29 resulted from complaint investigations.

Breakdown of citation severity (last 3 years)
Critical Health citations More info 8
900% worse than Florida average

Florida average: 0.8


Serious Health citations More info 1
150% worse than Florida average

Florida average: 0.4

8 critical citations More info Florida average: 0.8

1 serious citation More info Florida average: 0.4

20 moderate citations More info Florida average: 18.4

0 minor citations More info Florida average: 0.2
Citations history (last 3 years)
Abuse/Neglect moderate citation Info Issues related to protecting resident's from harm, including abuse, neglect, or mistreatment. May 01, 2025
Corrected

Nutrition moderate citation Info Issues related to food quality, meal service, and resident's nutritional needs. May 01, 2025
Corrected

Quality of Care moderate citation Info Issues related to how well residents receive appropriate treatment and support for their medical and daily care needs. May 01, 2025
Corrected

Quality of Care moderate citation Info Issues related to how well residents receive appropriate treatment and support for their medical and daily care needs. May 01, 2025
Corrected

Compare Senior Living around Cape Coral The information below is reported by the Florida Agency for Health Care Administration (AHCA).

Filter by care type
Gulf Coast Village
NH

Nursing Home Licensed facility providing 24/7 skilled nursing care for residents with complex, ongoing medical needs. Staffed by RNs, LPNs, and CNAs. Inspected and star-rated annually by CMS. Accepts Medicare (short-term rehab) and Medicaid (long-term care).

AL

Assisted Living A licensed, long-term care setting for seniors or individuals with disabilities who need help with daily activities — like bathing, dressing, and medication management — but not 24-hour skilled nursing. Offers housing, meals, and around-the-clock support while aiming to maximize resident independence.

IL

Independent Living Lifestyle-focused communities for older adults offering dining, activities, and transportation with minimal personal care. Best for active, independent seniors who want community without medical support.

Cape Coral (Hancock)
233
Yes
12
Gulf Care Inc
21
38.1%
24
Not-For-Profit
$5,500
Kendra Noble
Studio / 1 Bed / 2 Bed
Cape Southwest 97
IL

Independent Living Lifestyle-focused communities for older adults offering dining, activities, and transportation with minimal personal care. Best for active, independent seniors who want community without medical support.

Cape Coral (Pelican)
-
Yes
3
-
0
0%
0
-
-
-
1 Bed
Crossings at Cape Coral
IL

Independent Living Lifestyle-focused communities for older adults offering dining, activities, and transportation with minimal personal care. Best for active, independent seniors who want community without medical support.

Cape Coral (Hancock)
-
Yes
39
-
0
0%
0
-
-
-
1 Bed / 2 Bed / 3 Bed / 4 Bed
Madison Square Apartments
IL

Independent Living Lifestyle-focused communities for older adults offering dining, activities, and transportation with minimal personal care. Best for active, independent seniors who want community without medical support.

Cape Coral (Caloosahatchee)
-
No
75
-
0
0%
0
-
-
-
1 Bed / 2 Bed
Palm Harbor Apartments
IL

Independent Living Lifestyle-focused communities for older adults offering dining, activities, and transportation with minimal personal care. Best for active, independent seniors who want community without medical support.

North Fort Myers (Hancock)
-
Yes
40
-
0
0%
0
-
-
-
1 Bed / 2 Bed

Living Spaces & Floor Plans

Deluxe 1 Bedroom
Download PDF
Grand 2 Bedroom
Download PDF
Traditional 1 Bedroom
Download PDF
The Boca Grande
Download PDF
Special 1 Bedroom
Download PDF
Supreme 1 Bedroom
Download PDF
The Caladesi
Download PDF
The Captiva
Download PDF
The Gasparilla
Download PDF

Places of interest near Gulf Coast Village

Address 6.1 miles from city center

Address 1333 Santa Barbara Blvd, Cape Coral, FL 33991

Calculate Travel Distance to Gulf Coast Village

Add your location

Address

Staffing Data (Q2 2025)

This data corresponds to Q2 2025 and is based on CMS Payroll-Based Journal.

Total staff 199
Employees 87
Contractors 112
Staff to resident ratio 2.34:1
54% better than Florida average

Florida average ratio: 1.52:1

Avg staff/day 59
Average shift 8.3 hours
5% better than Florida average

Florida average: 7.9 hours

Total staff hours (quarter) 44,488
Nursing staff breakdown
Registered Nurse

Manages medical care and health needs.

Total count 32
Average shift length Info Average shift length. Calculated as total hours divided by days worked and average staff per day. 9.3 hours

This role is partially covered by contractors.

Licensed Practical Nurse

Assists with medical care and medications.

Total count 32
Average shift length Info Average shift length. Calculated as total hours divided by days worked and average staff per day. 8.9 hours

This role is partially covered by contractors.

Certified Nursing Assistant

Helps with daily care and mobility.

Total count 94
Average shift length Info Average shift length. Calculated as total hours divided by days worked and average staff per day. 8.5 hours

This role is partially covered by contractors.

Contractor staffing

Total hours from contractors

18.7%

8,340 contractor hours this quarter

Certified Nursing Assistant: 45 Licensed Practical Nurse: 27 Registered Nurse: 10 Speech Language Pathologist: 7 Physical Therapy Assistant: 5 Physical Therapy Aide: 4 Respiratory Therapy Technician: 4 Qualified Social Worker: 3 Clinical Nurse Specialist: 2 Occupational Therapy Assistant: 2 Medical Director: 1 Occupational Therapy Aide: 1 Nurse Practitioner: 1
Staff by category
Certified Nursing Assistant49459423,76091100%8.5
Registered Nurse2210328,31491100%9.3
Licensed Practical Nurse527323,0758998%8.9
Clinical Nurse Specialist6282,8746673%8
Physical Therapy Aide0441,2626470%7
Speech Language Pathologist0771,2476571%6.9
Physical Therapy Assistant0557526774%6.7
Respiratory Therapy Technician0446377178%6.5
Dietitian1015126571%7.9
RN Director of Nursing1014565763%8
Qualified Social Worker0334136369%6.4
Dental Services Staff1013554549%7.9
Administrator1012883640%8
Nurse Practitioner1122432932%8.4
Occupational Therapy Aide0111782527%7.1
Medical Director011701516%4.7
Occupational Therapy Assistant022544752%1
94 Certified Nursing Assistant
% of Days 100%
32 Registered Nurse
% of Days 100%
32 Licensed Practical Nurse
% of Days 98%
8 Clinical Nurse Specialist
% of Days 73%
4 Physical Therapy Aide
% of Days 70%
7 Speech Language Pathologist
% of Days 71%
5 Physical Therapy Assistant
% of Days 74%
4 Respiratory Therapy Technician
% of Days 78%
1 Dietitian
% of Days 71%
1 RN Director of Nursing
% of Days 63%
3 Qualified Social Worker
% of Days 69%
1 Dental Services Staff
% of Days 49%
1 Administrator
% of Days 40%
2 Nurse Practitioner
% of Days 32%
1 Occupational Therapy Aide
% of Days 27%
1 Medical Director
% of Days 16%
2 Occupational Therapy Assistant
% of Days 52%

Facility Characteristics

Source: CMS Long-Term Care Facility Characteristics (Data as of Jan 2026)

Total census
85 residents
Residents by payment source
Medicare
27 residents (31.8%)
Medicaid
51 residents (60%)
Private pay or other
7 residents (8.2%)
Programs & Services
Residents' Group

Residents meet regularly to discuss policies, care quality, and activities

CCRC

Part of a Continuing Care Retirement Community offering multiple care levels

Active Resident Council

Organized group of residents that meets regularly to discuss facility policies, quality of life, and activities.

Quality of care over time

These measures show how residents usually do over time at this home, based on health outcomes and preventive care.

High-risk clinical events score Info A composite score based on pressure ulcers, falls with injury, weight loss, walking ability decline, and activities of daily living decline. 7.9
6% worse than Florida average

Florida average: 7.4

Functional decline score Info A composite score based on activities of daily living decline, walking ability decline, and incontinence. 14.4
16% worse than Florida average

Florida average: 12.4

Long-stay resident measures
Need for Help with Daily Activities Increased Info Percent of long-stay residents whose need for help with daily activities has increased 15.0%
43% worse than Florida average

Florida average: 10.5%

Walking Ability Worsened Info Percent of long-stay residents whose ability to move independently worsened 8.8%
32% better than Florida average

Florida average: 12.9%

Low Risk Residents with Bowel/Bladder Incontinence Info Percent of low risk long-stay residents who lose control of their bowels or bladder 19.5%
44% worse than Florida average

Florida average: 13.5%

Falls with Major Injury Info Percent of long-stay residents experiencing one or more falls with major injury 4.7%
77% worse than Florida average

Florida average: 2.6%

High Risk Residents with Pressure Ulcers Info Percent of long-stay high risk residents with pressure ulcers 4.0%
26% better than Florida average

Florida average: 5.4%

Urinary Tract Infection Info Percent of long-stay residents with a urinary tract infection 1.6%
78% worse than Florida average

Florida average: 0.9%

Lost Too Much Weight Info Percent of long-stay residents who lose too much weight 7.0%
17% worse than Florida average

Florida average: 6.0%

Depressive Symptoms Info Percent of long-stay residents who have depressive symptoms 4.1%
24% worse than Florida average

Florida average: 3.3%

Antipsychotic Use Info Percent of long-stay residents who received an antipsychotic medication 5.9%
27% better than Florida average

Florida average: 8.0%

Pneumococcal Vaccine Info Percent of long-stay residents assessed and appropriately given the pneumococcal vaccine 99.5%
In line with Florida average

Florida average: 97.7%

Influenza Vaccine Info Percent of long-stay residents assessed and appropriately given the seasonal influenza vaccine 100.0%
In line with Florida average

Florida average: 99.2%

Short-stay resident measures
Pneumococcal Vaccine Info Percent of short-stay residents assessed and appropriately given the pneumococcal vaccine 99.6%
6% better than Florida average

Florida average: 94.0%

Antipsychotic medication increase Info Percent of short-stay residents who newly received an antipsychotic medication 0.3%
77% better than Florida average

Florida average: 1.5%

Influenza Vaccine Info Percent of short-stay residents assessed and appropriately given the seasonal influenza vaccine 100.0%
6% better than Florida average

Florida average: 94.7%

Penalties and fines

Federal penalties imposed by CMS for regulatory violations, including civil money penalties (fines) and denials of payment for new Medicare/Medicaid admissions.

Source: CMS Penalties Database (Data as of Jan 2026)

Total fines amount $96K
33% higher than Florida average

Florida average: $72K

Number of fines 3
14% more fines than Florida average

Florida average: 2.6

Payment Denials Info Serious action where Medicare and/or Medicaid temporarily stops payments for new residents until issues are fixed. 0
100% fewer payment denials than Florida average

Florida average: 0.1

Fines amount comparison
This facility $96K
Florida average $72K
Penalty History

Penalties are imposed by CMS for violations of federal nursing home regulations.

Civil Money Penalty Info Fines imposed for noncompliance, which can be assessed per day or per instance of violation. Apr 2, 2024
$9K
Civil Money Penalty Info Fines imposed for noncompliance, which can be assessed per day or per instance of violation. Apr 2, 2024
$9K
Civil Money Penalty Info Fines imposed for noncompliance, which can be assessed per day or per instance of violation. Apr 18, 2023
$79K

Last updated: Jan 2026

Guides for Better Senior Living

Care Cost Calculator: See Prices in Your Area

Nursing Home Data Explorer

Don’t Wait Too Long: 7 Red Flag Signs Your Parent Needs Assisted Living Now

The True Cost of Assisted Living in 2025 – And How Families Are Paying For It

Understanding Senior Living Costs: Pricing Models, Discounts & Financial Assistance

Financial Aid for Florida Seniors

Get financial aid guidance

Long-Term Care Waiver

Florida Medicaid LTC Waiver

Age 65+ or 21+ disabled, Florida resident, Medicaid- eligible, nursing home-level care need.

~$2,829/month (300% FBR, individual).

$2,000 (individual), $3,000 (couple).

High demand; waitlists common.

Community Care for the Elderly (CCE)

Florida CCE

Age 60+, Florida resident, at risk of nursing home.

~$2,000/month (varies).

$5,000 (individual).

Limited funding; regional variation.

Home Care for the Elderly (HCE)

Florida Home Care for the Elderly

Age 60+, Florida resident, at risk of nursing home placement; caregiver must be approved.

~$2,829/month (individual, aligned with Medicaid thresholds).

~$2,000 (individual); varies by case manager discretion.

Limited funding (~3,500 served annually); prioritizes low-income frail seniors.

Program of All-Inclusive Care for the Elderly (PACE)

Florida Medicaid PACE

Age 55+, Florida resident, nursing home-level care need, safe with PACE support.

~$2,829/month (300% FBR).

$2,000 (individual), $3,000 (couple).

Limited to specific counties (e.g., Hillsborough, Miami-Dade); ~10 sites statewide.

Optional State Supplementation (OSS)

Florida Optional State Supplementation

Age 65+ or disabled, Florida resident, living in approved facility, receiving SSI or low-income.

~$1,004/month (individual, including SSI).

$2,000 (individual), $3,000 (couple).

Limited to specific facility types; ~$78.40/month max supplement.

Senior Community Service Employment Program (SCSEP)

Florida SCSEP (federally funded, state-administered)

Age 55+, unemployed, low-income, Florida resident.

~$1,983/month (125% FPL, individual).

Not specified; income-focused.

Priority for veterans, rural residents; ~1,000 slots/year.

Tour Icon
Planning a tour? Check our touring checklist.
Chat Icon
Thinking of living here? We can help you speak to a current resident