Gulf Coast Village
Nursing Home, Independent Living & Assisted Living · Florida, FL

Gulf Coast Village

Nursing Home, Independent Living & Assisted Living · Florida, FL
Calculator: See prices in your area
Gulf Coast Village accepts Medicare, Medicaid, and private pay.

Overview of Gulf Coast Village

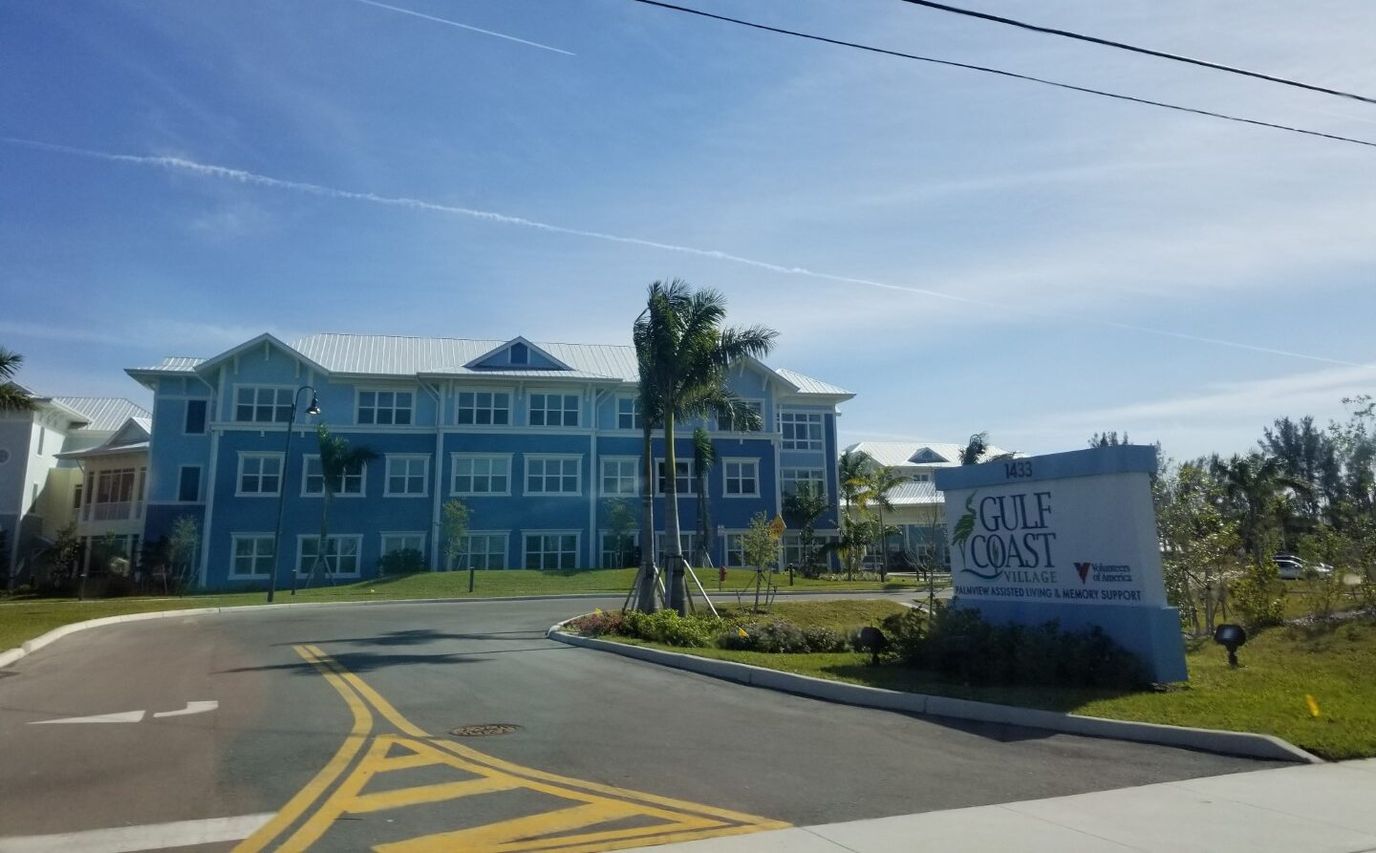
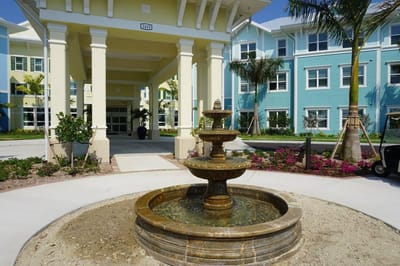
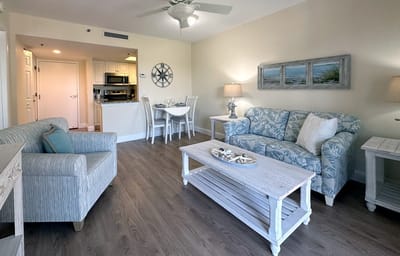
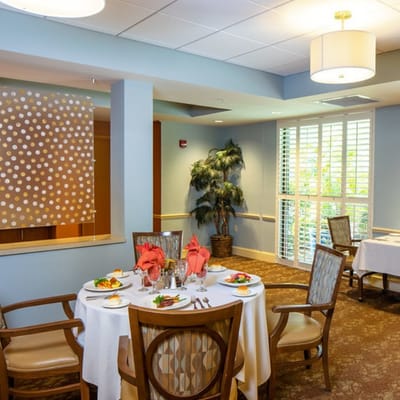
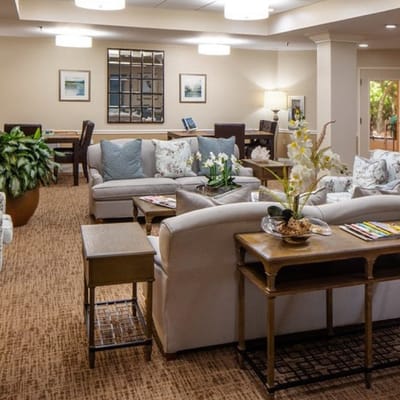
Find the care you need at Gulf Coast Village, an exceptional continuing care retirement community in Cape Coral, FL, offering independent living, assisted living, memory care, skilled nursing, and rehabilitation. Residents enjoy a worry-free lifestyle with biweekly housekeeping and concierge services. All utilities, except telephone, are also included in the monthly rent, easing financial burdens.

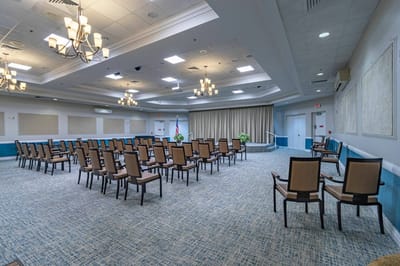
Residents can spend their days as they please with a thoughtfully curated calendar of engaging activities and enriching programs. Delectable and well-balanced chef-prepared dining options are also available to meet residents’ dietary needs and preferences. Amenities include a fitness center, a library, an art gallery, a big screen theater, a chapel, an outdoor pool, a spa, and a community center, ensuring residents’ recreation and wellness.

(888) 927-9409

Staffing hours breakdown

Info Daily nursing hours per resident by staff type, reported to CMS. Higher is generally better — compare this facility to state and national averages to see where staffing stands.

Hours per resident per day — compared to Florida state averages

Total nursing care / resident Info This home is ranked 25th out of 252 homes in Florida. Total adjusted nursing hours per resident per day, combining RN, LPN, and aide time. CMS adjusts this for case-mix so facilities can be fairly compared.
5h 13m per day
Rank #25 / 252Nurse hours — State benchmarkedThis home is ranked 25th out of 252 homes in Florida. Shows adjusted nurse hours per resident per day benchmarked to the Florida average, with a ranking across 252 Florida SNFs. More hours mean more direct care. The national average is about 3.5 hrs; below 3.0 is a red flag.Click the rank badge to see the full State ranking.Click here to see the full State ranking.
vs Florida avg

1 of 6 metrics below state avg

Standout metric Weekend RN is +100% above state avg
Staff typeHours / Day / Residentvs state avg
Registered Nurse (RN) Info RNs hold the highest nursing license and can assess residents, interpret test results, and direct care plans. More RN hours per day often signals stronger clinical oversight and faster response to health changes. 1h 26m per day ▲ 95% State avg: 44m per day · National avg: 41m per day
LPN / LVN Info Licensed Practical Nurses (LPNs) or Licensed Vocational Nurses (LVNs) deliver routine hands-on care — medication administration, wound dressing, and monitoring vital signs. They work under RN supervision and make up a large share of daily bedside care. 30m per day ▼ 36% State avg: 47m per day · National avg: 52m per day
Nurse Aide Info Certified Nurse Aides (CNAs) provide the most direct day-to-day assistance: bathing, dressing, feeding, and mobility. Nurse aide hours are typically the largest staffing category and directly affect residents' quality of life. 3h 8m per day ▲ 34% State avg: 2h 20m per day · National avg: 2h 20m per day
Weekend Total Nursing Info Combined nursing hours (RN + LPN + Nurse Aide) per resident per day on weekends. Staffing often drops on weekends — this figure reveals whether the facility maintains adequate coverage outside of weekday hours. 4h 29m per day ▲ 28% State avg: 3h 31m per day · National avg: 3h 26m per day
Physical Therapist Info Hours per resident per day provided by licensed Physical Therapists (PTs) or PT Assistants. PT services help residents recover mobility after injury or illness and are especially important for post-acute (short-stay) rehabilitation. 5m per day ■ Avg State avg: 5m per day · National avg: 4m per day
Weekend RN Info Registered nurse hours specifically on weekends. Facilities sometimes reduce RN presence on Saturdays and Sundays — a low weekend RN figure compared to weekday hours can indicate reduced clinical oversight when most administrative staff are absent. 1h 4m per day ▲ 100% State avg: 32m per day · National avg: 28m per day

Types of Care at Gulf Coast Village

Independent Living Assisted Living

Capacity and availability

Avg. Length of Stay
62 days
Bed community size
151-bed community Rank #138 / 1065Bed count — State benchmarkedThis home is ranked 138th out of 1065 homes in Florida. Shows this facility's certified or reported bed count compared to other Florida SNFs. Larger communities may offer more amenities, programs, and on-site services for residents and families.Click the rank badge to see the full State ranking.Click here to see the full State ranking.
A large-scale community that may provide a wide range of amenities, services, and structured programs.
Walk Score
Walk Score: 12 / 100 Rank #1223 / 1486Walk Score — State benchmarkedThis home is ranked 1223rd out of 1486 homes in Florida. Shows how walkable this facility's neighborhood is compared to the average Walk Score across Florida SNFs. Higher scores benefit residents, families, and staff.Click the rank badge to see the full State ranking.Click here to see the full State ranking.
Car-dependent. Most errands require a car, with limited nearby walkable options.

About this community

Occupancy

Occupancy rate
88%
Rank #150 / 255Occupancy rate — State benchmarkedThis home is ranked 150th out of 255 homes in Florida. Shows this facility's occupancy rate versus the Florida average, with its Statewide rank out of 255. Higher occupancy signals strong local demand and financial stability.Click the rank badge to see the full State ranking.Click here to see the full State ranking.
Similar to the Florida average: 84.3%
Occupied beds
132 / 151
Average residents per home in Florida 108 per day

License Details

Facility TypeAssisted Living Facility
StatusLicensed
IssuanceDecember 6, 2025
ExpirationNovember 6, 2027
CountyLee
License Number12982
CMS Certification Number105672
SNF LicenseSNF License #1188096
State License TypesAL License #12982, HHA License #299993155, HHA License #299991969

Ownership & Operating Entity

Gulf Coast Village is legally operated by Gulf Care Inc, and administrated by Kendra Noble.

Profit StatusNot-For-Profit

Safety & Compliance

Wheelchair Accessible
Emergency SystemsYes

Staffing

Key information about the people who lead and staff this community.

Languages Spoken

Creole English Spanish

Payment & Insurance

1 service
Accept Medicare

Therapy & Rehabilitation

2 services
Rehabilitation Services
Respite Care

Staffing & Medical

1 service
24-Hour Staffing

Additional Policies & Features

Continuing Care Retirement Community (CCRC)
Minimum Age65

Amenities & Lifestyle

Casual And Fine Dining Venues
Cocktail Lounge
Outdoor Heated Swimming Pool And Spa
Fully Equipped Fitness Center
Walking And Biking Trails
Pet Play Area
Woodworking Shop
Craft Room
Library
Salon
Big-Screen Theater
ActivitiesA variety of recreational, educational, and wellness-related activities are offered.
Specific ProgramsIn-Home Care, Senior Choice at Home
Religious ServicesYes
Volunteer ProgramsYes

Dining & Nutrition

Food DescriptionDining options include upscale dining venues and casual bistros, with a focus on senior nutrition.

Contact Gulf Coast Village

Inspection History

In Florida, the Agency for Health Care Administration (AHCA) is the primary authority that conducts unannounced inspections and completes official health quality reports for all healthcare facilities.

Since 2017 · 9 years of data 26 citations 24 inspections 2 fines $5.5K fined

Inspection Scorecard Info This scorecard compares key inspection, citation, and complaint metrics at this facility against the Florida state average. Metrics rated ≥15% worse than average are highlighted in red; those ≥15% better are highlighted in green.

Since 2017 vs. Florida state average
Overall vs. FL average 0 Worse No metrics in this bucket. 6 Better Metrics better than Florida average:
• Total citations (21% below)
• Citations per year (22% below)
• Citations per inspection (15% below)
• Total inspections (8% below)
• Inspections with citations (38% below)
• Inspection citation rate (32% below)
Latest Inspection July 28, 2025 Complaint Investigation

Citations Info Citations are formal regulatory issues recorded during state inspections.

This FacilityFL Averagevs. FL Avg
Total citations Info Formal regulatory issues recorded by inspectors across all inspection types. 2633 This facility has 21% fewer total citations than a typical Florida nursing home (26 vs. FL avg 33).↓ 21% better
Citations per year Info Average citations per year since 2017. 2.93.7 This facility has 22% fewer citations per year than a typical Florida nursing home (2.9 vs. FL avg 3.7).↓ 22% better
Citations per inspection Info Average citations per inspection. 1.11.3 This facility has 15% fewer citations per inspection than a typical Florida nursing home (1.1 vs. FL avg 1.3).↓ 15% better

Inspections Info State inspections evaluate whether the facility meets health and safety standards.

This FacilityFL Averagevs. FL Avg
Total inspections Info Combined count of all routine and focused inspections. Excludes complaint investigations. 2426 This facility has 8% fewer total inspections than a typical Florida nursing home (24 vs. FL avg 26).↓ 8% better
Inspections with citations Info Inspections that resulted in at least one regulatory citation. 1016 This facility has 38% fewer inspections with citations than a typical Florida nursing home (10 vs. FL avg 16).↓ 38% better
Inspection citation rate Info Percentage of inspections that resulted in at least one citation. 42%62% This facility has 20 percentage points lower inspection citation rate than a typical Florida nursing home (42% vs. FL avg 62%).↓ 20% better

Inspection Reports Summary Info An editor-reviewed summary of the themes and findings across this facility's recent inspection reports.

Palmview at Gulf Coast Village, a Florida assisted living facility, underwent 21 inspections between March 6, 2017, and July 28, 2025. The latest inspection on July 28, 2025, reported no deficiencies. During this period, all 21 inspections cited deficiencies, resulting in a total of 24 line-item deficiencies. Common themes identified included records/documentation and resident care/rights concerns. In response to these findings, the facility implemented corrections to address the cited issues, ultimately achieving a status of No Deficiencies on its latest inspection.

Read the full inspection reports for this facility, including detailed findings and corrective actions.

Show Inspection Reports

Health Inspection History

Inspections since 2022
Total health inspections 4

Florida average 4.3


Last Health inspection on May 2025

Total health citations
29 Rank #204 / 251Health citations — State benchmarkedThis home is ranked 204th out of 251 homes in Florida. Shows this facility's total health deficiency citations benchmarked to the Florida State average, with a ranking across all 251 FL SNFs. Lower citation counts earn a better rank.Click the rank badge to see the full State ranking.Click here to see the full State ranking.

Florida average 19.7

Citations per inspection
7.25 Rank #223 / 251Citations per inspection — State benchmarkedThis home is ranked 223rd out of 251 homes in Florida. Shows average deficiency citations per CMS inspection for this facility versus the Florida mean across 251 SNFs with citation data. Lower is better.Click the rank badge to see the full State ranking.Click here to see the full State ranking.

Florida average 4.48


Health citations are formal notices following inspections when they fail to comply with safety and care standards.

24 of 29 citations resulted from standard inspections; and 5 of 29 resulted from complaint investigations.

Breakdown of citation severity (last 4 years)
Critical Health citations
8
900% worse than Florida average

Florida average: 0.8


Serious Health citations
1 Rank #1 / 56Serious citations (G–I) — State benchmarkedThis home is ranked 1st out of 56 homes in Florida. Shows G–I scope serious health citations for this facility versus other Florida SNFs. Lower counts rank better.Click the rank badge to see the full State ranking.Click here to see the full State ranking.
150% worse than Florida average

Florida average: 0.4

8 critical citations Florida average: 0.8

1 serious citation Florida average: 0.4

20 moderate citations Florida average: 18.4

0 minor citations Florida average: 0.2
Citations history (last 4 years)
Abuse/Neglect moderate citation May 01, 2025
Corrected

Nutrition moderate citation May 01, 2025
Corrected

Quality of Care moderate citation May 01, 2025
Corrected

Quality of Care moderate citation May 01, 2025
Corrected

Staffing Data

Reporting period: October 1 – December 31, 2025 (Q4 2025). Source: CMS Payroll-Based Journal report.

Total staff 203
Employees 122
Contractors 81
Staff to resident ratio 2.39:1
62% better than Florida average
Florida average ratio: 1.47:1 Florida average ratio: 1.47:1See full Florida ranking
Avg staff/day 59
Average shift 8.9 hours
13% better than Florida average
Florida average: 7.9 hours Florida average shift: 7.9 hoursSee full Florida ranking
Total staff hours (quarter) 48,422

Nursing staff breakdown

Q4 2025 · Oct 1 – Dec 31 More info This data comes from the CMS Payroll-Based Journal report covering October 1 – December 31, 2025.
Registered Nurse

Manages medical care and health needs.

RN Staff 39
Average shift length Info Average shift length. Calculated as total hours divided by days worked and average staff per day. 9.5 hours

This role is partially covered by contractors.

Licensed Practical Nurse

Assists with medical care and medications.

LPN Staff 42
Average shift length Info Average shift length. Calculated as total hours divided by days worked and average staff per day. 9.5 hours

This role is partially covered by contractors.

Certified Nursing Assistant

Helps with daily care and mobility.

CNA Staff 80
Average shift length Info Average shift length. Calculated as total hours divided by days worked and average staff per day. 9.5 hours

This role is partially covered by contractors.

Contractor staffing

Q4 2025 · Oct 1 – Dec 31 More info This data comes from the CMS Payroll-Based Journal report covering October 1 – December 31, 2025.

Total hours from contractors

19.7%

9,551 contractor hours this quarter

Licensed Practical Nurse: 29 Certified Nursing Assistant: 27 Registered Nurse: 17 Occupational Therapy Assistant: 2 Medical Director: 1 Clinical Nurse Specialist: 1 Speech Language Pathologist: 1 Administrator: 1 Nurse Practitioner: 1 Occupational Therapy Aide: 1

Staff by category

Q4 2025 · Oct 1 – Dec 31 More info This data comes from the CMS Payroll-Based Journal report covering October 1 – December 31, 2025.
Certified Nursing Assistant53278024,23792100%9.5
Registered Nurse2217398,26892100%9.5
Licensed Practical Nurse1329425,42492100%9.5
Clinical Nurse Specialist4152,1676874%8
Other Dietary Services Staff5051,46192100%7.4
Physical Therapy Aide3031,4166773%7.8
Speech Language Pathologist6171,1556874%6.8
Physical Therapy Assistant5056617278%6.7
Nurse Practitioner1125486166%8.6
Administrator1125166470%8.1
Dental Services Staff1014865964%8.2
Dietitian2024865964%8
Respiratory Therapy Technician3034825964%7.4
Mental Health Service Worker2024075054%7.8
Qualified Social Worker1013815964%6.4
Occupational Therapy Aide0112143235%6.7
Medical Director011661314%5.1
Occupational Therapy Assistant022535762%0.8
80 Certified Nursing Assistant
% of Days 100%
39 Registered Nurse
% of Days 100%
42 Licensed Practical Nurse
% of Days 100%
5 Clinical Nurse Specialist
% of Days 74%
5 Other Dietary Services Staff
% of Days 100%
3 Physical Therapy Aide
% of Days 73%
7 Speech Language Pathologist
% of Days 74%
5 Physical Therapy Assistant
% of Days 78%
2 Nurse Practitioner
% of Days 66%
2 Administrator
% of Days 70%
1 Dental Services Staff
% of Days 64%
2 Dietitian
% of Days 64%
3 Respiratory Therapy Technician
% of Days 64%
2 Mental Health Service Worker
% of Days 54%
1 Qualified Social Worker
% of Days 64%
1 Occupational Therapy Aide
% of Days 35%
1 Medical Director
% of Days 14%
2 Occupational Therapy Assistant
% of Days 62%

Penalties and fines

Includes penalties issued in 2024

Federal penalties imposed by CMS for regulatory violations, including civil money penalties (fines) and denials of payment for new Medicare/Medicaid admissions.

Source: CMS Penalties Database (Data as of Jan 2026)

Total fines amount $96K Rank #230 / 257Federal fines — State benchmarkedThis home is ranked 230th out of 257 homes in Florida. Shows this facility's cumulative CMS federal fine dollars versus the Florida average among facilities with fines, and where it ranks among 257 skilled nursing facilities in the pool. Lower total dollars mean a better rank.Click the rank badge to see the full State ranking.Click here to see the full State ranking.
33% higher than Florida average

Florida average: $72K

Number of fines 3
14% more fines than Florida average

Florida average: 2.6

Payment Denials Info Serious action where Medicare and/or Medicaid temporarily stops payments for new residents until issues are fixed. 0
100% fewer payment denials than Florida average

Florida average: 0.1

Fines amount comparison
This facility $96K
Florida average $72K
Penalty History

Penalties are imposed by CMS for violations of federal nursing home regulations.

2 penalties in the past 3 years

Multiple penalties were reported in the last 3 years.

Civil Money Penalty Info Fines imposed for noncompliance, which can be assessed per day or per instance of violation. Apr 2, 2024
$9K
Civil Money Penalty Info Fines imposed for noncompliance, which can be assessed per day or per instance of violation. Apr 2, 2024
$9K

Last updated: Jan 2026

Quality of care over time

These measures show how residents usually do over time at this home, based on health outcomes and preventive care.

High-risk clinical events score Info A composite score based on pressure ulcers, falls with injury, weight loss, walking ability decline, and activities of daily living decline. 7.9
6% worse than Florida average

Florida average: 7.4

Functional decline score Info A composite score based on activities of daily living decline, walking ability decline, and incontinence. 14.4
16% worse than Florida average

Florida average: 12.4

Long-stay resident measures
Need for Help with Daily Activities Increased Info Percent of long-stay residents whose need for help with daily activities has increased 15.0%
43% worse than Florida average

Florida average: 10.5%

Walking Ability Worsened Info Percent of long-stay residents whose ability to move independently worsened 8.8%
32% better than Florida average

Florida average: 12.9%

Low Risk Residents with Bowel/Bladder Incontinence Info Percent of low risk long-stay residents who lose control of their bowels or bladder 19.5%
44% worse than Florida average

Florida average: 13.5%

Falls with Major Injury Info Percent of long-stay residents experiencing one or more falls with major injury 4.7%
77% worse than Florida average

Florida average: 2.6%

High Risk Residents with Pressure Ulcers Info Percent of long-stay high risk residents with pressure ulcers 4.0%
26% better than Florida average

Florida average: 5.4%

Urinary Tract Infection Info Percent of long-stay residents with a urinary tract infection 1.6%
78% worse than Florida average

Florida average: 0.9%

Lost Too Much Weight Info Percent of long-stay residents who lose too much weight 7.0%
17% worse than Florida average

Florida average: 6.0%

Depressive Symptoms Info Percent of long-stay residents who have depressive symptoms 4.1%
24% worse than Florida average

Florida average: 3.3%

Antipsychotic Use Info Percent of long-stay residents who received an antipsychotic medication 5.9%
27% better than Florida average

Florida average: 8.0%

Pneumococcal Vaccine Info Percent of long-stay residents assessed and appropriately given the pneumococcal vaccine 99.5%
In line with Florida average

Florida average: 97.7%

Influenza Vaccine Info Percent of long-stay residents assessed and appropriately given the seasonal influenza vaccine 100.0%
In line with Florida average

Florida average: 99.2%

Hospitalizations per 1,000 days Info Number of hospitalizations per 1,000 long-stay resident days. 3.81
81% worse than Florida average

Florida average: 2.10

ED visits per 1,000 days Info Number of outpatient emergency department visits per 1,000 long-stay resident days. 0.43
64% better than Florida average

Florida average: 1.18

Short-stay resident measures
Pneumococcal Vaccine Info Percent of short-stay residents assessed and appropriately given the pneumococcal vaccine 99.6%
6% better than Florida average

Florida average: 94.0%

Antipsychotic medication increase Info Percent of short-stay residents who newly received an antipsychotic medication 0.3%
77% better than Florida average

Florida average: 1.5%

Influenza Vaccine Info Percent of short-stay residents assessed and appropriately given the seasonal influenza vaccine 100.0%
6% better than Florida average

Florida average: 94.7%

Re-hospitalized after SNF stay Info Percentage of short-stay residents who were re-hospitalized after their nursing home admission. 32.3%
23% worse than Florida average

Florida average: 26.2%

Emergency department visits Info Percentage of short-stay residents who had an outpatient emergency department visit. 10.3%
11% worse than Florida average

Florida average: 9.3%

Falls with major injury Info Percentage of SNF residents who experience falls with major injury during their stay. 0.6%
18% better than Florida average

Florida average: 0.8%

Ability to care for self at discharge Info Percentage of residents at or above expected ability to care for themselves at discharge. 43.9%
18% worse than Florida average

Florida average: 53.7%

Successful return to home or community Info Rate of successful return to home or community from a skilled nursing facility. 57.8%
14% better than Florida average

Florida average: 50.6%

Breakdown by payment type

Medicare

49% of new residents, usually for short-term rehab.

Typical stay 26 days

Private pay

49% of new residents, often for short stays.

Typical stay 5 - 6 months

Medicaid

2% of new residents, often for long-term daily care.

Typical stay 2 years

Facility Characteristics

Source: CMS Long-Term Care Facility Characteristics (Data as of Jan 2026)

Total residents 85
Medicare
27
31.8% of residents
Medicaid
51
60% of residents
Private pay or other
7
8.2% of residents
Programs & Services
Residents Group

Residents meet regularly to discuss policies, care quality, and activities

CCRC

Part of a Continuing Care Retirement Community offering multiple care levels

Active Resident Council

Organized group of residents that meets regularly to discuss facility policies, quality of life, and activities.

Finances and operations

Voluntary non-profit community
Home revenue
$51.2M
Operating deficit
-$5.1M
Voluntary non-profit community
Home revenue
$51.2M Rank #13 / 256Revenue — State benchmarkedThis home is ranked 13th out of 256 homes in Florida. Shows this facility's annual revenue compared to the Florida SNF average. Higher revenue generally means more resources for staffing and capital — read alongside Payroll %.Click the rank badge to see the full State ranking.Click here to see the full State ranking.
Operating deficit
-$5.1M
Payroll costs Info The portion of the home's budget spent on staff, including nurses, caregivers, and other employees who support care and operations. Rank #11 / 256Payroll — State benchmarkedThis home is ranked 11th out of 256 homes in Florida. Shows total annual staff payroll benchmarked to the Florida average. Higher payroll investment relative to peers often signals better staffing and less reliance on cheaper contract labor.Click the rank badge to see the full State ranking.Click here to see the full State ranking.
$19.2M
37.5% of revenue Rank #192 / 256Payroll % — State benchmarkedThis home is ranked 192nd out of 256 homes in Florida. Shows payroll as a percentage of revenue versus the Florida average. Well-run Florida SNFs typically land around 49–56% — the top third Statewide. Below 25% may signal understaffing or heavy agency use — read with Staffing ratings.Click the rank badge to see the full State ranking.Click here to see the full State ranking.
Other operating costs Info All remaining costs needed to run the home, such as food, utilities, building maintenance, supplies and administrative expenses.
$37.1M
Total costs $56.3M

What does this home offer?

Pets allowed icon
Pets allowed icon

Pets Allowed

Housing options icon

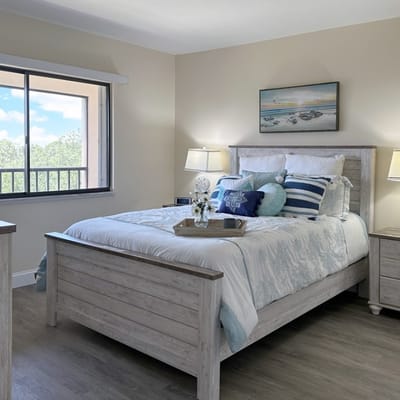
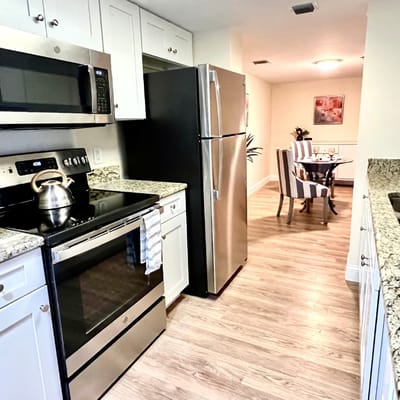
Housing Options: Studio / 1 Bed / 2 Bed

Building type icon
Building type icon

Building Type: 3-story

Dining services icon

Dining Services

Social and recreational activities icon

Social and Recreational Activities

Swimming pool icon
Swimming pool icon

Swimming Pool

Who this home usually serves

TYPE OF STAY

Mix of rehab and long-term care

This home supports both short-term rehab and long-term care, with residents staying for a wide range of durations.

Managed by Sarah Richard

Executive Director and Interim Care Center and TCU Administrator

Sarah Richard serves as the Executive Director and Interim Care Center and TCU Administrator at Gulf Coast Village. She leads the community with a focus on providing quality care and overseeing daily operations to ensure residents' well-being and comfort.

Activities in this home

Living Spaces & Floor Plans for Gulf Coast Village

Deluxe 1 Bedroom
Download PDF
Grand 2 Bedroom
Download PDF
Traditional 1 Bedroom
Download PDF
The Boca Grande
Download PDF
Special 1 Bedroom
Download PDF
Supreme 1 Bedroom
Download PDF
The Caladesi
Download PDF
The Captiva
Download PDF
The Gasparilla
Download PDF

Places of interest near Gulf Coast Village

Address 6.1 miles from city center Info Estimated distance in miles from Cape Coral's city center to Gulf Coast Village's address, calculated via Google Maps.

Calculate Travel Distance to Gulf Coast Village

Add your location

Address

Financial Assistance for
Nursing Home in Florida

Gulf Coast Village is located in Cape Coral, Florida.
Here are the financial assistance programs available to residents in Florida.

Get Financial aid guidance

Long-Term Care Waiver

Florida Medicaid LTC Waiver

Age 65+ or 21+ disabled
General Florida resident, Medicaid- eligible, nursing home-level care need.
Income Limits (2025) ~$2,829/month 300% FBR, individual
Asset Limits $2,000 (individual), $3,000 (couple).
FL

High demand; waitlists common.

Benefits
In-home care (6-8 hours/day) Assisted living Respite (240 hours/year) Case management

Community Care for the Elderly (CCE)

Florida CCE

Age 60+
General Florida resident, at risk of nursing home.
Income Limits ~$2,000/month varies
Asset Limits $5,000 individual
FL

Limited funding; regional variation.

Benefits
Homemaker services (3-5 hours/week) Adult day care (~$60/day) Respite (up to 10 days/year)

Home Care for the Elderly (HCE)

Florida Home Care for the Elderly

Age 60+
General Florida resident, at risk of nursing home placement; caregiver must be approved.
Income Limits (2025) ~$2,829/month individual, aligned with Medicaid thresholds
Asset Limits ~$2,000 (individual); varies by case manager discretion.
FL

Limited funding (~3,500 served annually); prioritizes low-income frail seniors.

Benefits
Basic subsidy (~$160/month) for housing/medical costs; special subsidies for supplies/services (e.g., incontinence supplies, ~$50-$200/month)

Program of All-Inclusive Care for the Elderly (PACE)

Florida Medicaid PACE

Age 55+
General Florida resident, nursing home-level care need, safe with PACE support.
Income Limits (2025) ~$2,829/month 300% FBR
Asset Limits $2,000 (individual), $3,000 (couple).
FL

Limited to specific counties (e.g., Hillsborough, Miami-Dade); ~10 sites statewide.

Benefits
Personal care (5-7 hours/day) Medical care Meals Transportation Therapy

Optional State Supplementation (OSS)

Florida Optional State Supplementation

Age 65+ or disabled
General Florida resident, living in approved facility, receiving SSI or low-income.
Income Limits (2025) ~$1,004/month individual, including SSI
Asset Limits $2,000 (individual), $3,000 (couple).
FL

Limited to specific facility types; ~$78.40/month max supplement.

Benefits
Cash payment (~$78.40/month) for room/board or personal needs in facilities

Frequently Asked Questions about Gulf Coast Village

What neighborhood is Gulf Coast Village in?

Gulf Coast Village is in the Hancock neighborhood of Cape Coral.

What languages are spoken at Gulf Coast Village?

The team at Gulf Coast Village speaks Creole, English, and Spanish.

Who is the owner of Gulf Coast Village?

The legal owner and operator of Gulf Coast Village is Gulf Care Inc.

Is Gulf Coast Village in a walkable area?

Gulf Coast Village has a walk score of 12. Car-dependent. Most errands require a car, with limited nearby walkable options.

What is the license number of Gulf Coast Village?

According to FL state health department records, Gulf Coast Village's license number is 12982.

When does Gulf Coast Village's license expire?

According to FL state health department records, Gulf Coast Village's license expires on November 6, 2027.

What is the occupancy rate at Gulf Coast Village?

Gulf Coast Village's occupancy is 88%.

Guides for Better Senior Living

Care Cost Calculator: See Prices in Your Area

Nursing Home Data Explorer

Don’t Wait Too Long: 7 Red Flag Signs Your Parent Needs Assisted Living Now

The True Cost of Assisted Living in 2025 – And How Families Are Paying For It

Understanding Senior Living Costs: Pricing Models, Discounts & Financial Assistance

Explore Open Rooms
1 Contact details
2 What type of senior care service are you looking for?
3 What budget do you have in mind for senior care?
4 How soon do you need to find care?
5 Additional details

Thank you for your interest!

Our team will be in touch shortly to help with next steps.