Explore Open Rooms

1 Contact details
2 What type of senior care service are you looking for?
3 What budget do you have in mind for senior care?
4 How soon do you need to find care?
5 Additional details

Thank you for your interest!

Our team will be in touch shortly to help with next steps.

Nursing Home in Hayward

CMS overall rating Info The Overall CMS Rating combines results from health inspections, staffing levels and quality measures. Health inspections carry the most weight. Staffing and quality scores can increase or decrease the final rating based on performance compared to state and national standards.

Hayward Gardens Post Acute

1628 B St, Hayward, CA 94541 View map
Overview of Hayward Gardens Post Acute

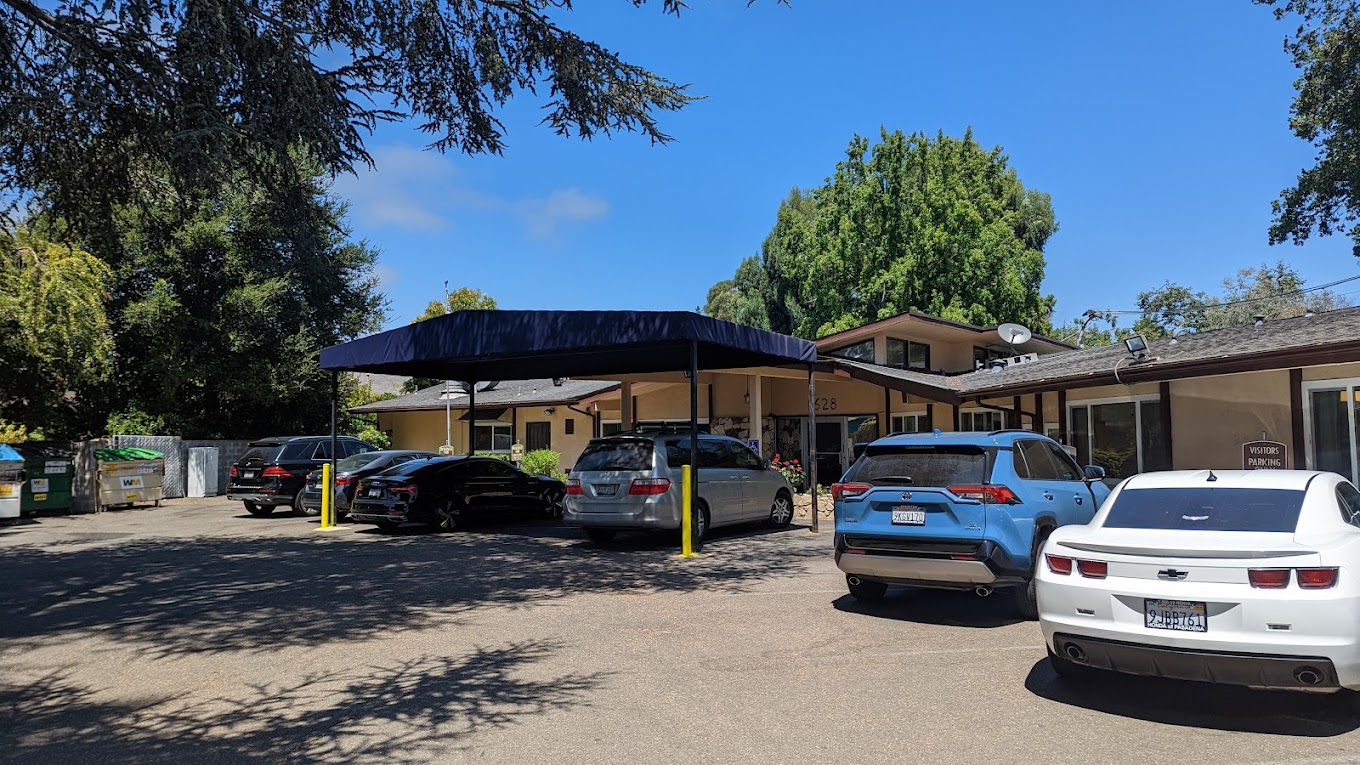
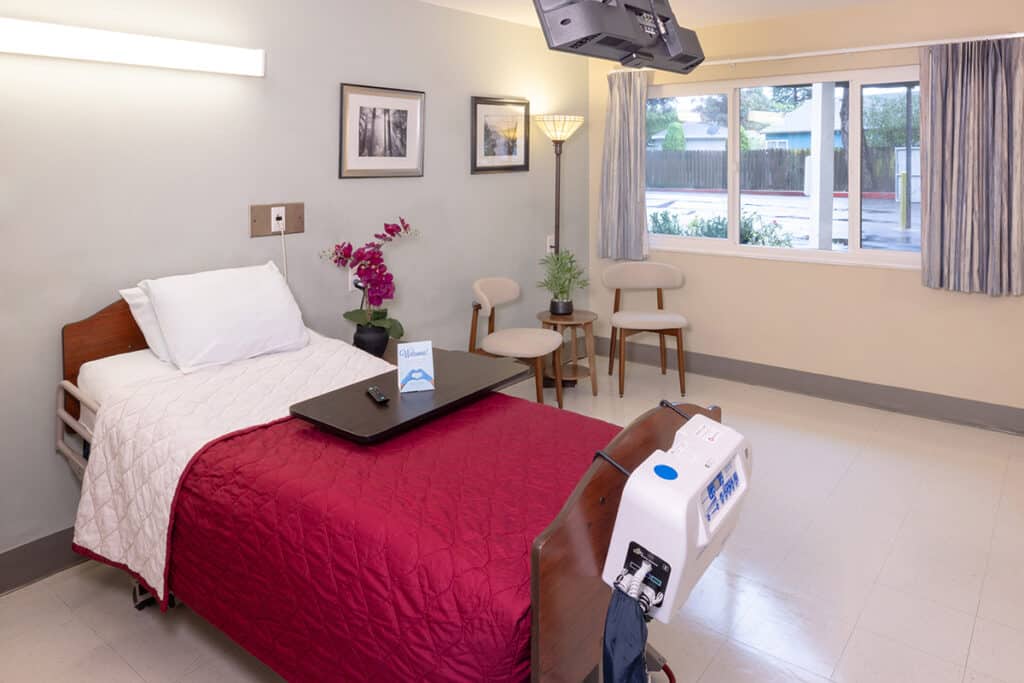
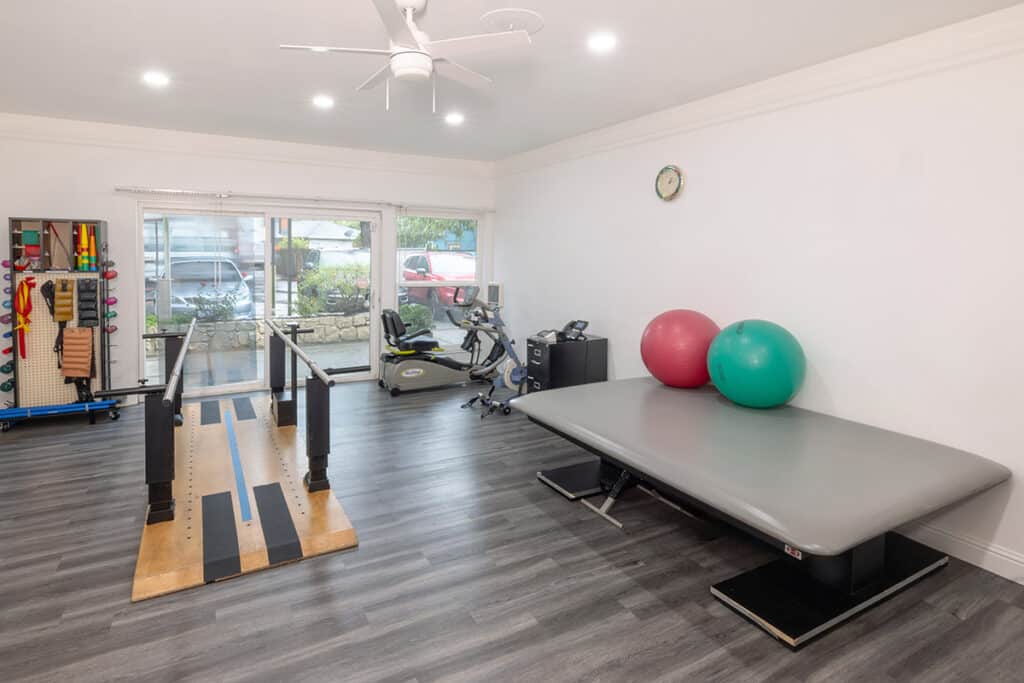
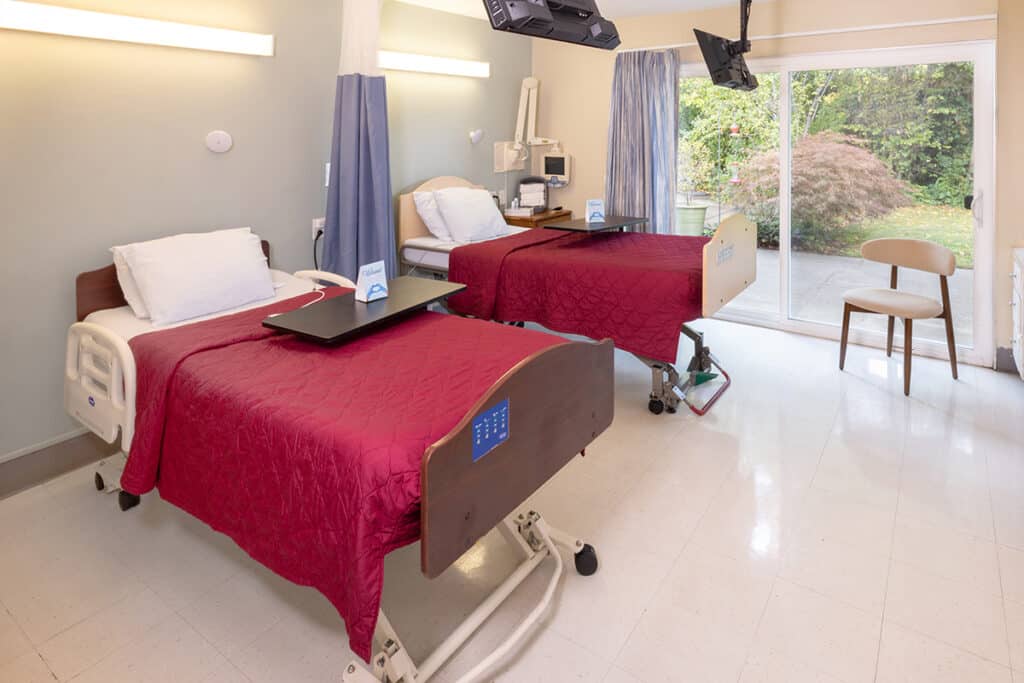
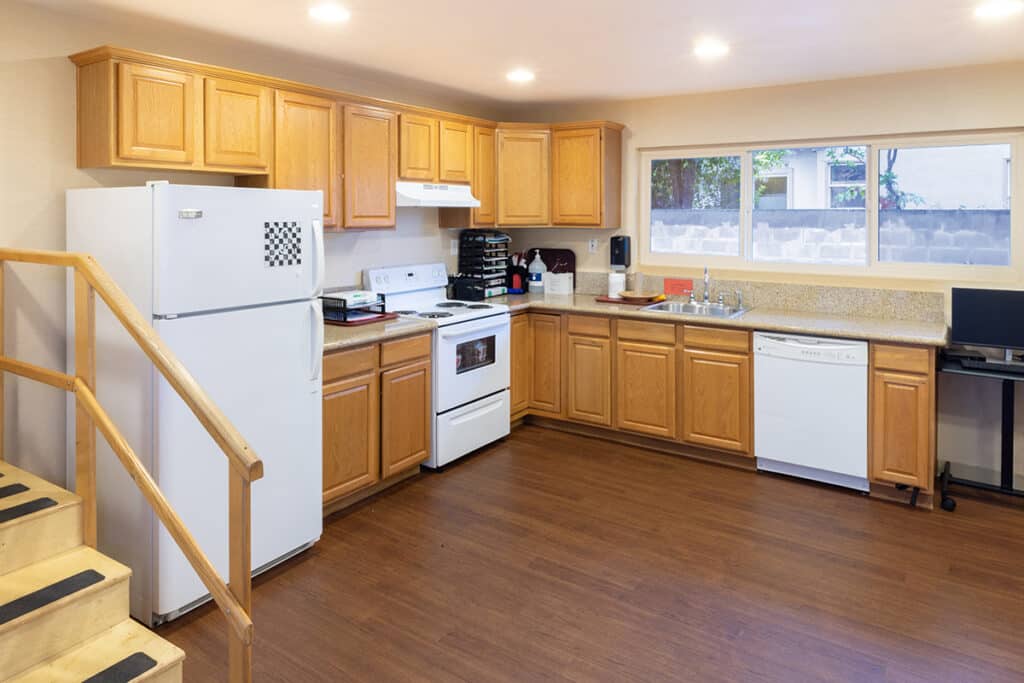
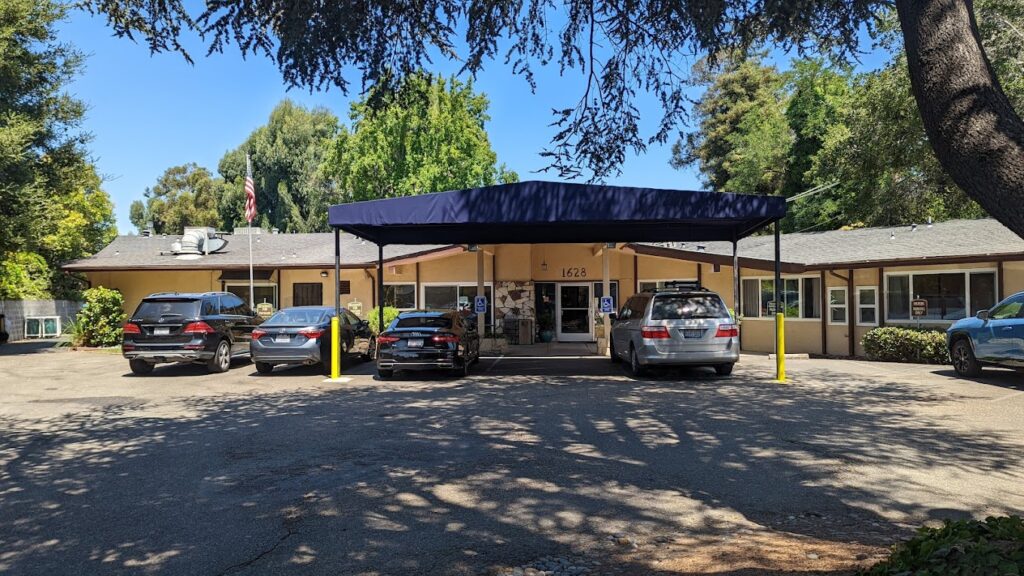
Residing in the serene neighborhood of B Street, Hayward, CA, is the astounding senior living community of Hayward Gardens Post Acute that offers skilled nursing and rehabilitation. The community also provides social services to guide seniors with their retirement plans. With round-the-clock care and assistance from a team of specially trained and responsible professionals, seniors let go of their worries and live their lives to the fullest.

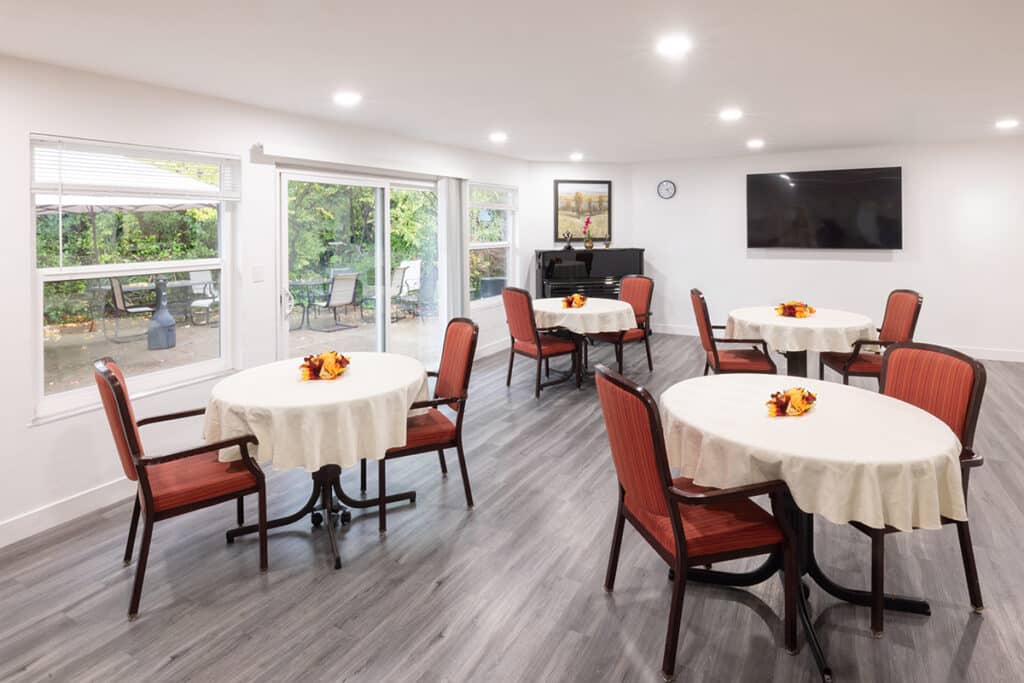
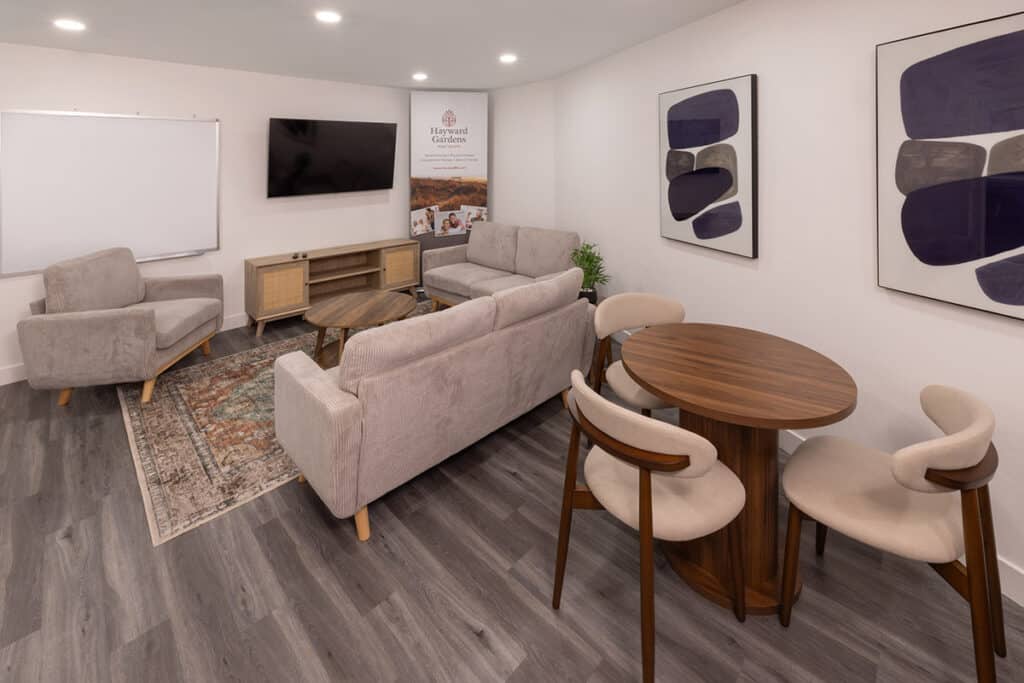
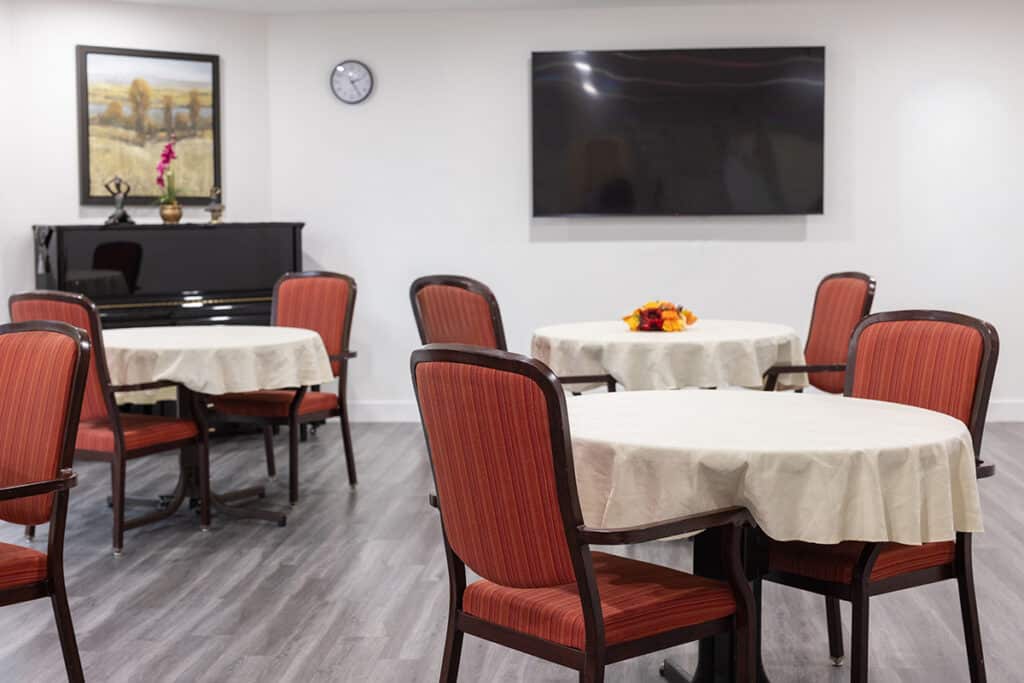
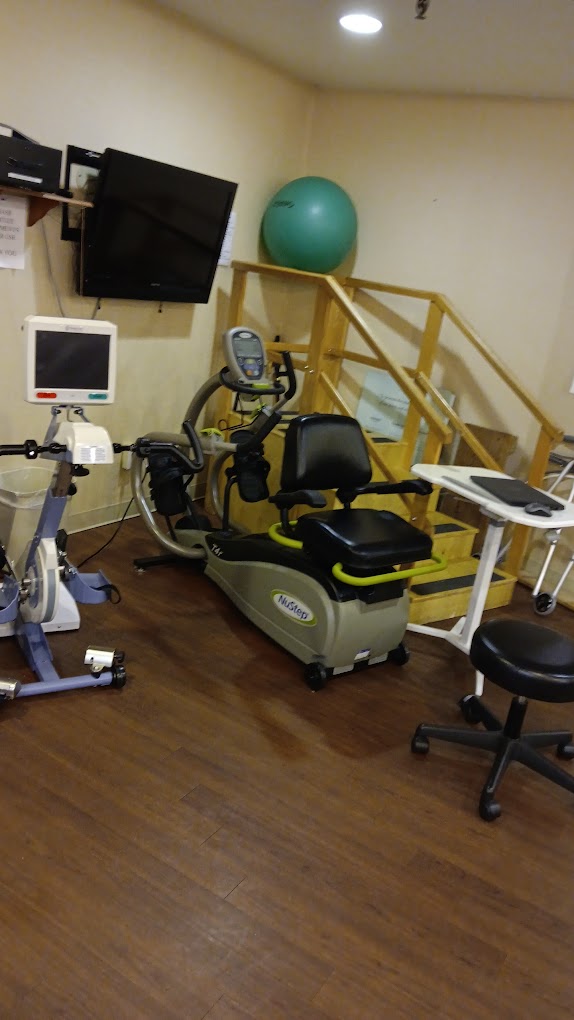
Aside from personalized care, the community also conducts a variety of fun activities and engaging programs to encourage residents to remain active and happy. Promoting a bright and welcoming environment, Hayward Gardens Post Acute ensures seniors have a safe place to spend their golden years blissfully while receiving the utmost care and assistance for their special needs.

(510) 582-4636

Managed by Curtis Porter

Administrator

Curtis Porter serves as the Administrator at Hayward Gardens Post Acute, overseeing the community’s operations to ensure comfort and privacy for residents. He works alongside a dedicated team to provide a welcoming environment with a variety of daily activities designed to support healing and engagement.

Quality ratings

Measured by Centers for Medicare & Medicaid Services (CMS)

Overall rating Info The Overall CMS Rating combines results from health inspections, staffing levels and quality measures. Health inspections carry the most weight. Staffing and quality scores can increase or decrease the final rating based on performance compared to state and national standards.
4/5
California average: 3.6/5
Health Inspection Info Based on the results of the facility's three most recent standard inspections and any complaint investigations. CMS reviews the number, scope, and severity of deficiencies, with more recent findings weighted more heavily.
3/5
California average: 3.2/5
Staffing Info Measures average nursing staff hours per resident per day, including Registered Nurses (RNs) and total nursing staff. Ratings are adjusted based on the level of care residents require and are compared to state and national benchmarks.
3/5
California average: 3.5/5
Quality Measures Info Based on clinical and physical health indicators reported to CMS, such as hospital readmissions, falls, pressure ulcers, and improvements in mobility. These measures reflect how well residents' health needs are being managed.
5/5
California average: 4.3/5

Nursing care per resident

Info This shows how many total hours of nursing staff time are available per resident each day. Higher numbers usually mean more staff support.
3h 25m per day

This home provides 22% less nursing time per resident than the California average.

California average: 4h 23m per day

Staffing hours breakdown

Info Hours of care per resident per day, broken down by staff type. Data from CMS Medicare.
Staff type Facility State avg National avg
Registered Nurse (RN) Info Registered nurse hours per resident per day. 42m per day 39m per day 41m per day
Nurse Aide Info Nurse aide hours per resident per day. 2h 17m per day 2h 39m per day 2h 21m per day
Total Nursing (Weekend) Info Total number of nurse staff hours per resident per day on weekends. 3h 36m per day 4h 5m per day 3h 26m per day
Physical Therapist Info Physical therapist staff hours per resident per day. 16m per day 5m per day 4m per day
RN (Weekend) Info Registered nurse hours per resident per day on weekends. 32m per day 30m per day 29m per day

Capacity and availability

Smaller home

May offer a more intimate, personalized care environment.

Total beds 75

This home usually has limited availability

Occupancy is moderate, suggesting balanced demand.

Similar demand to the California average
Occupancy rate 91.4%
Residents per day (avg) 69
Occupancy rate
91.4%
Residents per day (avg)
69

Who this home usually serves

TYPE OF STAY

Primarily short stays

Residents typically stay for brief periods, with frequent admissions and discharges throughout the year.

Might be optimal for
Post-acute recovery Temporary care Transitional stays

Breakdown by payment type

Medicare

18% of new residents, usually for short-term rehab.

Typical stay 4 days

Private pay

81% of new residents, often for short stays.

Typical stay 2 - 3 months

Medicaid

1% of new residents, often for long-term daily care.

Typical stay 11 - 12 months

Finances and operations

Privately-owned community
Home revenue
$15.1M
Profit
$456.3K
Privately-owned community
Home revenue
$15,050,428.00
Profit
$456,318.00
Payroll costs Info The portion of the home's budget spent on staff, including nurses, caregivers, and other employees who support care and operations.
$4.1M
27.2% of revenue
Other operating costs Info All remaining costs needed to run the home, such as food, utilities, building maintenance, supplies and administrative expenses.
$10.5M
Total costs $14.6M
Walk Score
Walk Score: 75 / 100
Very walkable. Most errands can be accomplished on foot, and many essentials are within a short walk.
BBB Rating
BBB Rating: A- (Not Accredited)
An independent rating from the Better Business Bureau based on factors such as complaint history, transparency, and business practices.
How BBB ratings work

About this community

Therapy & Rehabilitation

1 service
Rehabilitation Services

Staffing & Medical

2 services
Skilled Nursing
24-Hour Staffing

Amenities & Lifestyle

0 amenities
Specific ProgramsNursing Services, Rehabilitation, Activities, Social Services
Operating Hours24/7

What does this home offer?

Building type icon
Building type icon

Building Type: Single-story

Types of Care at Hayward Gardens Post Acute

Skilled Nursing
Contact Hayward Gardens Post Acute

Inspection History

In California, the Department of Social Services (for assisted living facilities) and the Department of Public Health (for nursing homes) conduct inspections to ensure resident safety and regulatory compliance.

Health Inspection History

Inspections
Total health inspections 5

California average 12.5


Last Health inspection on Dec 2024

Total health citations 25

California average 50.2

Citations per inspection
5

California average 4.65


Health citations are formal notices following inspections when they fail to comply with safety and care standards.

23 of 25 citations resulted from standard inspections; and 2 of 25 resulted from complaint investigations.

Breakdown of citation severity (last 3 years)
Critical Health citations More info 0
100% better than California average

California average: 0.4


Serious Health citations More info 1
In line with California average

California average: 1

0 critical citations More info California average: 0.4

1 serious citation More info California average: 1

23 moderate citations More info California average: 47.2

1 minor citation More info California average: 1.5
Citations history (last 3 years)
Infection Control moderate citation Info Issues related to preventing and controlling infections, including hygiene practices and safety protocols. Dec 05, 2024
Corrected

Quality of Care moderate citation Info Issues related to how well residents receive appropriate treatment and support for their medical and daily care needs. Dec 05, 2024
Corrected

Care Planning moderate citation Info Issues related to creating and updating personalized care plans for residents based on their needs and conditions. Dec 05, 2024
Corrected

Care Planning moderate citation Info Issues related to creating and updating personalized care plans for residents based on their needs and conditions. Dec 05, 2024
Corrected

Compare Nursing Homes around Hayward The information below is reported by the California Department of Social Services and Department of Public Health.

2 facilities compared · CMS & CA Dept. of Health data · Updated Apr 2026

Filter by care type
Hayward Gardens Post Acute
AL

Assisted Living A licensed, long-term care setting for seniors or individuals with disabilities who need help with daily activities — like bathing, dressing, and medication management — but not 24-hour skilled nursing. Offers housing, meals, and around-the-clock support while aiming to maximize resident independence.

IL

Independent Living Lifestyle-focused communities for older adults offering dining, activities, and transportation with minimal personal care. Best for active, independent seniors who want community without medical support.

MC

Memory Care Secured, specialized care for people living with Alzheimer's or dementia. Staff trained in cognitive impairment, with higher staff-to-resident ratios and an environment designed to reduce confusion and wandering risk.

NH

Nursing Home Licensed facility providing 24/7 skilled nursing care for residents with complex, ongoing medical needs. Staffed by RNs, LPNs, and CNAs. Inspected and star-rated annually by CMS. Accepts Medicare (short-term rehab) and Medicaid (long-term care).

Hayward (Upper B Street)
75
91.4%
+8%
3.42
-27%
-19%
1
25
5.0
1
69
A-
75
Hadley, Matthew
$15.0M
$4.1M
27.2%
55434
Bella Vista
NH

Nursing Home Licensed facility providing 24/7 skilled nursing care for residents with complex, ongoing medical needs. Staffed by RNs, LPNs, and CNAs. Inspected and star-rated annually by CMS. Accepts Medicare (short-term rehab) and Medicaid (long-term care).

AL

Assisted Living A licensed, long-term care setting for seniors or individuals with disabilities who need help with daily activities — like bathing, dressing, and medication management — but not 24-hour skilled nursing. Offers housing, meals, and around-the-clock support while aiming to maximize resident independence.

HAYWARD
42
91.1%
+8%
4.57
-
+8%
1
0
0.0
0
86
-
-
-
$8.4M
$3.3M
39.7%
45402

Places of interest near Hayward Gardens Post Acute

Address 1.4 miles from city center

Address 1628 B St, Hayward, CA 94541

Calculate Travel Distance to Hayward Gardens Post Acute

Add your location

Address

Staffing Data (Q2 2025)

This data corresponds to Q2 2025 and is based on CMS Payroll-Based Journal.

Total staff 130
Employees 96
Contractors 34
Staff to resident ratio 1.91:1
1911665% better than California average

California average ratio: 0.00:1

Avg staff/day 45
Average shift 7.6 hours
0% compared with California average

California average: 7.7 hours

Total staff hours (quarter) 31,095
Nursing staff breakdown
Registered Nurse

Manages medical care and health needs.

Total count 8
Average shift length Info Average shift length. Calculated as total hours divided by days worked and average staff per day. 8.1 hours

No contractors work on this role.

Licensed Practical Nurse

Assists with medical care and medications.

Total count 18
Average shift length Info Average shift length. Calculated as total hours divided by days worked and average staff per day. 7.9 hours

This role is partially covered by contractors.

Certified Nursing Assistant

Helps with daily care and mobility.

Total count 70
Average shift length Info Average shift length. Calculated as total hours divided by days worked and average staff per day. 8.2 hours

This role is partially covered by contractors.

Contractor staffing

Total hours from contractors

1.1%

349 contractor hours this quarter

Certified Nursing Assistant: 32 Licensed Practical Nurse: 2
Staff by category
Certified Nursing Assistant38327013,57391100%8.2
Licensed Practical Nurse162186,03191100%7.9
Registered Nurse8083,37391100%8.1
Respiratory Therapy Technician6061,4487886%5.9
RN Director of Nursing2021,0246470%8
Physical Therapy Assistant4048748695%5
Speech Language Pathologist4048067886%6.2
Dental Services Staff2026176470%5.9
Nurse Aide in Training1015565965%9.4
Nurse Practitioner1015206571%8
Other Dietary Services Staff2025047380%6.8
Dietitian1014595965%7.8
Physical Therapy Aide3033686369%5.3
Therapeutic Recreation Specialist1012704651%5.9
Qualified Social Worker5052655257%4.5
Administrator1012436470%3.8
Clinical Nurse Specialist1011652123%7.8
70 Certified Nursing Assistant
% of Days 100%
18 Licensed Practical Nurse
% of Days 100%
8 Registered Nurse
% of Days 100%
6 Respiratory Therapy Technician
% of Days 86%
2 RN Director of Nursing
% of Days 70%
4 Physical Therapy Assistant
% of Days 95%
4 Speech Language Pathologist
% of Days 86%
2 Dental Services Staff
% of Days 70%
1 Nurse Aide in Training
% of Days 65%
1 Nurse Practitioner
% of Days 71%
2 Other Dietary Services Staff
% of Days 80%
1 Dietitian
% of Days 65%
3 Physical Therapy Aide
% of Days 69%
1 Therapeutic Recreation Specialist
% of Days 51%
5 Qualified Social Worker
% of Days 57%
1 Administrator
% of Days 70%
1 Clinical Nurse Specialist
% of Days 23%

Facility Characteristics

Source: CMS Long-Term Care Facility Characteristics (Data as of Jan 2026)

Total census
68 residents
Residents by payment source
Medicare
9 residents (13.2%)
Medicaid
34 residents (50%)
Private pay or other
25 residents (36.8%)
Programs & Services
Residents' Group

Residents meet regularly to discuss policies, care quality, and activities

Active Resident Council

Organized group of residents that meets regularly to discuss facility policies, quality of life, and activities.

Quality of care over time

These measures show how residents usually do over time at this home, based on health outcomes and preventive care.

High-risk clinical events score Info A composite score based on pressure ulcers, falls with injury, weight loss, walking ability decline, and activities of daily living decline. 2.2
67% better than California average

California average: 6.6

Functional decline score Info A composite score based on activities of daily living decline, walking ability decline, and incontinence. 6.1
47% better than California average

California average: 11.3

Long-stay resident measures
Significantly above average California avg: 4.3 Info CMS star rating based on long-stay quality measure performance. 5 stars = significantly above average, 1 star = significantly below average.
Need for Help with Daily Activities Increased Info Percent of long-stay residents whose need for help with daily activities has increased 6.9%
37% better than California average

California average: 11.1%

Walking Ability Worsened Info Percent of long-stay residents whose ability to move independently worsened 0.0%
100% better than California average

California average: 12.0%

Low Risk Residents with Bowel/Bladder Incontinence Info Percent of low risk long-stay residents who lose control of their bowels or bladder 11.2%
In line with California average

California average: 11.3%

Falls with Major Injury Info Percent of long-stay residents experiencing one or more falls with major injury 0.0%
100% better than California average

California average: 1.7%

High Risk Residents with Pressure Ulcers Info Percent of long-stay high risk residents with pressure ulcers 2.5%
49% better than California average

California average: 5.0%

Urinary Tract Infection Info Percent of long-stay residents with a urinary tract infection 0.7%
48% better than California average

California average: 1.2%

Lost Too Much Weight Info Percent of long-stay residents who lose too much weight 1.4%
66% better than California average

California average: 4.2%

Depressive Symptoms Info Percent of long-stay residents who have depressive symptoms 0.7%
89% better than California average

California average: 6.7%

Antipsychotic Use Info Percent of long-stay residents who received an antipsychotic medication 2.8%
72% better than California average

California average: 10.1%

Pneumococcal Vaccine Info Percent of long-stay residents assessed and appropriately given the pneumococcal vaccine 100.0%
In line with California average

California average: 98.5%

Influenza Vaccine Info Percent of long-stay residents assessed and appropriately given the seasonal influenza vaccine 100.0%
In line with California average

California average: 98.2%

Hospitalizations per 1,000 days Info Number of hospitalizations per 1,000 long-stay resident days. 3.35
49% worse than California average

California average: 2.25

ED visits per 1,000 days Info Number of outpatient emergency department visits per 1,000 long-stay resident days. 1.47
8% better than California average

California average: 1.59

Short-stay resident measures
Significantly above average California avg: 3.5 Info CMS star rating based on short-stay quality measure performance. 5 stars = much above average, 1 star = much below average.
Pneumococcal Vaccine Info Percent of short-stay residents assessed and appropriately given the pneumococcal vaccine 94.6%
In line with California average

California average: 94.0%

Antipsychotic medication increase Info Percent of short-stay residents who newly received an antipsychotic medication 0.1%
90% better than California average

California average: 1.5%

Influenza Vaccine Info Percent of short-stay residents assessed and appropriately given the seasonal influenza vaccine 96.3%
In line with California average

California average: 93.2%

Re-hospitalized after SNF stay Info Percentage of short-stay residents who were re-hospitalized after their nursing home admission. 17.8%
23% better than California average

California average: 23.2%

Emergency department visits Info Percentage of short-stay residents who had an outpatient emergency department visit. 8.8%
21% better than California average

California average: 11.2%

Falls with major injury Info Percentage of SNF residents who experience falls with major injury during their stay. 0.0%
100% better than California average

California average: 0.8%

Ability to care for self at discharge Info Percentage of residents at or above expected ability to care for themselves at discharge. 59.3%
10% better than California average

California average: 53.7%

Successful return to home or community Info Rate of successful return to home or community from a skilled nursing facility. 62.9%
24% better than California average

California average: 50.6%

Penalties and fines

Federal penalties imposed by CMS for regulatory violations, including civil money penalties (fines) and denials of payment for new Medicare/Medicaid admissions.

Source: CMS Penalties Database (Data as of Jan 2026)

Total fines amount $18K
67% lower than California average

California average: $55K

Number of fines 1
58% fewer fines than California average

California average: 2.4

Payment Denials Info Serious action where Medicare and/or Medicaid temporarily stops payments for new residents until issues are fixed. 0
100% fewer payment denials than California average

California average: 0.5

Fines amount comparison
This facility $18K
California average $55K
Penalty History

Penalties are imposed by CMS for violations of federal nursing home regulations.

Civil Money Penalty Info Fines imposed for noncompliance, which can be assessed per day or per instance of violation. Jun 9, 2023
$18K

Last updated: Jan 2026

Guides for Better Senior Living

Care Cost Calculator: See Prices in Your Area

Nursing Home Data Explorer

Don’t Wait Too Long: 7 Red Flag Signs Your Parent Needs Assisted Living Now

The True Cost of Assisted Living in 2025 – And How Families Are Paying For It

Understanding Senior Living Costs: Pricing Models, Discounts & Financial Assistance

Financial Aid for California Seniors

Get financial aid guidance

Multipurpose Senior Services Program

MSSP (Medi-Cal Waiver)

Age 65+, California resident, Medi-Cal eligible, nursing home risk.

~$2,829/month (300% FBR, individual).

$2,000 (individual), $3,000 (couple).

County-managed; waitlists possible.

In-Home Supportive Services (IHSS)

California IHSS

Age 65+, California resident, Medicaid-eligible or low-income.

~$1,732/month (individual, Medi-Cal threshold).

$2,000 (individual).

Can hire family as caregivers.

Multipurpose Senior Services Program (MSSP)

CA MSSP

Age 65+, California resident, Medi-Cal-eligible, nursing home-eligible but community-capable.

~$2,829/month (300% FBR, individual).

$2,000 (individual).

Available in 38 counties; waitlists common.

Property Tax Postponement Program (PTP)

CA PTP

Age 62+, California resident, own and live in home, 40% equity.

~$51,500/year (household, adjusted annually).

Equity-based; no strict asset cap.

Deferred taxes accrue interest (5% as of 2024); repaid upon sale/death.

Assisted Living Waiver (ALW)

CA ALW

Age 65+ or disabled, California resident, Medi-Cal-eligible, nursing home-eligible.

~$2,829/month (300% FBR, individual).

$2,000 (individual).

Available in 15 counties (e.g., LA, Sacramento); waitlists common.

California CARES Program

CA CARES

Caregivers of California residents 60+ needing help with 3+ daily activities; no caregiver age limit.

No strict limit; cost-sharing above ~$2,500/month threshold.

Not applicable; need-based.

High demand in urban areas; complements IHSS respite.

Low-Income Home Energy Assistance Program (LIHEAP)

CA LIHEAP

Age 60+ priority, California resident, low-income, utility/heating need.

~$2,510/month (200% of poverty level, individual).

Not applicable; income-focused.

High demand in inland/coastal extremes; weatherization capped at $5,000/home.

Tour Icon
Planning a tour? Check our touring checklist.
Chat Icon
Thinking of living here? We can help you speak to a current resident