


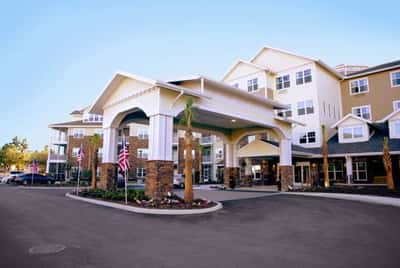
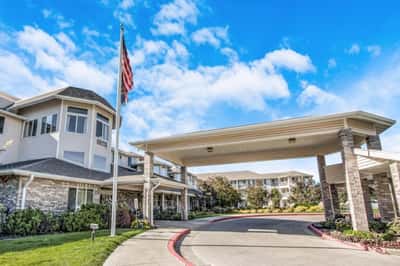
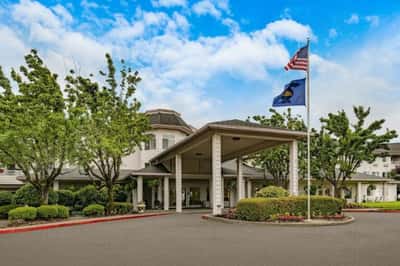


Bella Vista Gracious Retirement Living
Bella Vista Gracious Retirement Living
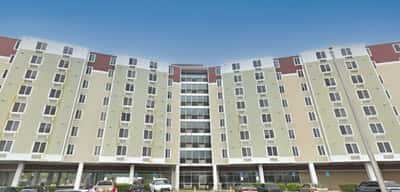
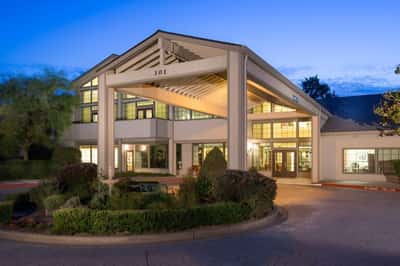
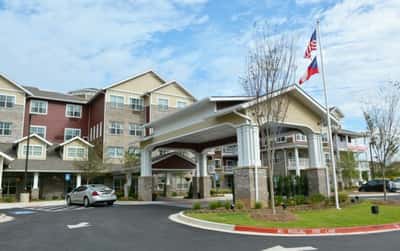
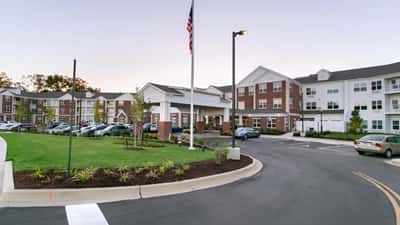
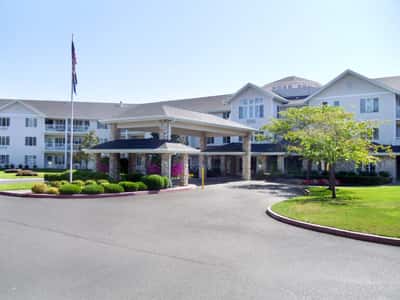
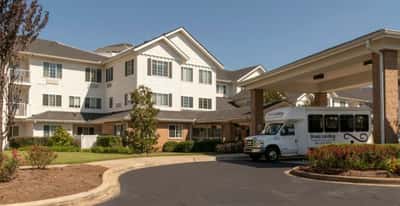
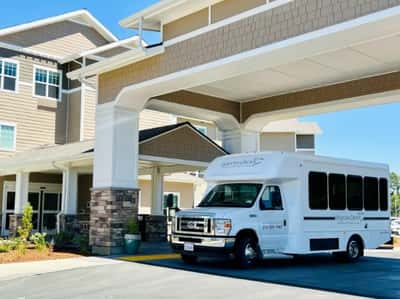
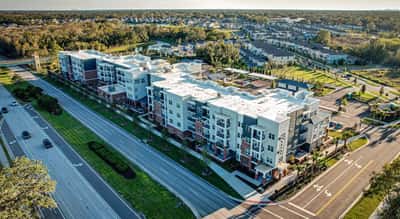
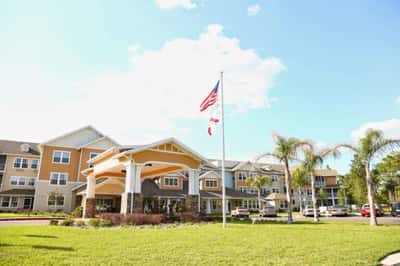
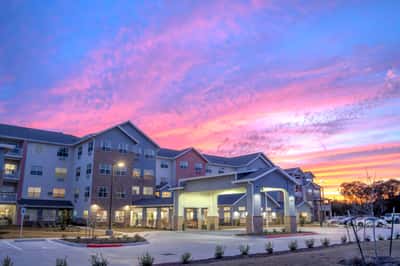
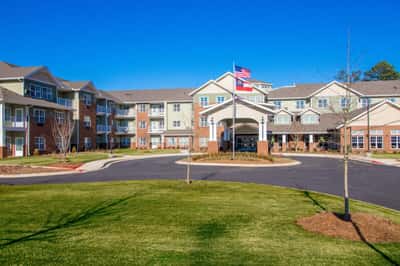
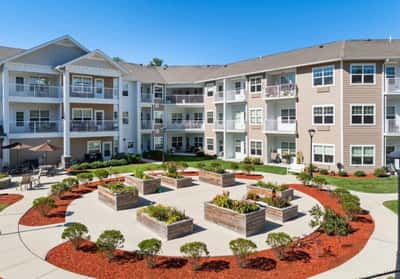
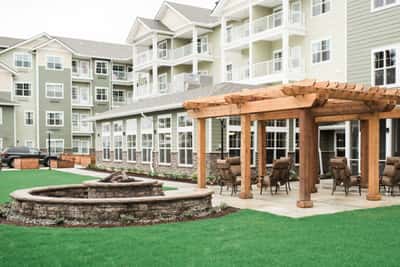
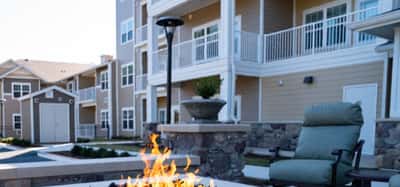
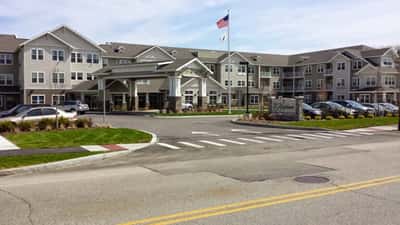
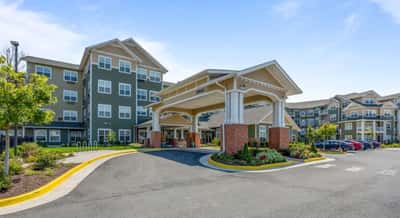
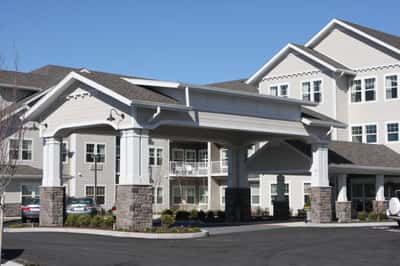
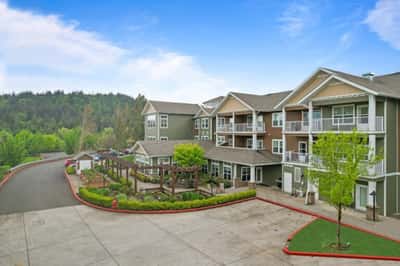
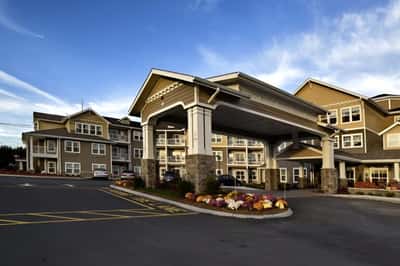
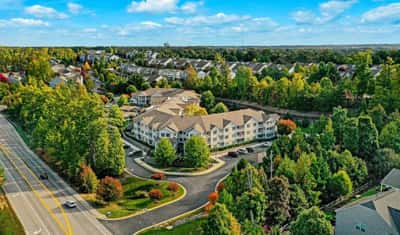
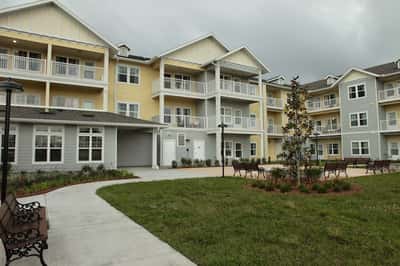
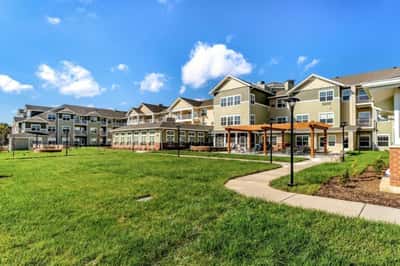
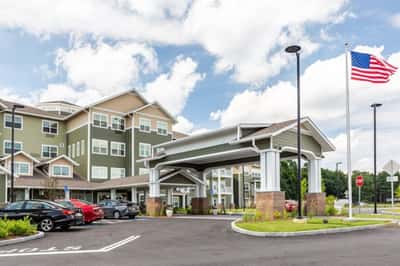
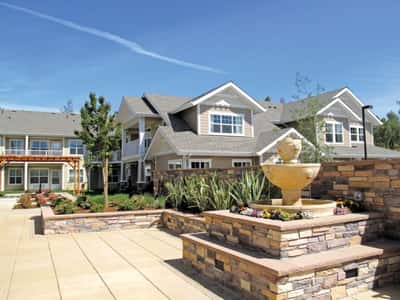
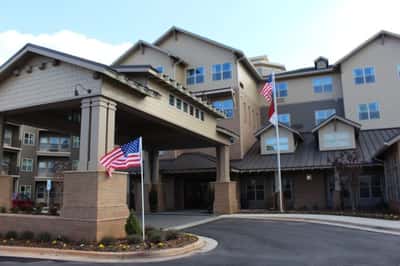
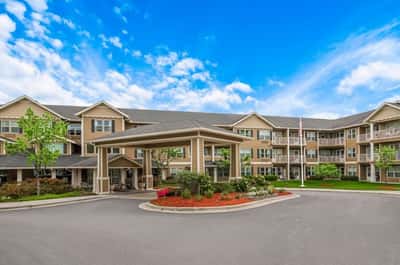
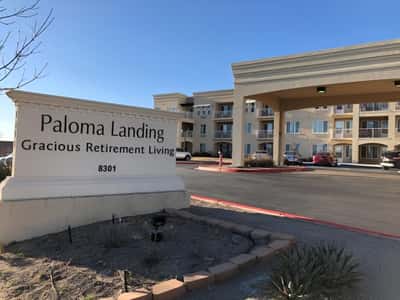
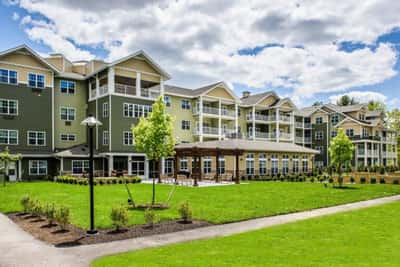
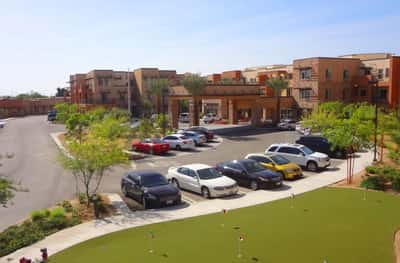
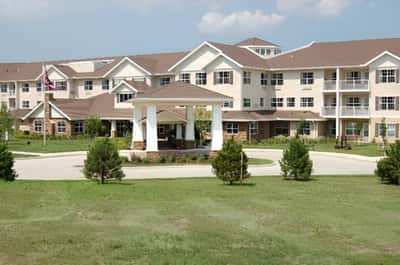
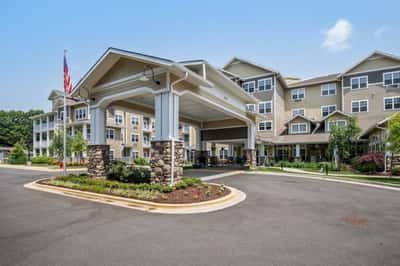
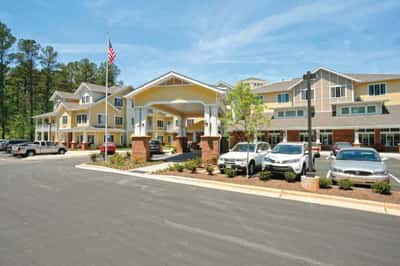
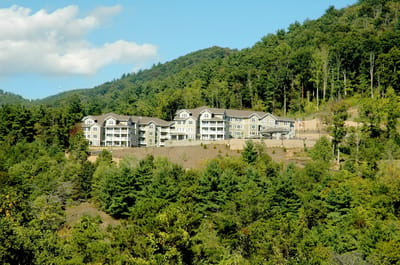
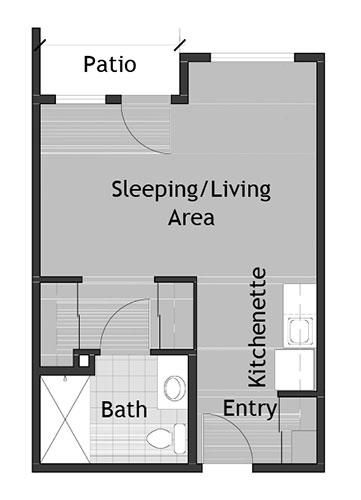
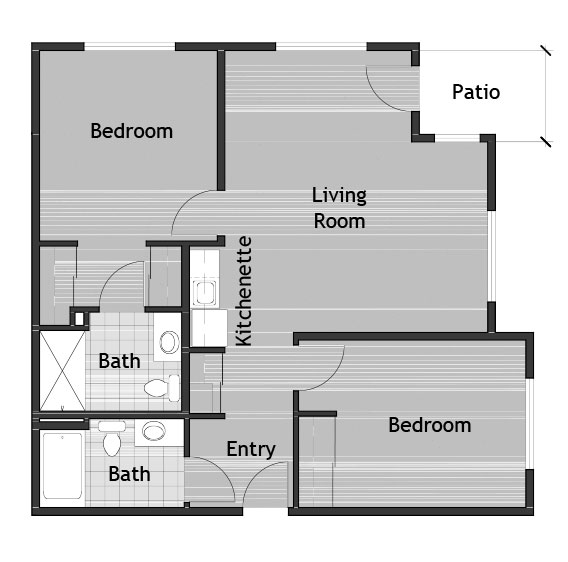
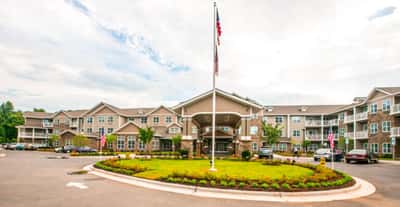
Bella Vista Gracious Retirement Living is an independent living community on Piney Mountain Drive in Asheville, North Carolina. The mid-rise residence has three housing options: studio, one-bedroom, and two-bedroom floor plans, to accommodate varying preferences and household sizes. The Asheville location scores 13 on the Walk Score ladder, signifying a car-dependent area where most errands and daily activities demand a vehicle. The surrounding setting reflects the car-reliant suburban nature of the neighborhood.
For families thinking of independent living in Asheville, Bella Vista Gracious Retirement Living offers a residential option in the area. More details about daily activities, dining, amenities, and community life would help finalize your decision amid an in-person tour.
Walk Score: 13 / 100 Rank #432 / 572Walk Score — State benchmarkedThis home is ranked 432nd out of 572 homes in North Carolina. Shows how walkable this facility's neighborhood is compared to the average Walk Score across North Carolina facilities. Higher scores benefit residents, families, and staff.Rankings are based only on facilities in North Carolina that report data for that category. Facilities without available data are excluded from the ranking.Click the rank badge to see the full State ranking.Click here to see the full State ranking.
Car-dependent. Most errands require a car, with limited nearby walkable options.
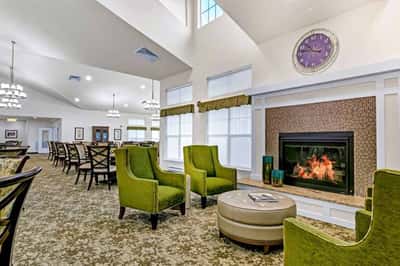
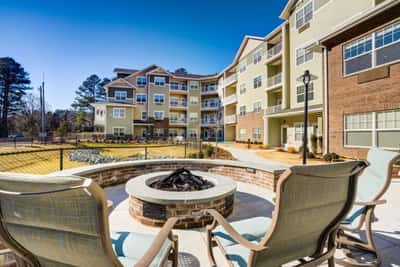
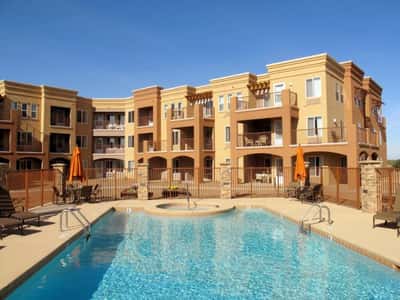
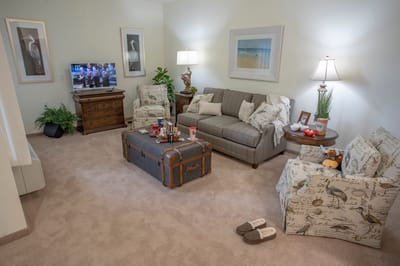
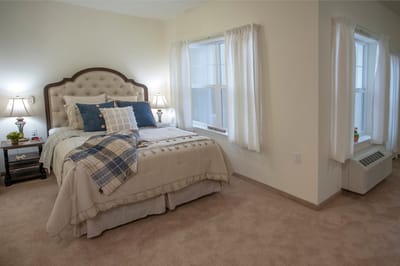
What does this home offer?
Pets Allowed
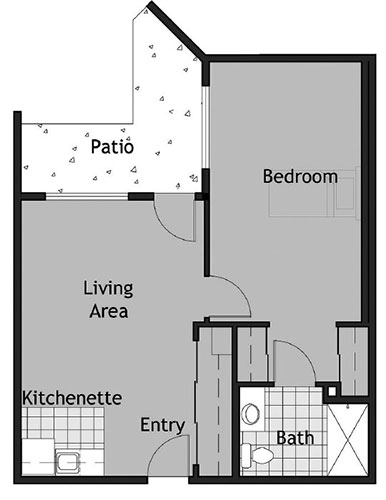
Room Sizes: 365-604 / 549-830 / 904-1147 sq. ft
Housing Options: Studio / 1 Bed / 2 Bed
Building Type: Mid-rise
Transportation Services
Recreational Activities
Housekeeping Services
Exercise Programs
Living Spaces & Floor Plans for Bella Vista Gracious Retirement Living
Mountain View Gardens1
Mountain View Gardens
Mountain View Gardens2
Places of interest near Bella Vista Gracious Retirement Living
![]() 2.0 miles from city center
2.0 miles from city center
![]() Estimated distance in miles from Asheville's city center to Bella Vista Gracious Retirement Living's address, calculated via Google Maps.
Estimated distance in miles from Asheville's city center to Bella Vista Gracious Retirement Living's address, calculated via Google Maps.
Calculate Travel Distance to Bella Vista Gracious Retirement Living
Add your location
Financial Assistance for
Independent Living in North Carolina
Bella Vista Gracious Retirement Living is located in Asheville, North Carolina.
Here are the financial assistance programs available to residents in North Carolina.
More homes from the same operator
Operated by
Hawthorn Senior Living
Osprey Heights Gracious Retirement Living
2808 Lithia Pinecrest Rd, Valrico, FL 33596, United States
Summerville Estates Gracious Retirement Living
704 Central Ave, Summerville, SC 29483, United States
Providence Meadows Gracious Retirement Living
4123 Kuykendall Rd, Charlotte, NC 28270, United States
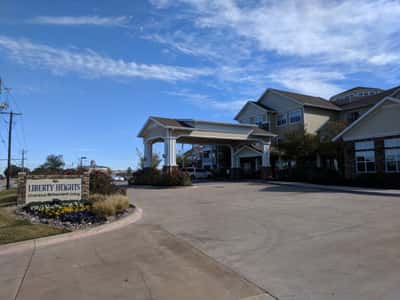
Liberty Heights Gracious Retirement Living
963 W Yellow Jacket Ln, Rockwall, TX 75087, United States
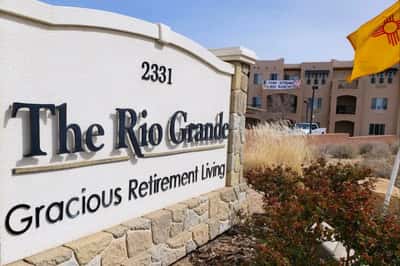
The Rio Grande Gracious Retirement Living
2331 Westside Blvd SE, Rio Rancho, NM 87124, United States
Frequently Asked Questions about Bella Vista Gracious Retirement Living
Is Bella Vista Gracious Retirement Living in a walkable area?
Bella Vista Gracious Retirement Living has a walk score of 13. Car-dependent. Most errands require a car, with limited nearby walkable options.
Are there photos of Bella Vista Gracious Retirement Living?
Yes — there are 4 photos of Bella Vista Gracious Retirement Living in the photo gallery on this page.
What is the address of Bella Vista Gracious Retirement Living?
Bella Vista Gracious Retirement Living is located at 55 Piney Mountain Dr, Asheville, NC 28805.
What is the phone number of Bella Vista Gracious Retirement Living?
(828) 255-8255 will put you in contact with the team at Bella Vista Gracious Retirement Living.
Does Bella Vista Gracious Retirement Living provide medical or personal care assistance?
No — Bella Vista Gracious Retirement Living is an independent living community. Residents live on their own in private apartments with access to amenities, dining, and social activities.
Guides for Better Senior Living
Updated on
