Total health inspections
6
Nevada average 5.1
Last Health inspection on Mar 2025

We arrange tours, appointments, and even moving support so you don’t have to
Thank you for your interest!
Our team will be in touch shortly to help with next steps.

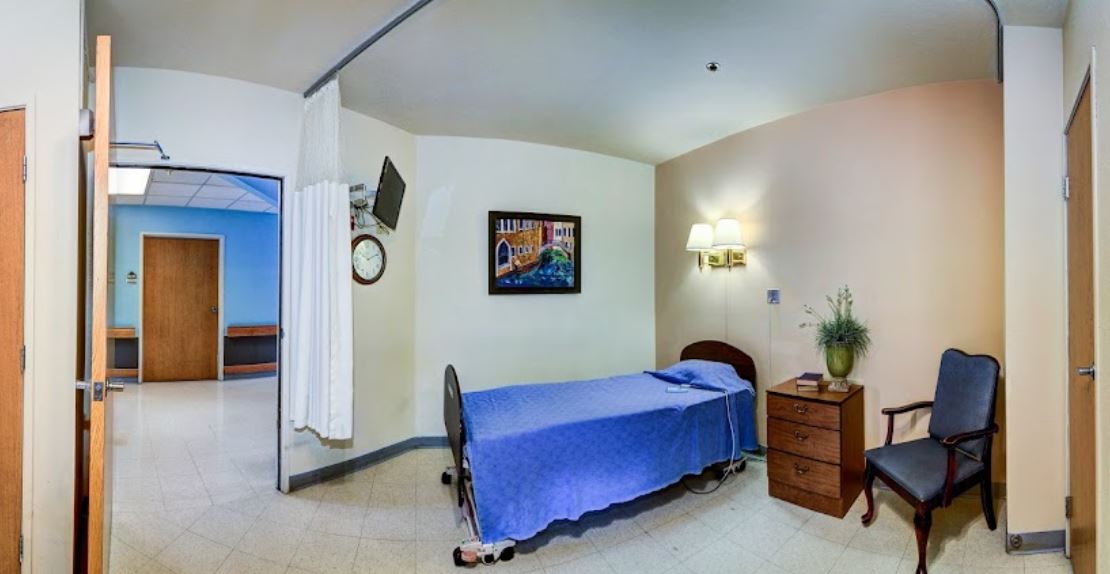
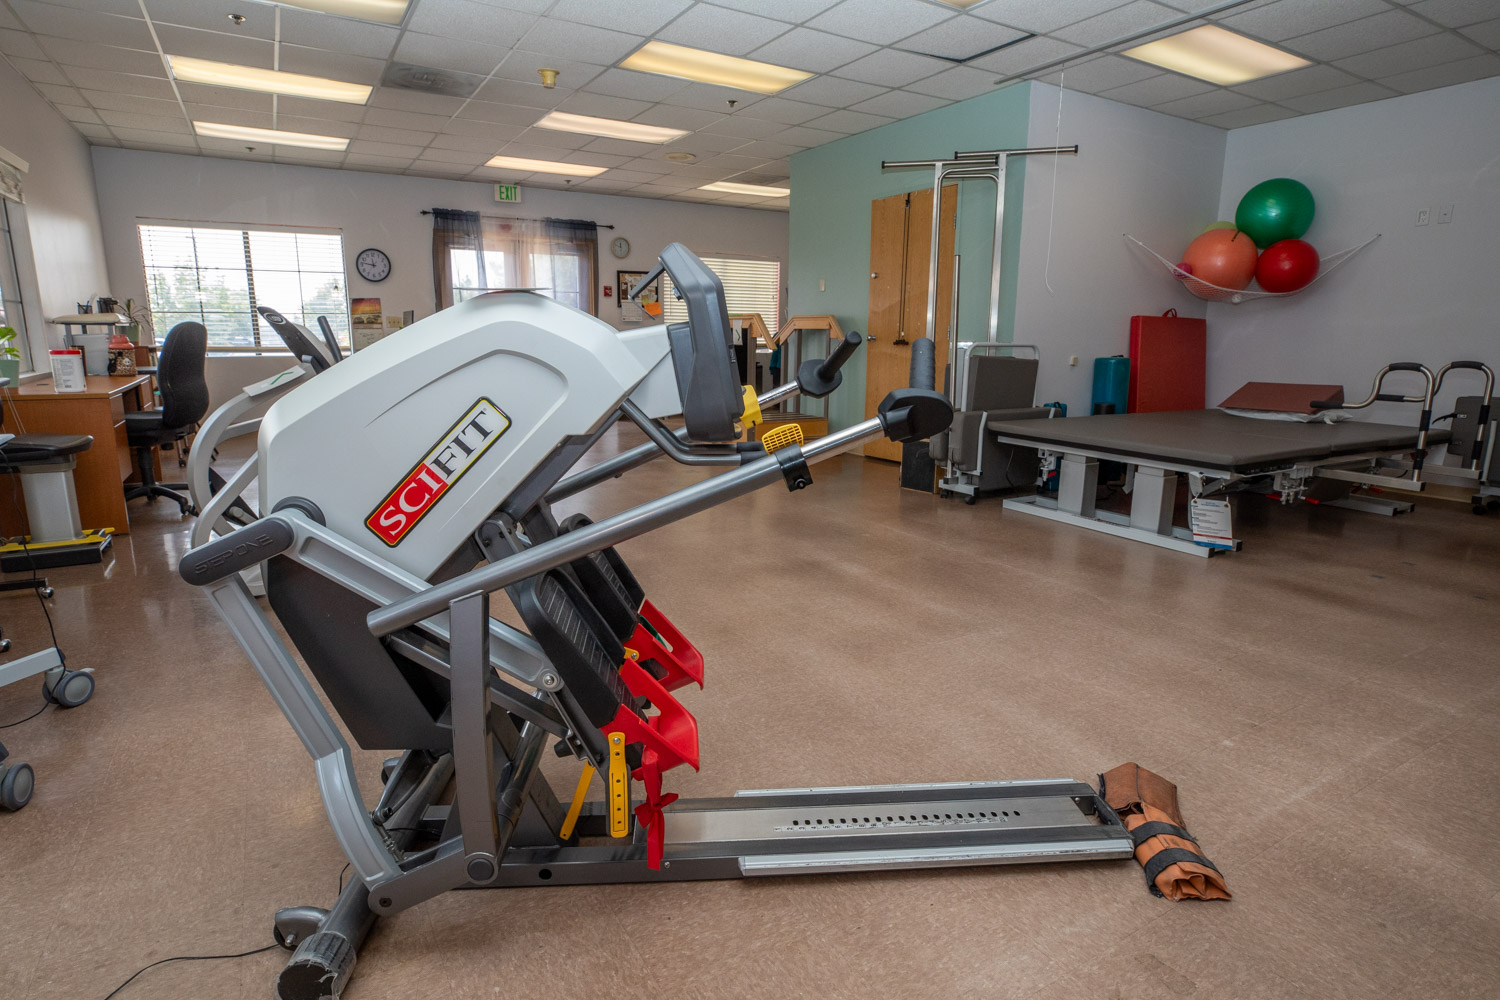
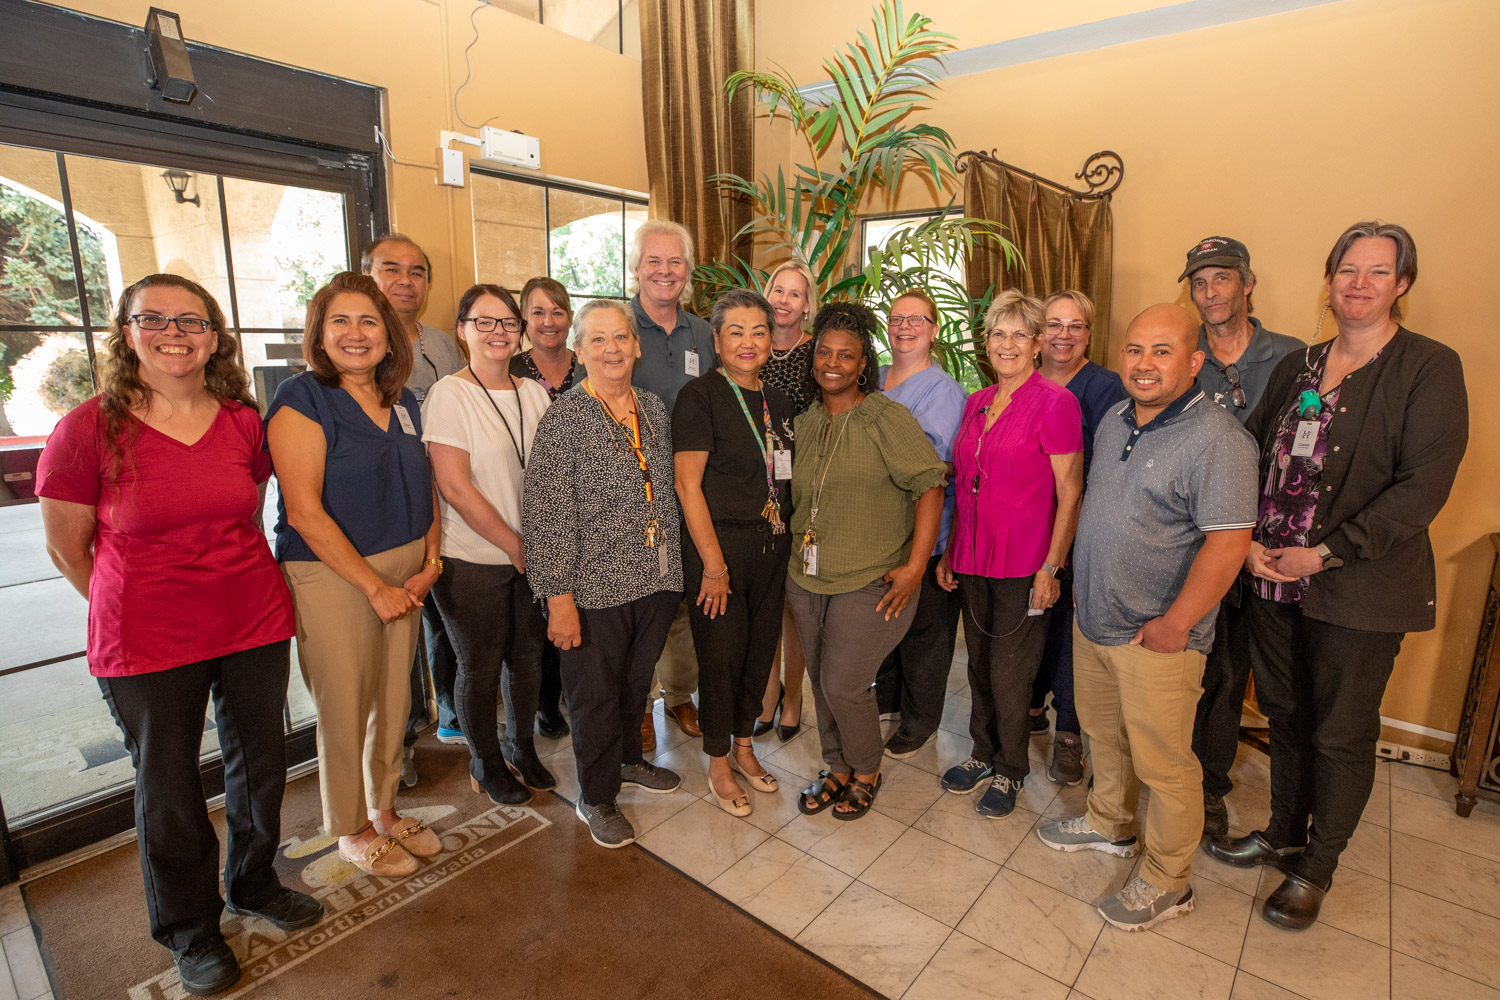
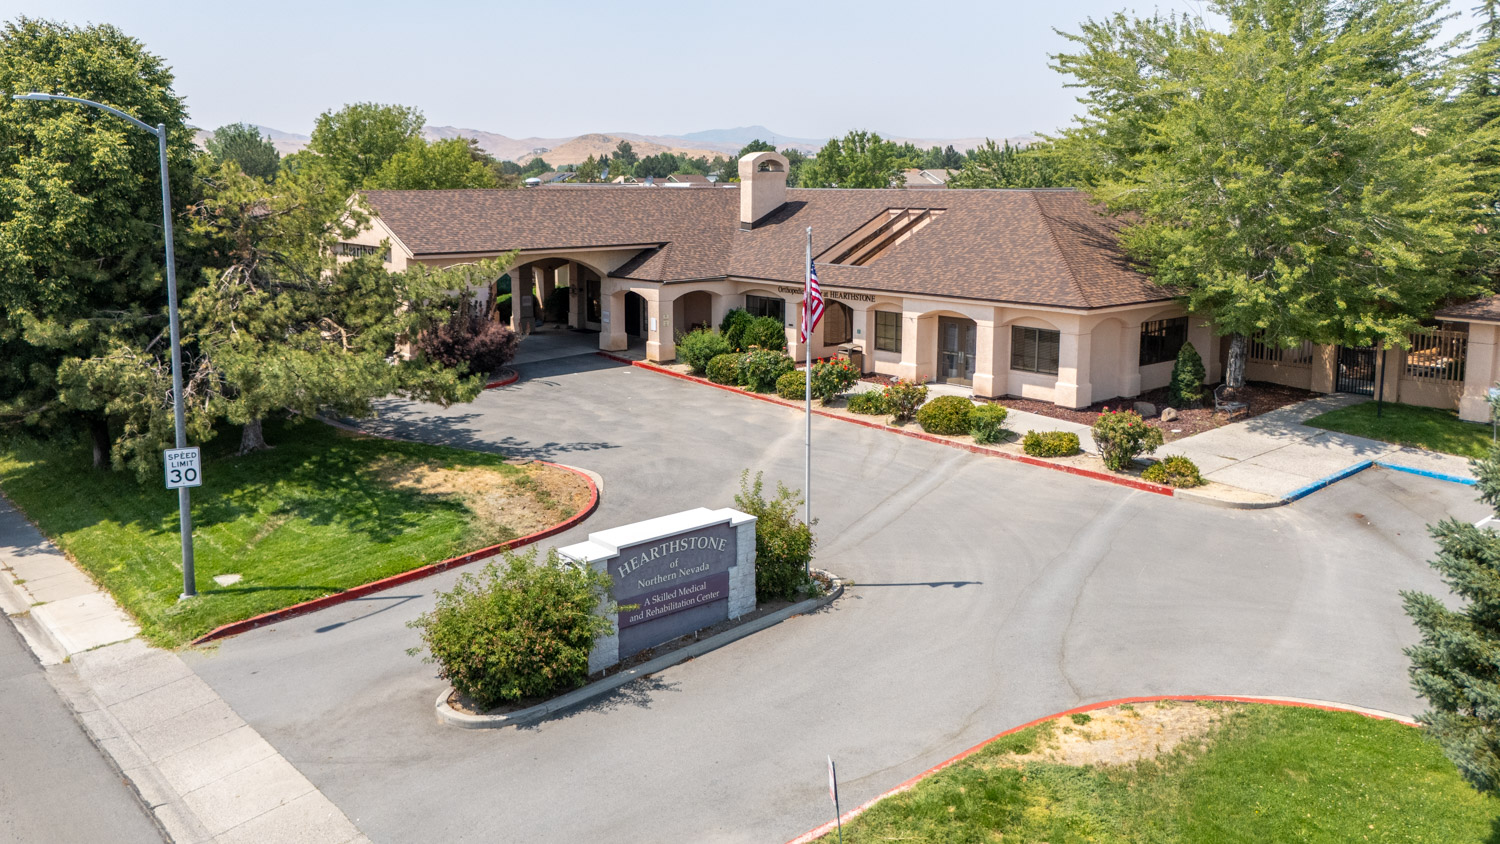


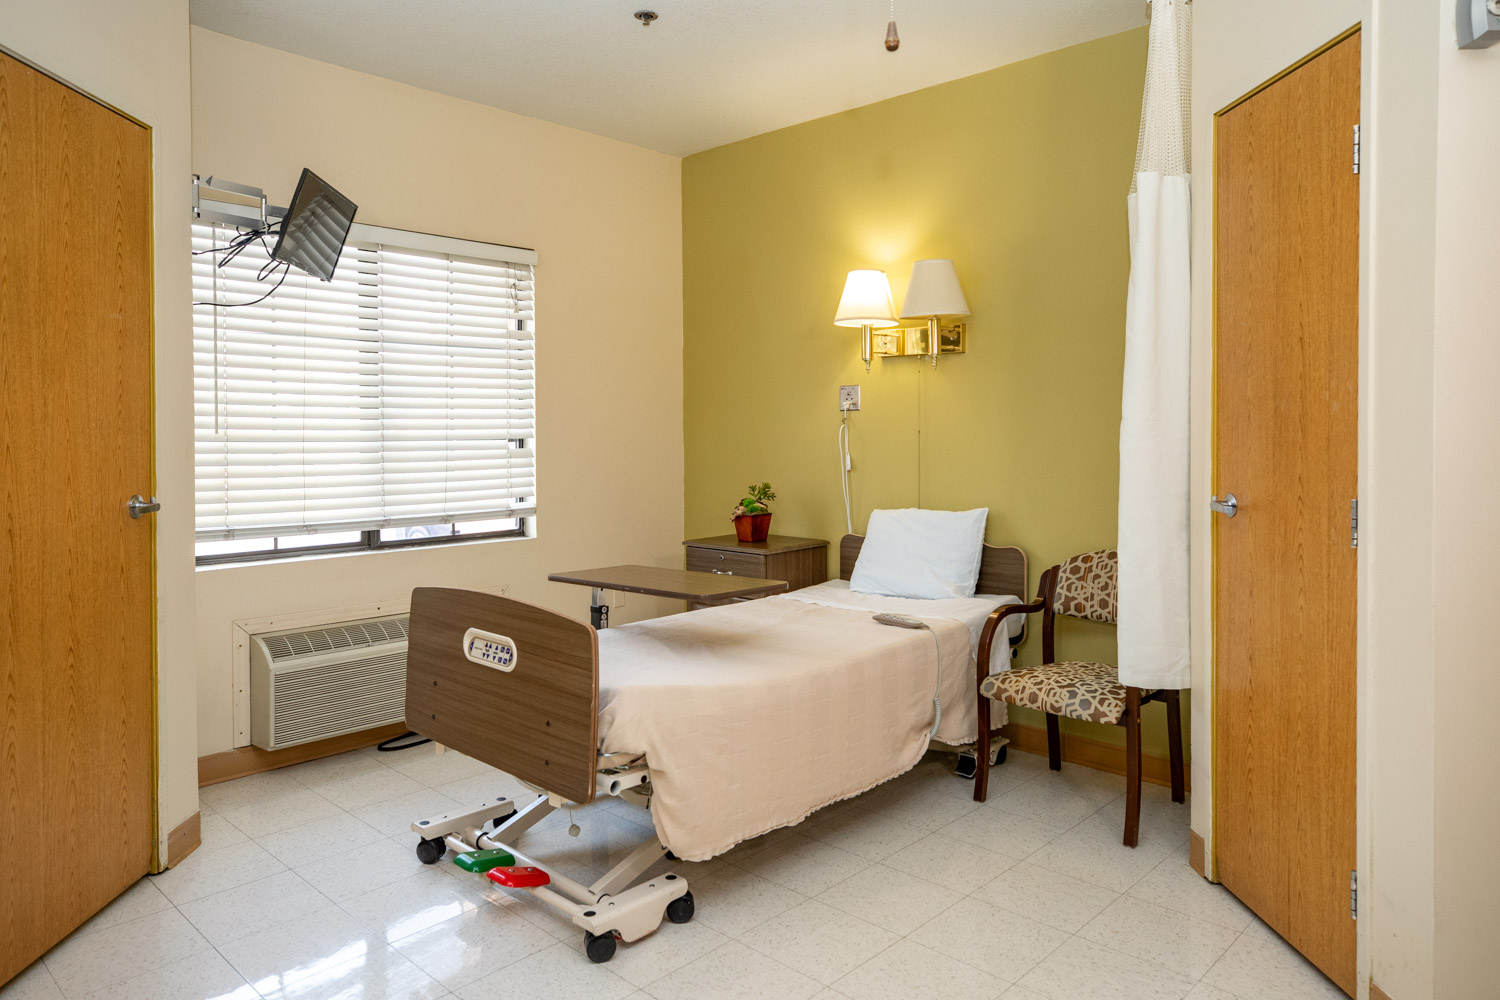

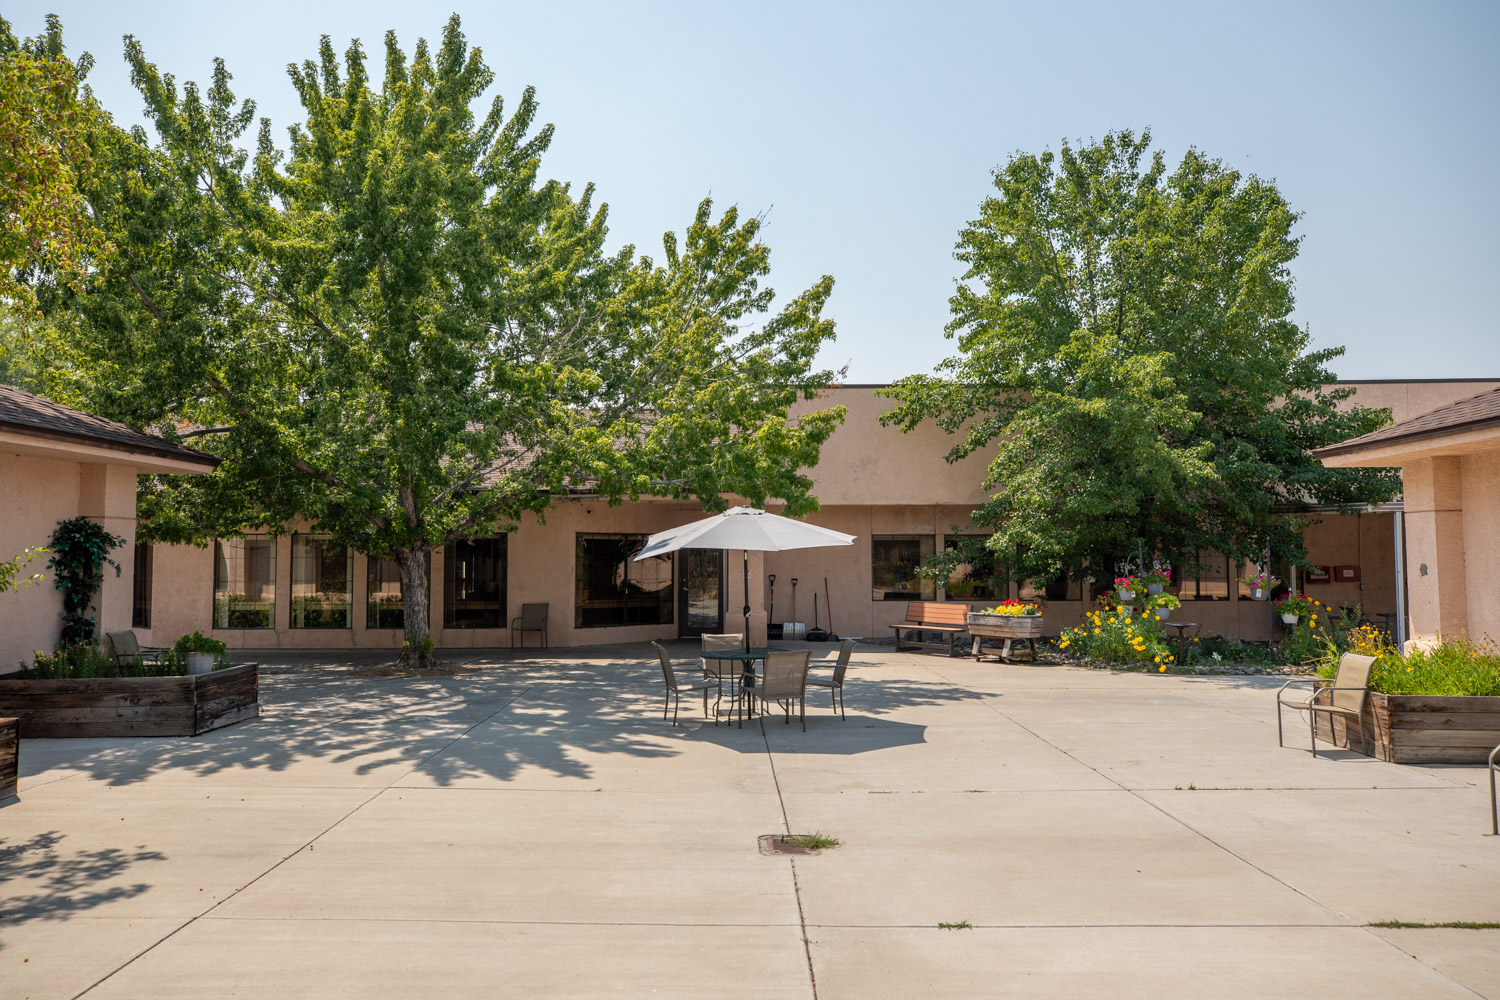
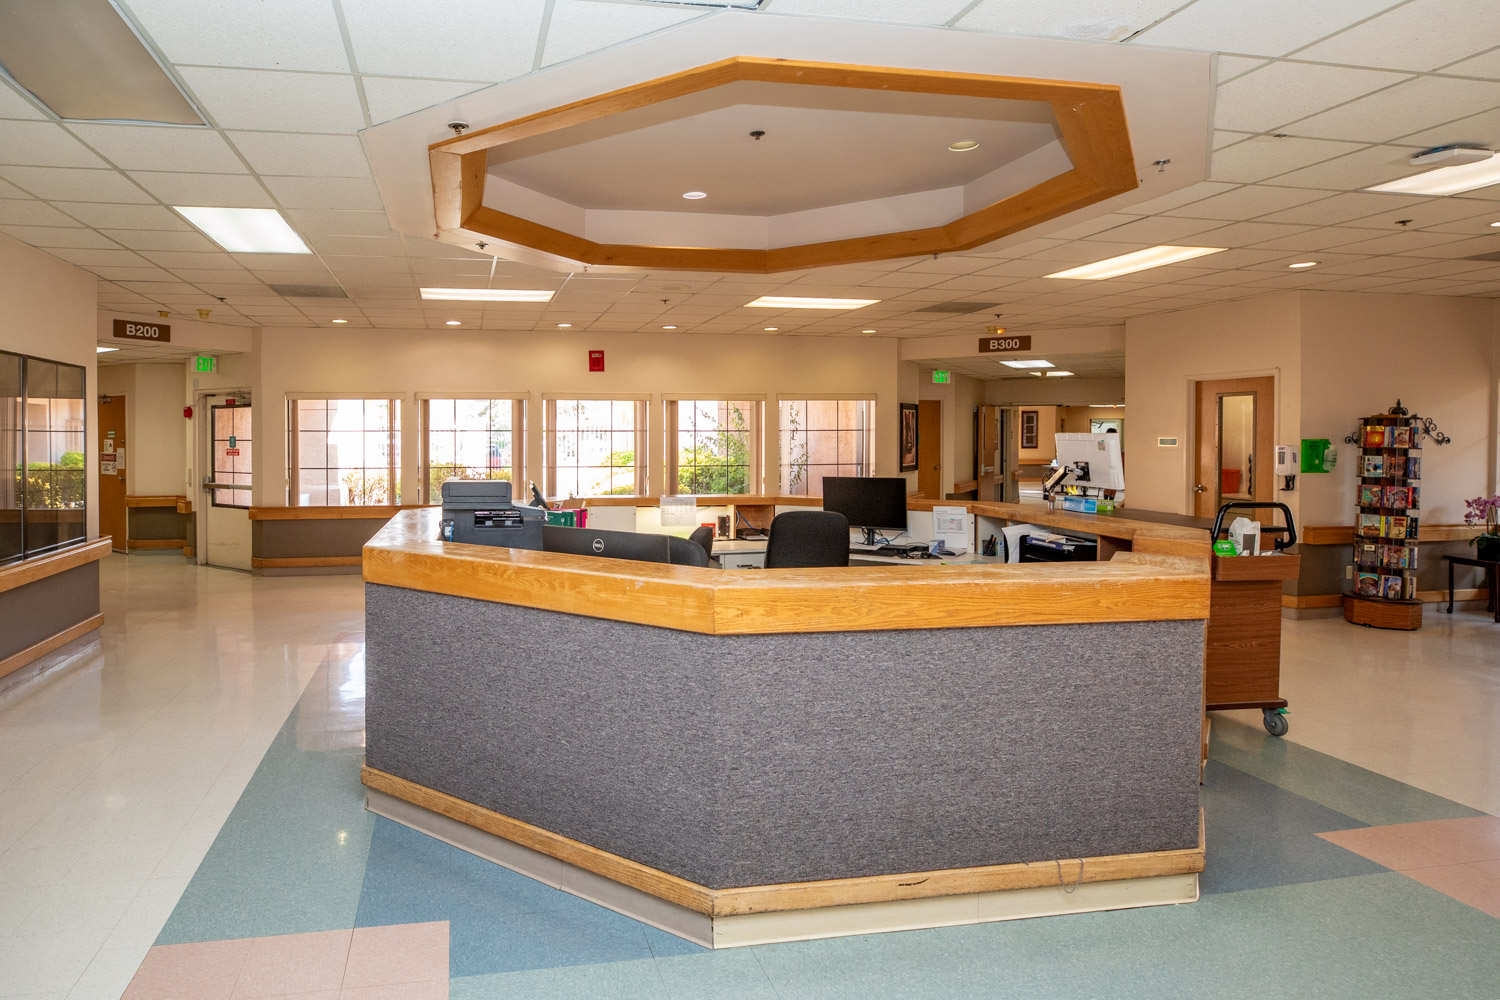
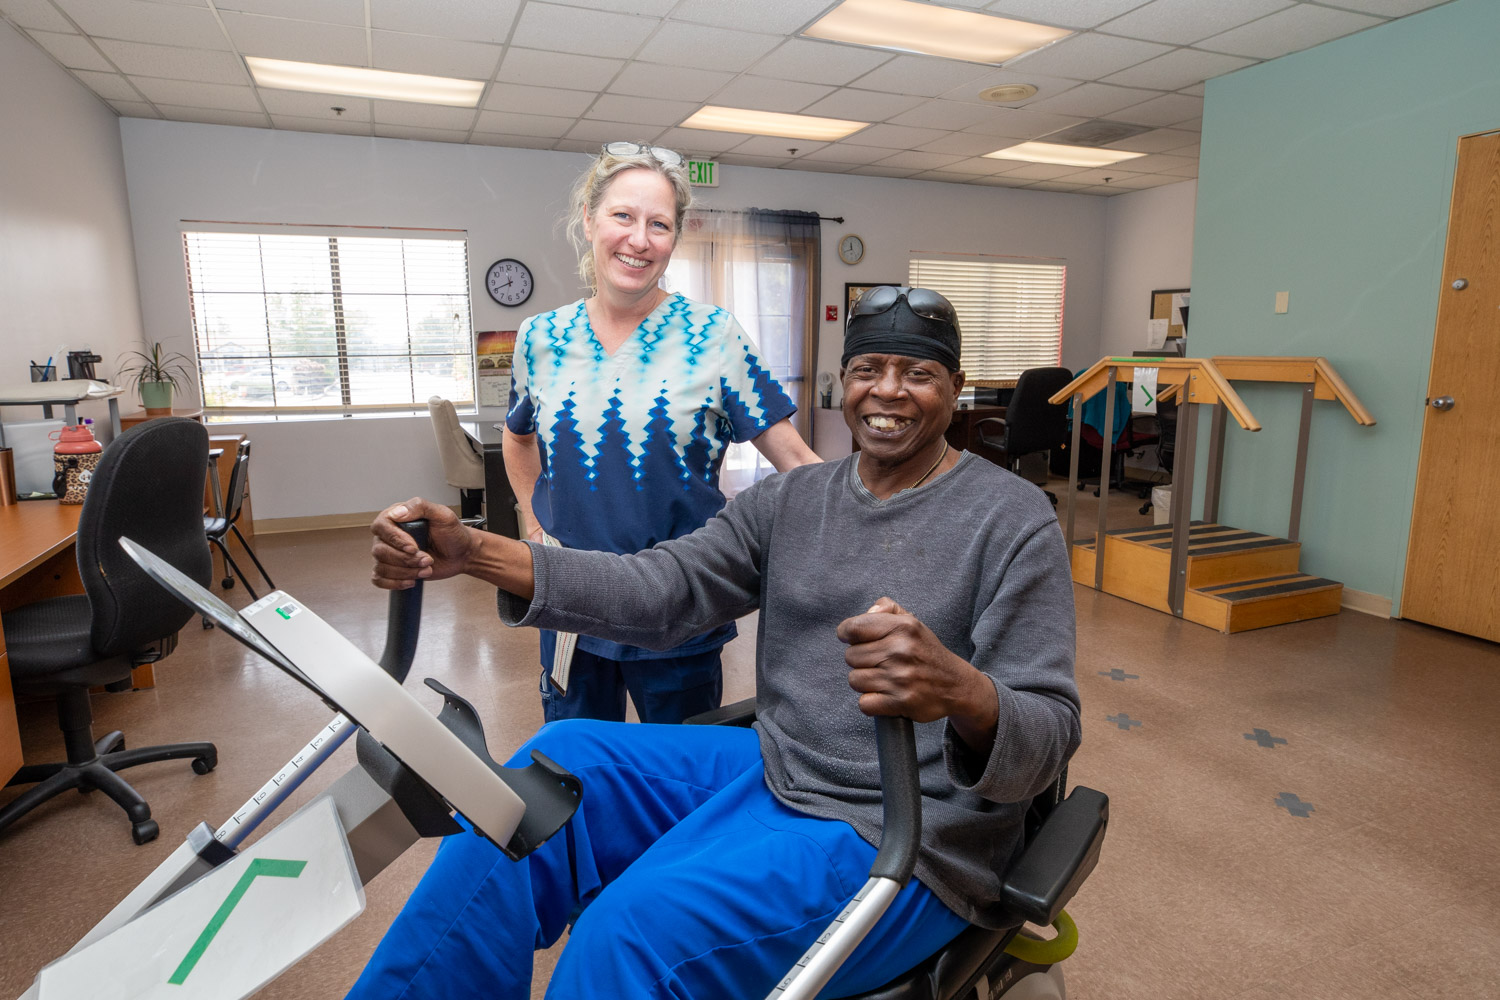
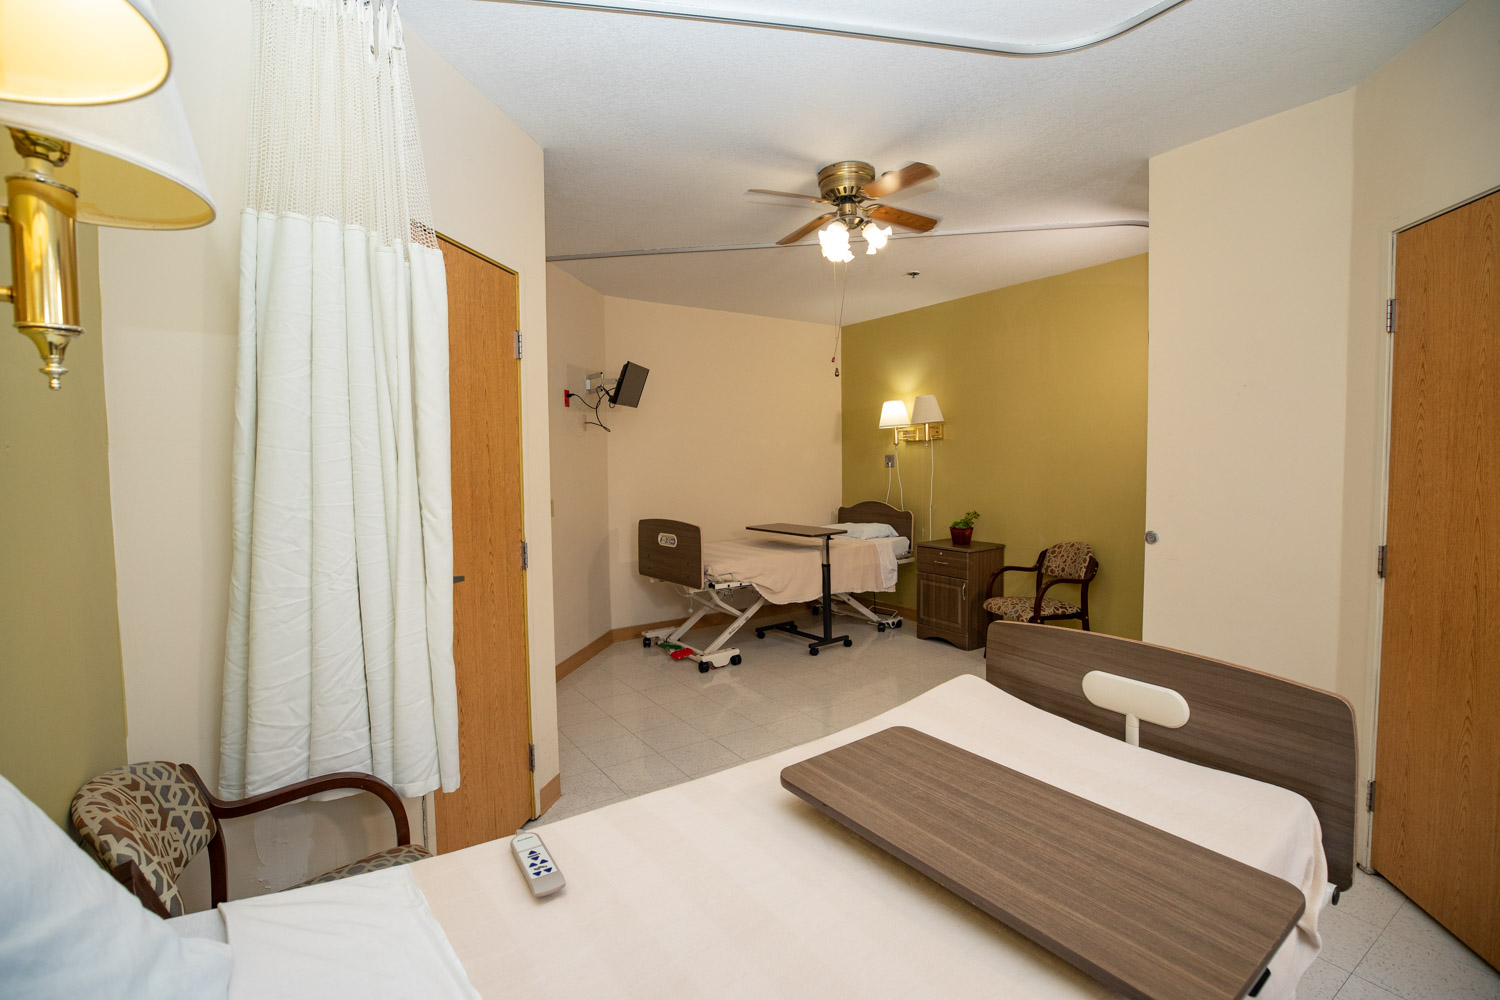
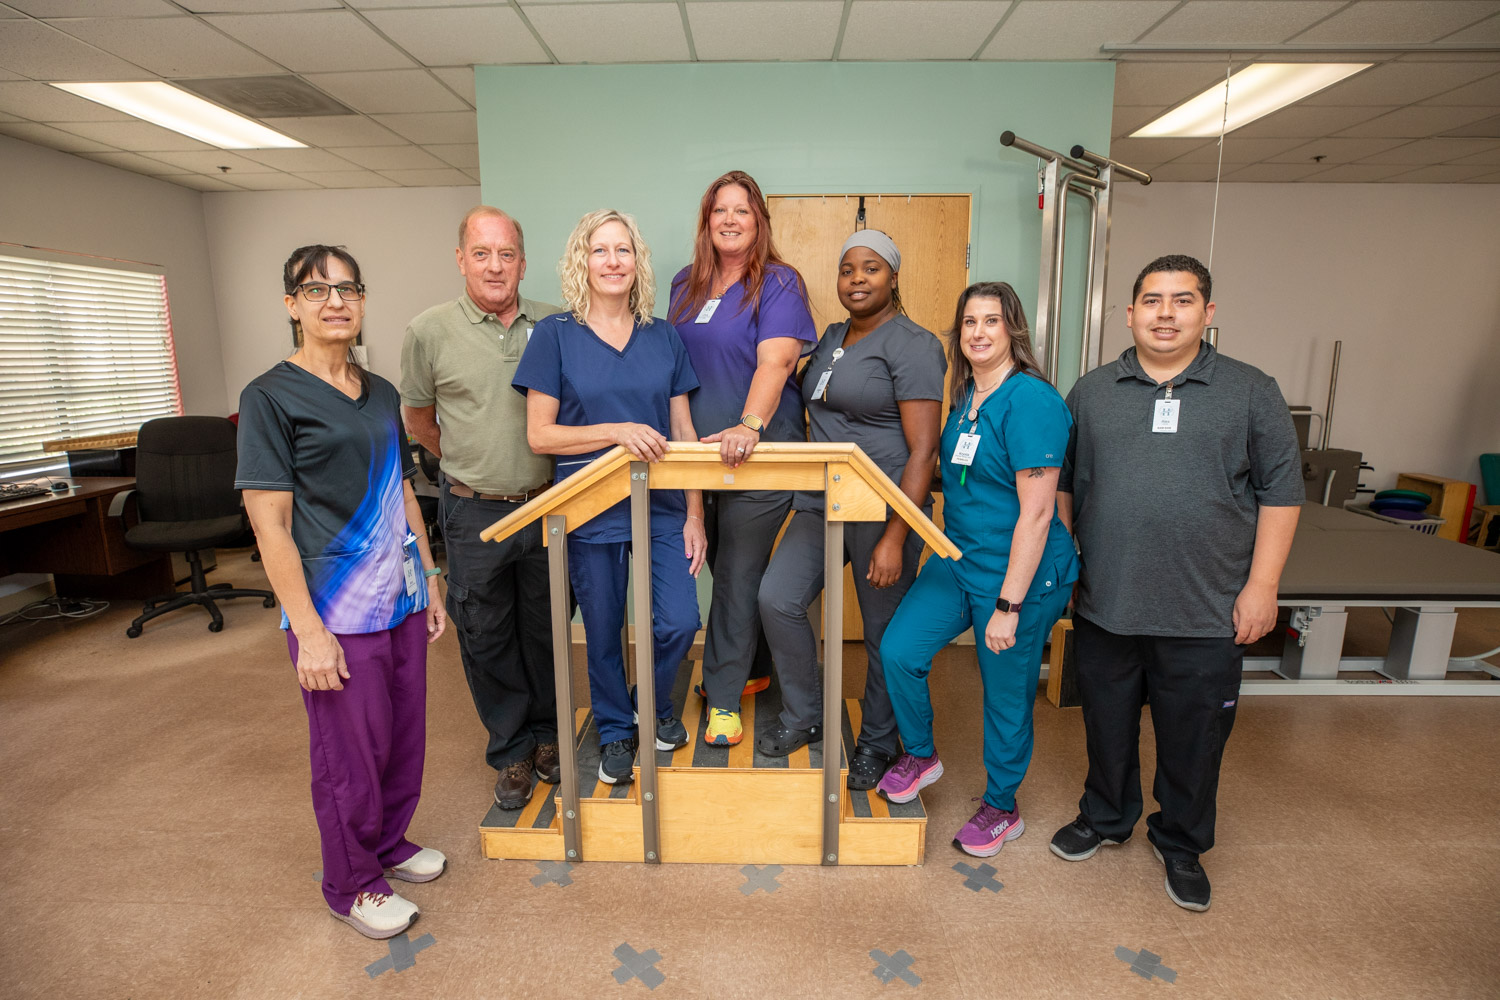

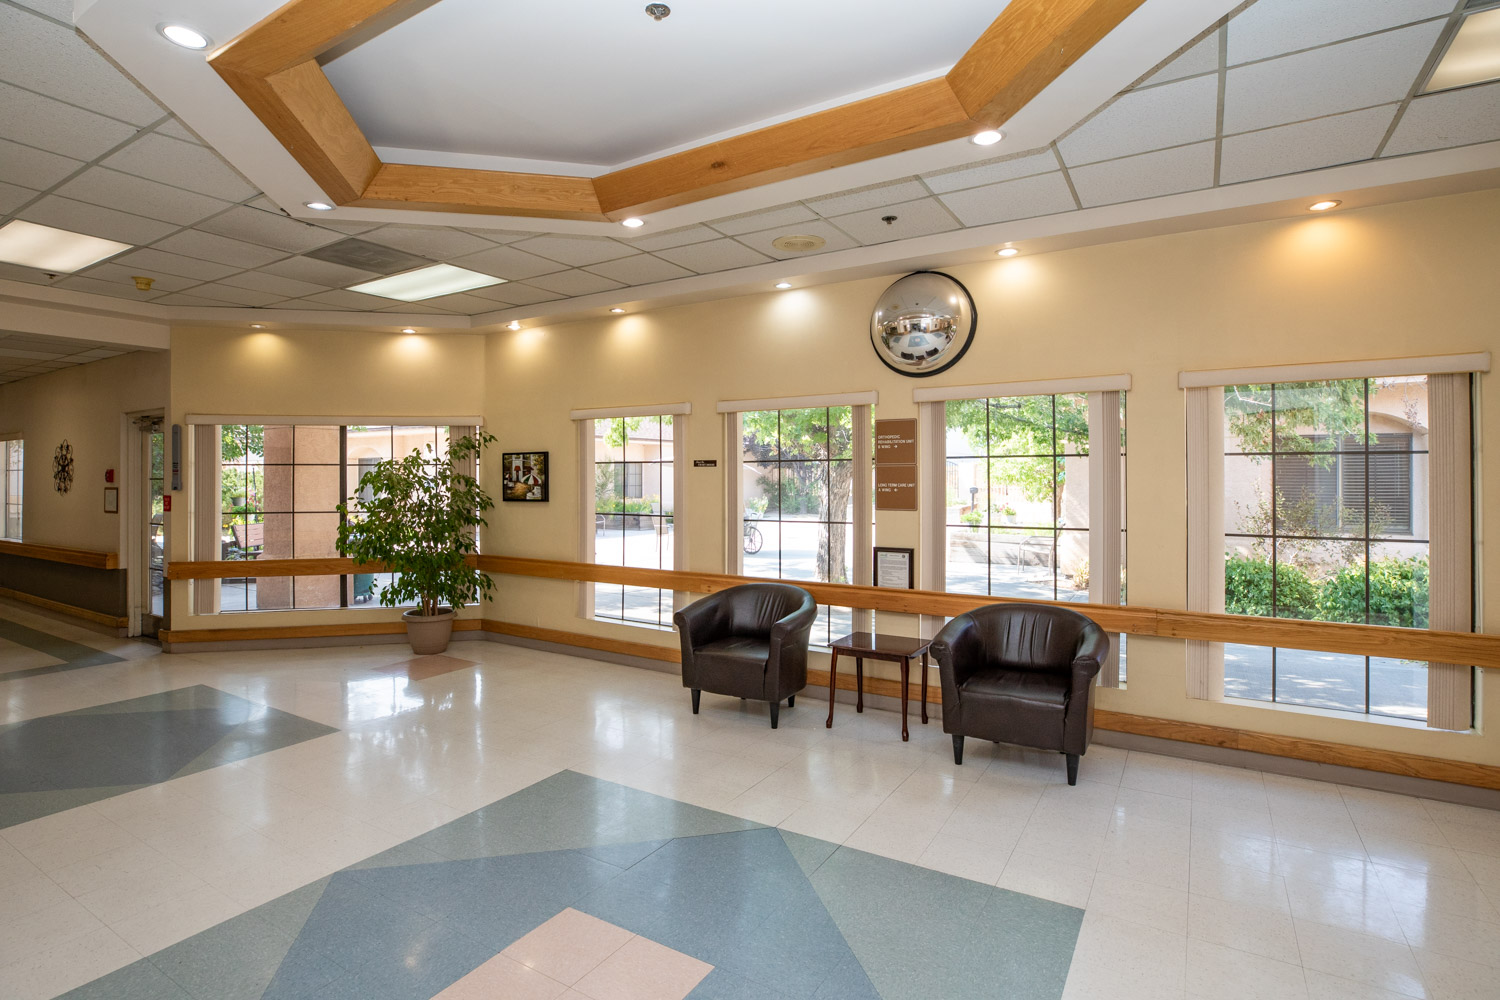
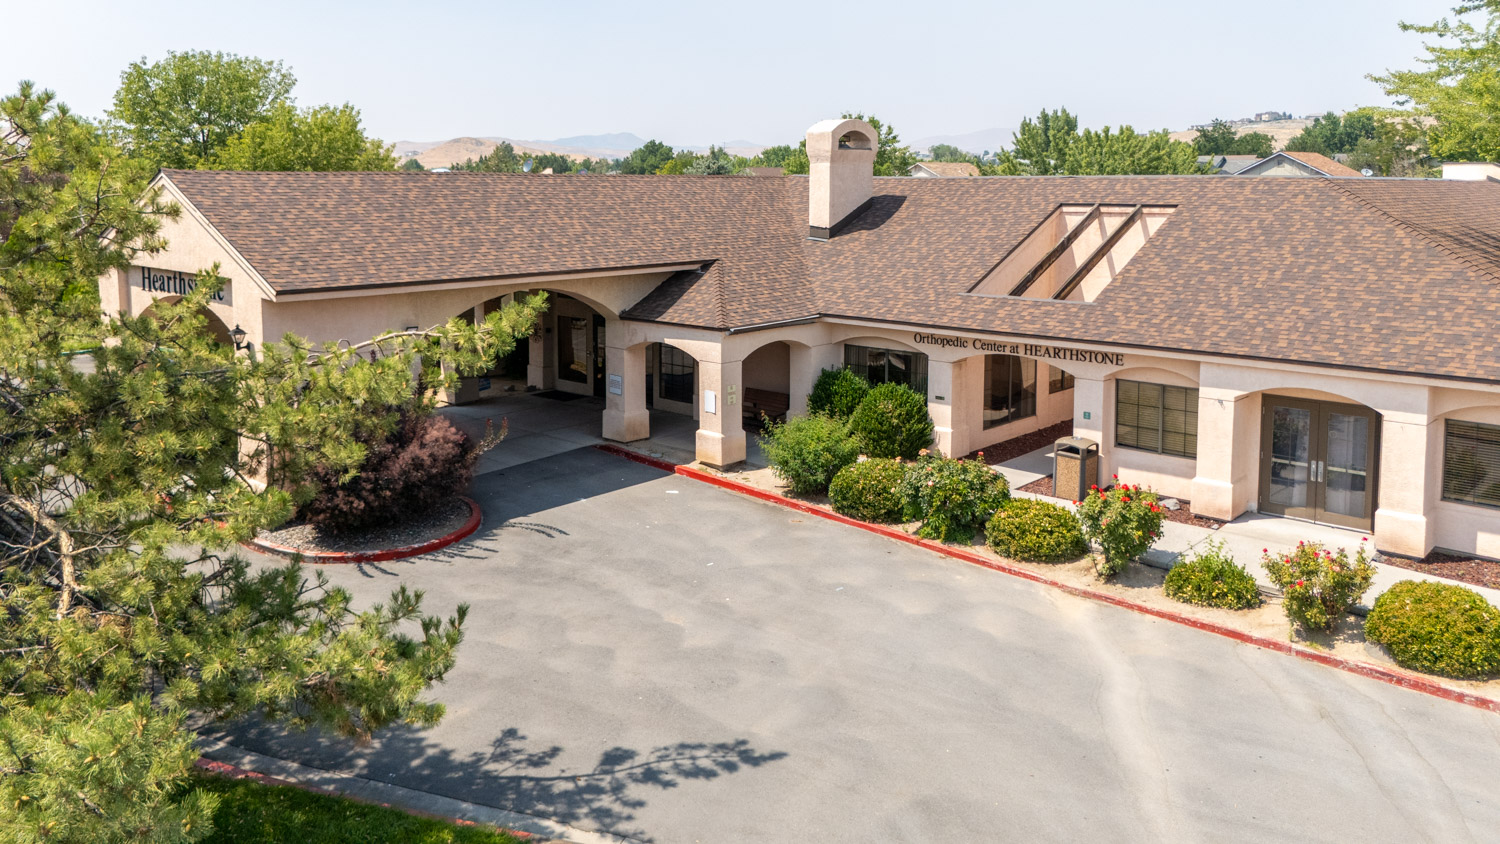
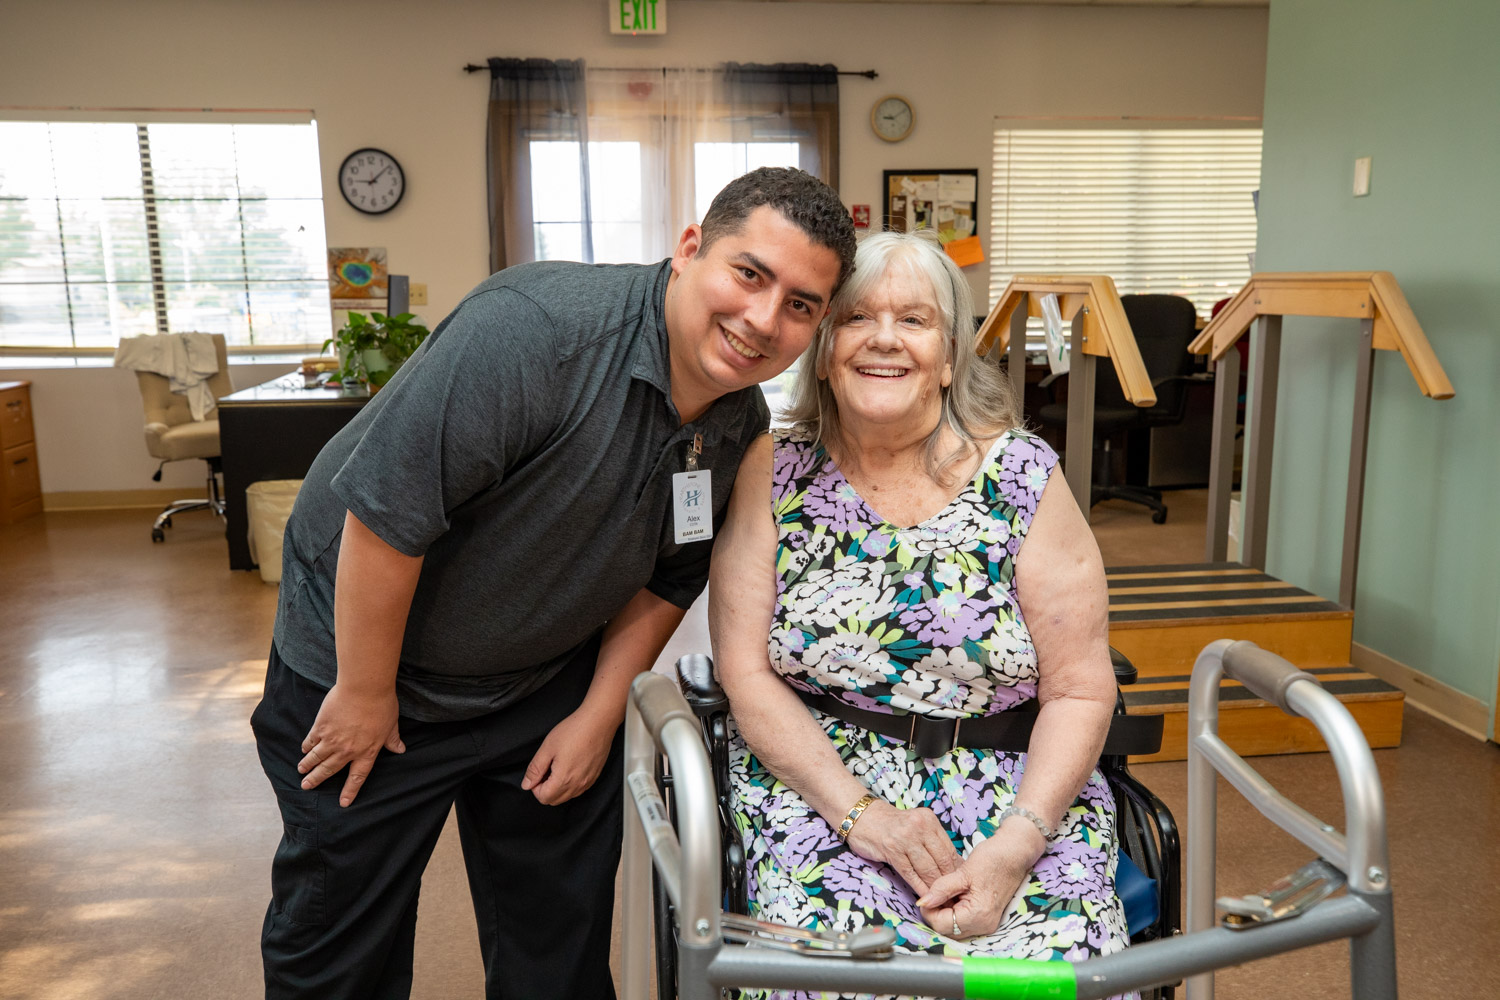

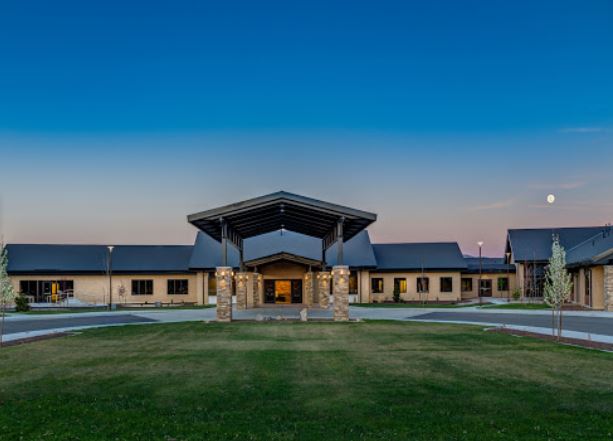
Standing tall among senior living communities in Sparks, Nevada, Hearthstone of Northern Nevada is renowned for exceptional nursing home care. This community is committed to providing superior care to its residents, particularly when they need it the most. Striking an effective balance between clinical outcomes and social well-being, Hearthstone operates under the principle of prioritizing resident needs, all in a homelike atmosphere.
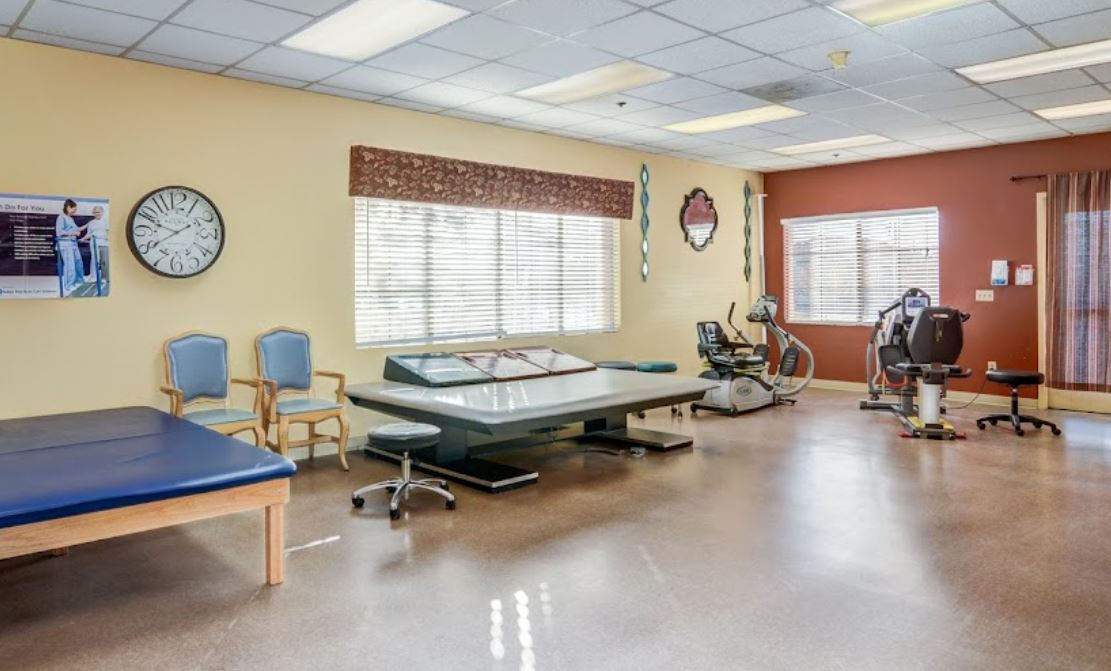
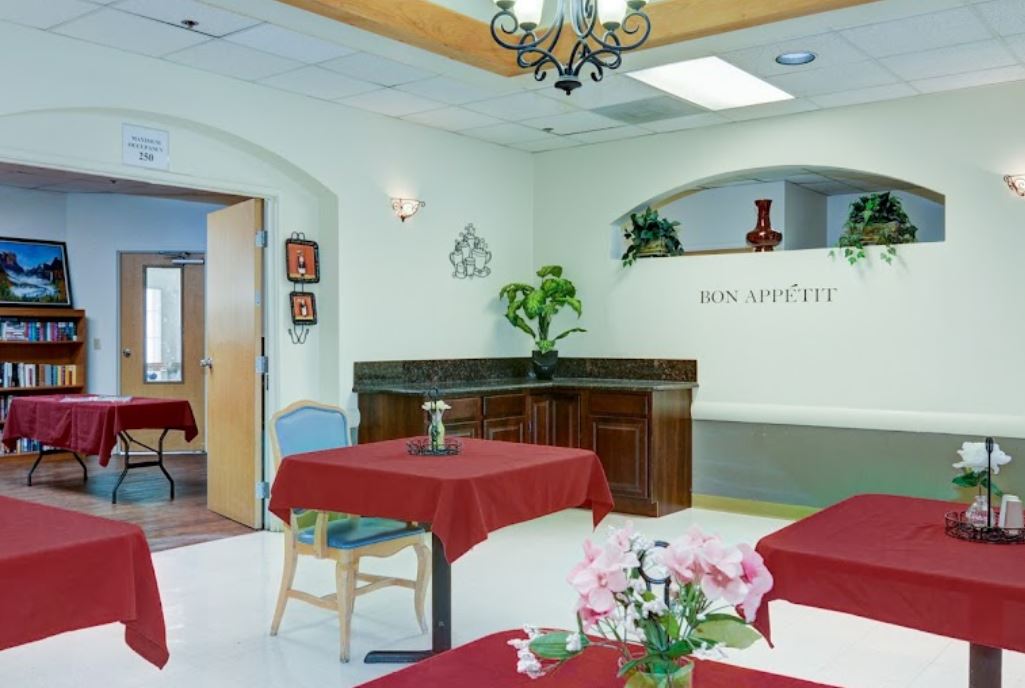
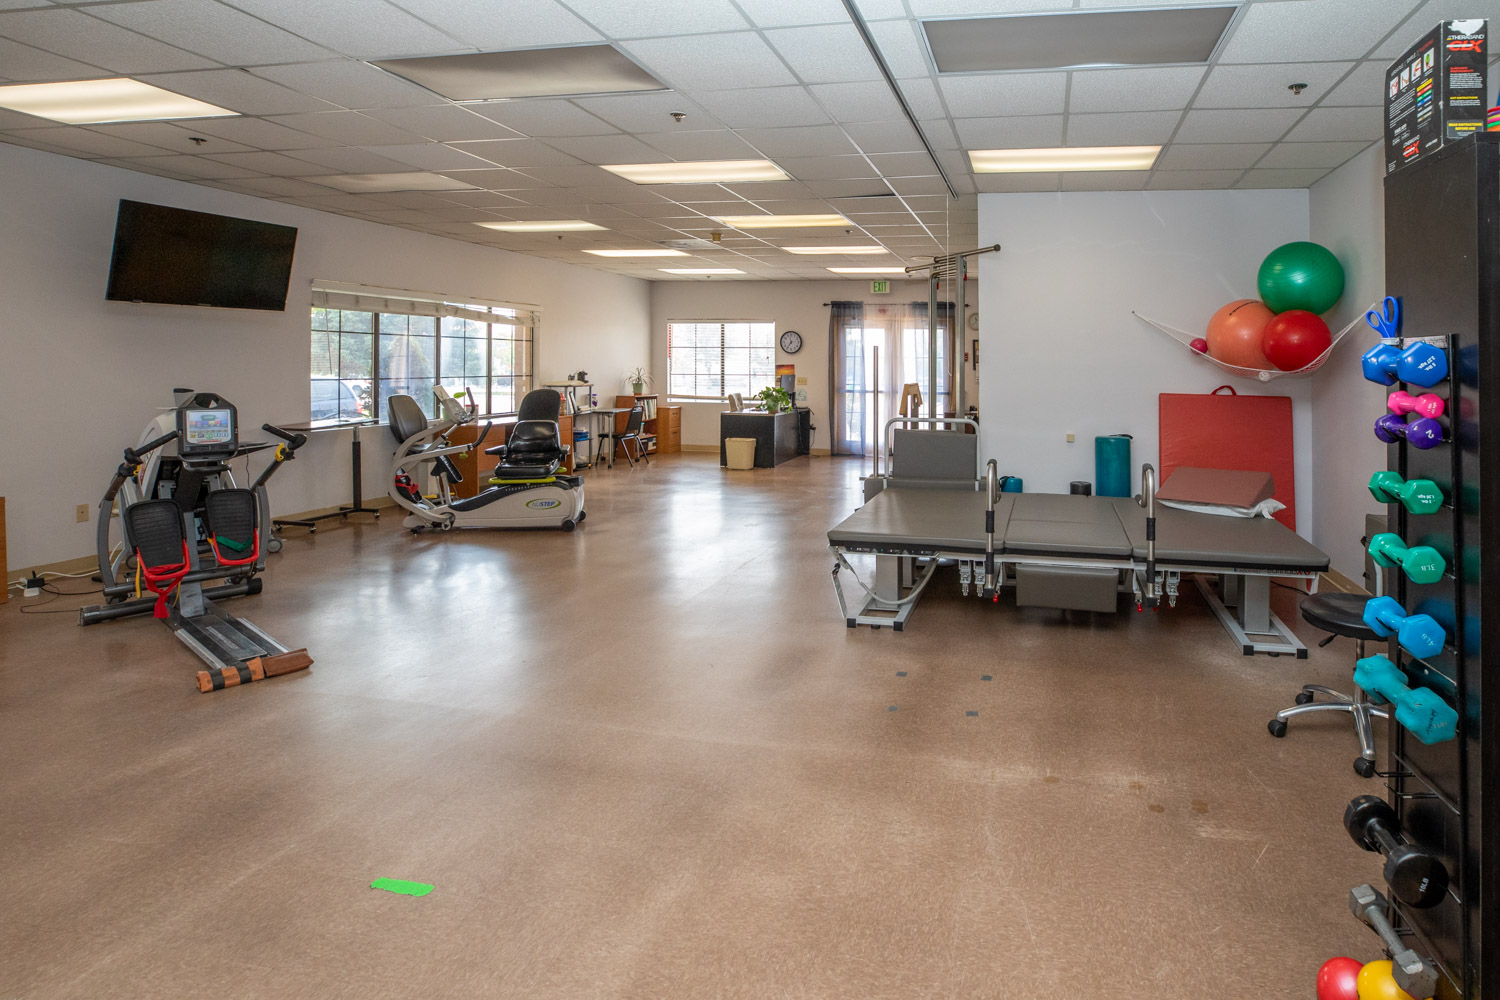
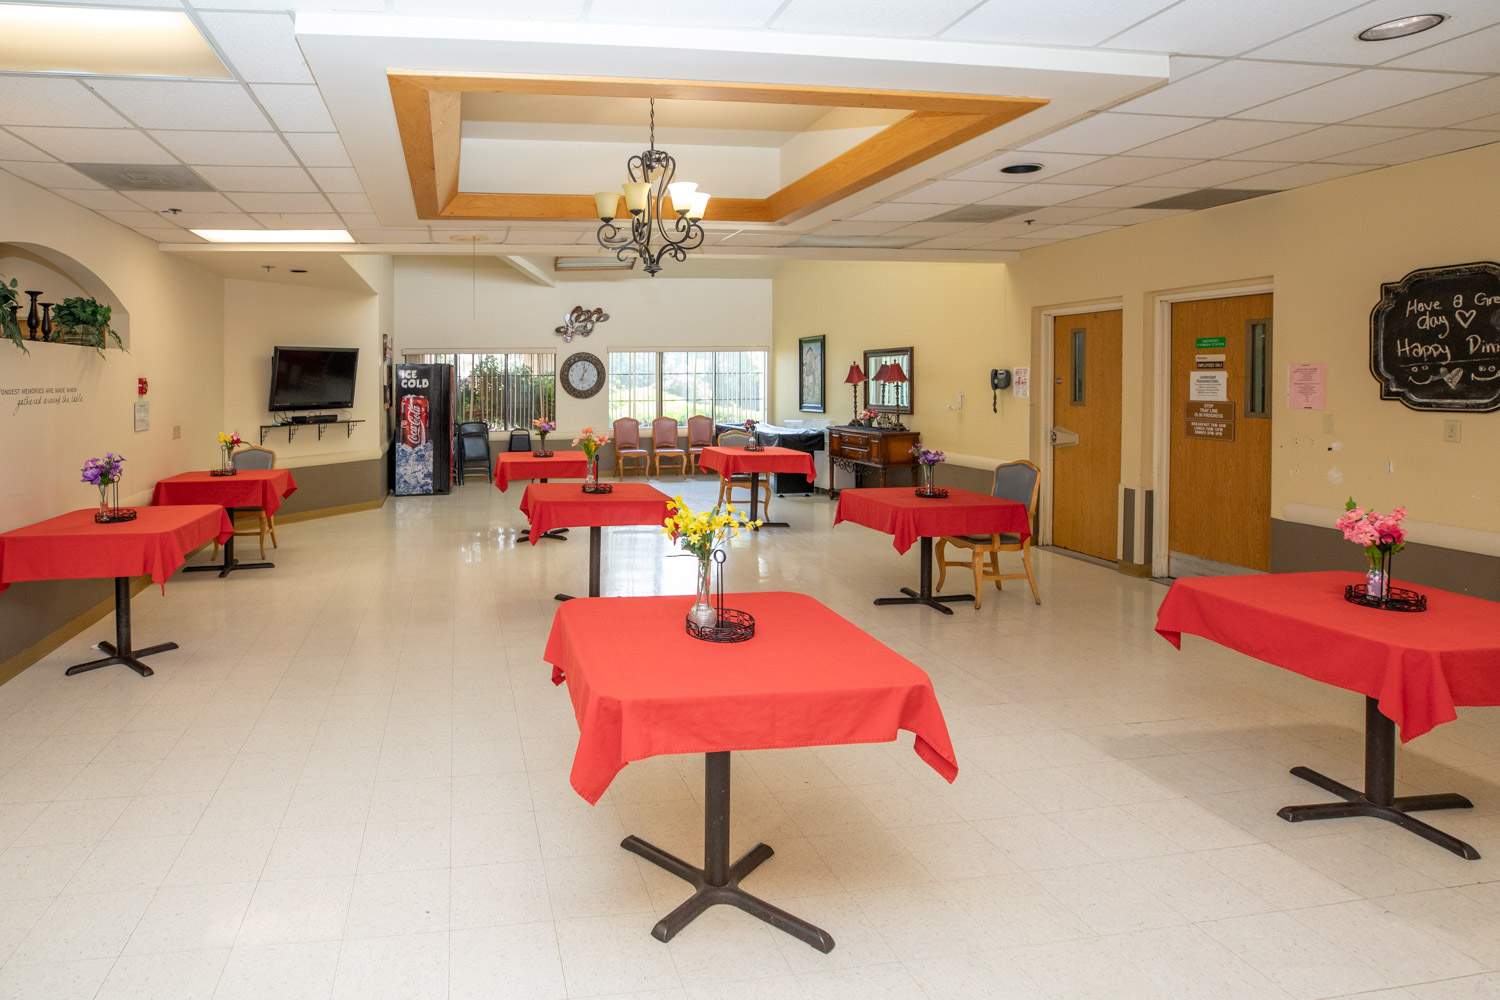
Hearthstone extends an array of essential services, from certified wound care and skilled nursing care to short-term rehabilitation, long-term care, and varying levels of hospice-respite support, demonstrating an effective and inclusive approach to nursing home care. The community also offers cutting-edge nutritional and culinary support, ensuring residents’ wellbeing extends beyond just medical needs. Engaging with residents at their time of need, Hearthstone of Northern Nevada personifies a commitment to care and compassion.
Offers a balance of services and community atmosphere.
Occupancy is moderate, suggesting balanced demand.
Residents typically stay for brief periods, with frequent admissions and discharges throughout the year.
39% of new residents, usually for short-term rehab.
60% of new residents, often for short stays.
1% of new residents, often for long-term daily care.
Nevada average 5.1
Last Health inspection on Mar 2025
Nevada average 36.2
Nevada average 7.08
Health citations are formal notices following inspections when they fail to comply with safety and care standards.
56 of 72 citations resulted from standard inspections; 14 of 72 resulted from complaint investigations; and 2 of 72 came from combined inspections (standard and complaint).
Nevada average: 0.1
Nevada average: 0.5
Data sourced from CMS Health Deficiencies reports. Citation severity codes range from A (least serious) to L (most serious). Immediate Jeopardy (J-L) citations indicate situations where the facility's noncompliance has placed residents at risk of death or serious harm.
Nursing Home Licensed facility providing 24/7 skilled nursing care for residents with complex, ongoing medical needs. Staffed by RNs, LPNs, and CNAs. Inspected and star-rated annually by CMS. Accepts Medicare (short-term rehab) and Medicaid (long-term care).
Assisted Living A licensed, long-term care setting for seniors or individuals with disabilities who need help with daily activities — like bathing, dressing, and medication management — but not 24-hour skilled nursing. Offers housing, meals, and around-the-clock support while aiming to maximize resident independence.
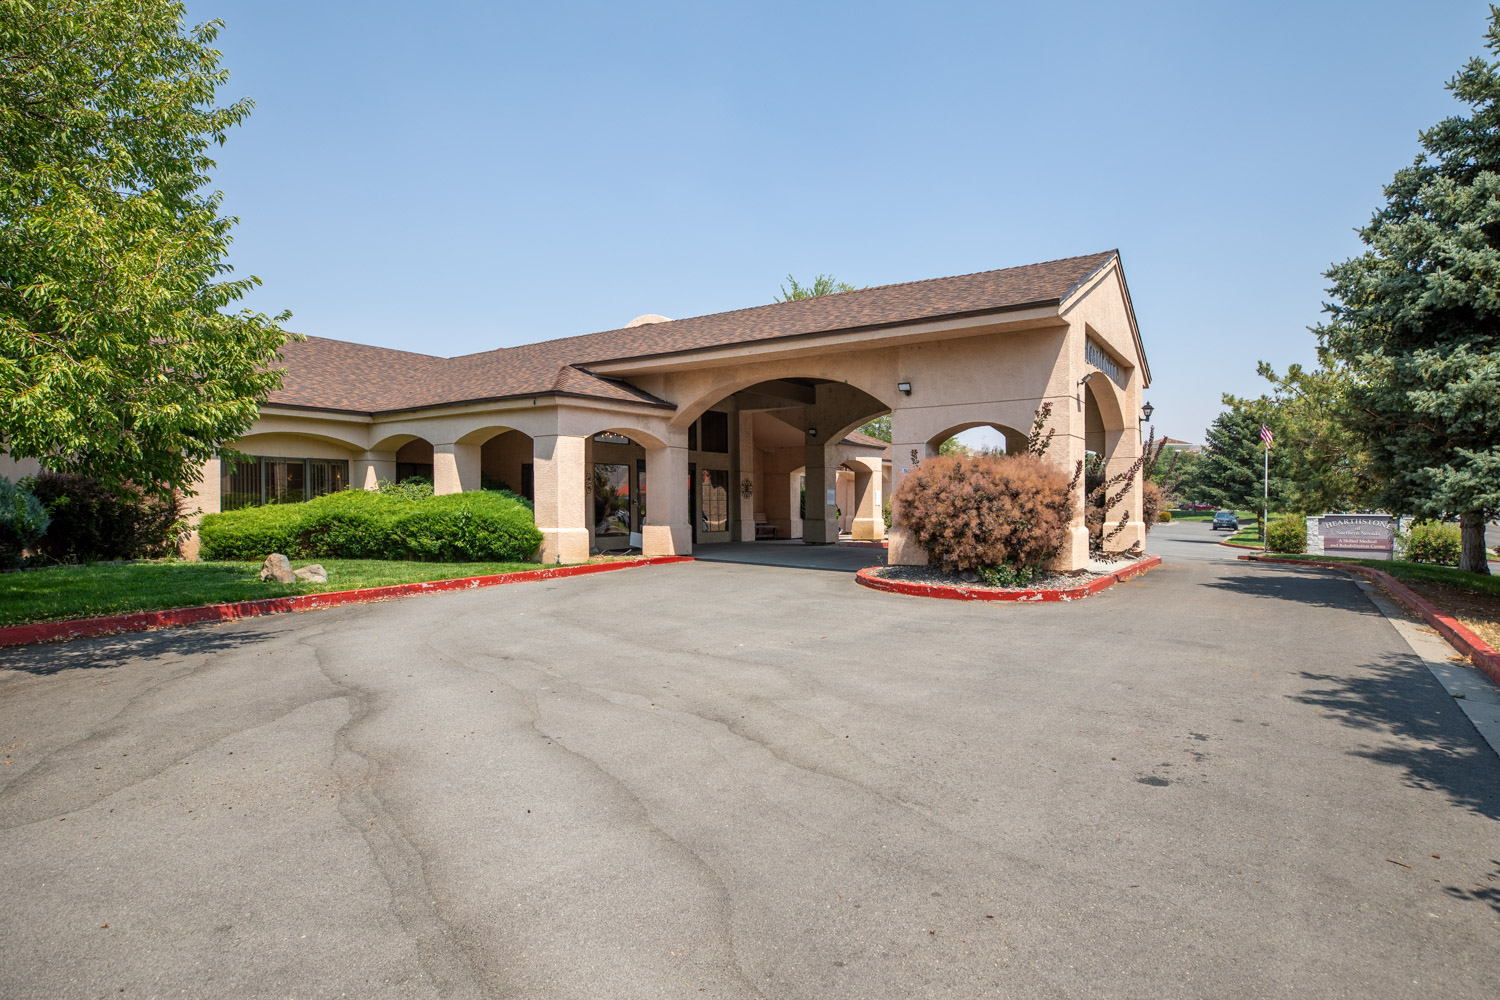
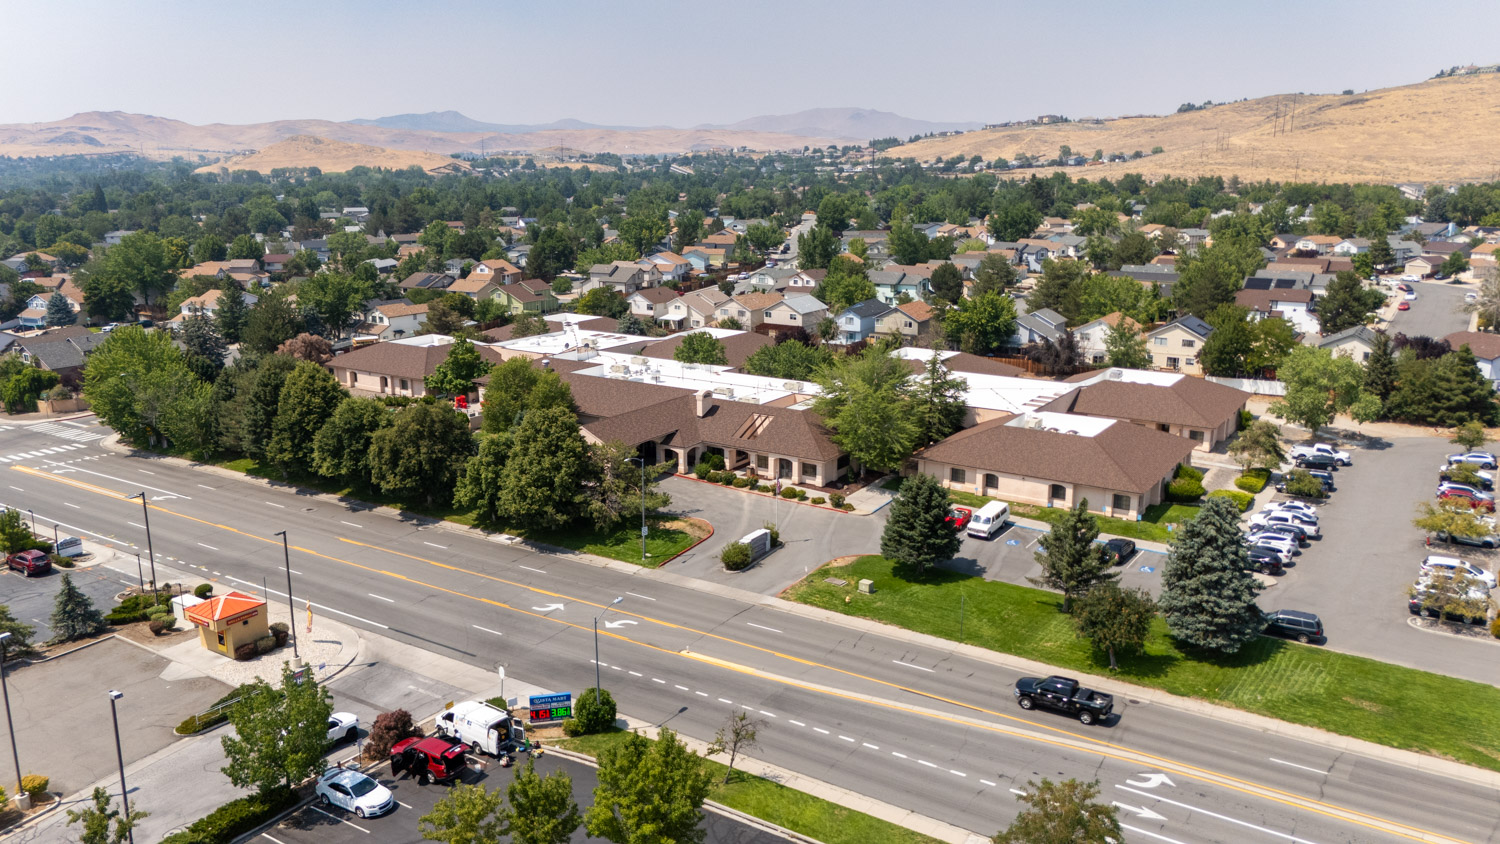
![]() 4.1 miles from city center — 1.45 miles to nearest hospital (Reno Clinical Trials)
4.1 miles from city center — 1.45 miles to nearest hospital (Reno Clinical Trials)
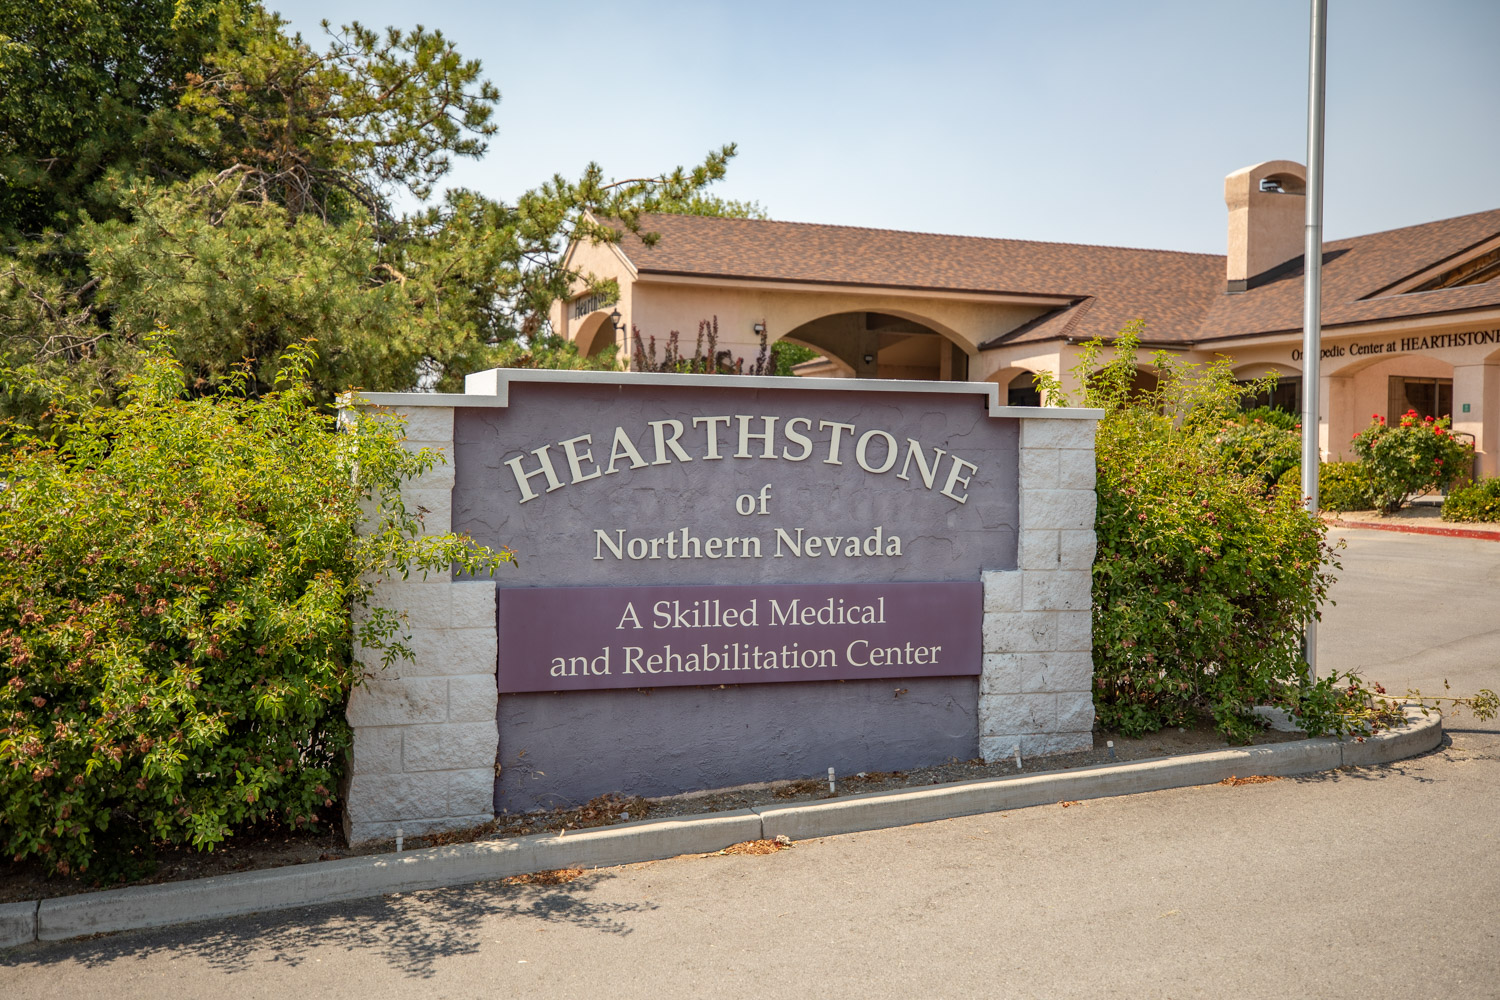
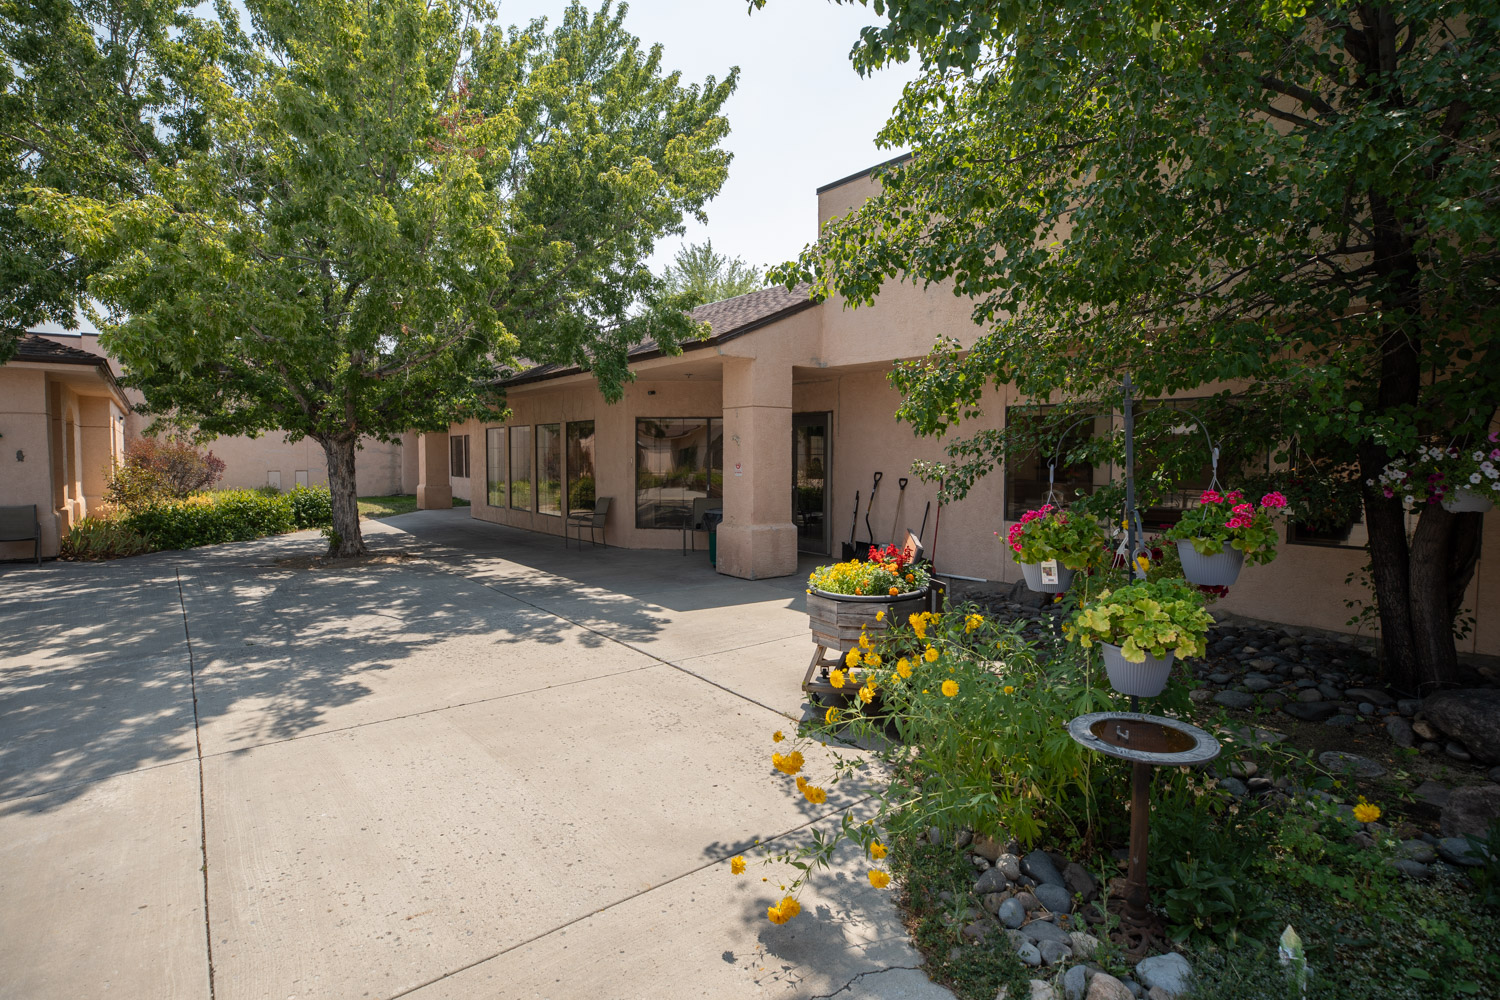
![]() 1950 Baring Blvd, Sparks, NV 89434
1950 Baring Blvd, Sparks, NV 89434
Add your location
This data corresponds to Q2 2025 and is based on CMS Payroll-Based Journal.
Nevada average ratio: 1.57:1
Nevada average: 8.8 hours
Manages medical care and health needs.
No contractors work on this role.
Assists with medical care and medications.
No contractors work on this role.
Helps with daily care and mobility.
No contractors work on this role.
Total hours from contractors
0 contractor hours this quarter
No contractor roles were reported this quarter.
| Certified Nursing Assistant | 64 | 0 | 64 | 17,493 | 91 | 100% | 8.9 |
| Licensed Practical Nurse | 28 | 0 | 28 | 8,536 | 91 | 100% | 9.4 |
| Registered Nurse | 11 | 0 | 11 | 3,481 | 91 | 100% | 9.7 |
| Dental Services Staff | 5 | 0 | 5 | 2,080 | 84 | 92% | 7.3 |
| Clinical Nurse Specialist | 4 | 0 | 4 | 1,570 | 65 | 71% | 9.1 |
| Physical Therapy Aide | 3 | 0 | 3 | 1,366 | 68 | 75% | 7.5 |
| Qualified Social Worker | 3 | 0 | 3 | 1,270 | 78 | 86% | 7.6 |
| RN Director of Nursing | 4 | 0 | 4 | 1,086 | 68 | 75% | 8.7 |
| Speech Language Pathologist | 2 | 0 | 2 | 864 | 71 | 78% | 6.8 |
| Respiratory Therapy Technician | 4 | 0 | 4 | 641 | 64 | 70% | 7.2 |
| Nurse Practitioner | 1 | 0 | 1 | 549 | 61 | 67% | 9 |
| Administrator | 1 | 0 | 1 | 496 | 62 | 68% | 8 |
| Occupational Therapy Aide | 1 | 0 | 1 | 488 | 61 | 67% | 8 |
| Mental Health Service Worker | 1 | 0 | 1 | 480 | 60 | 66% | 8 |
| Dietitian | 1 | 0 | 1 | 468 | 67 | 74% | 7 |
| Other Dietary Services Staff | 2 | 0 | 2 | 417 | 73 | 80% | 5.7 |
| Physical Therapy Assistant | 5 | 0 | 5 | 173 | 42 | 46% | 3.5 |
Source: CMS Long-Term Care Facility Characteristics (Data as of Jan 2026)
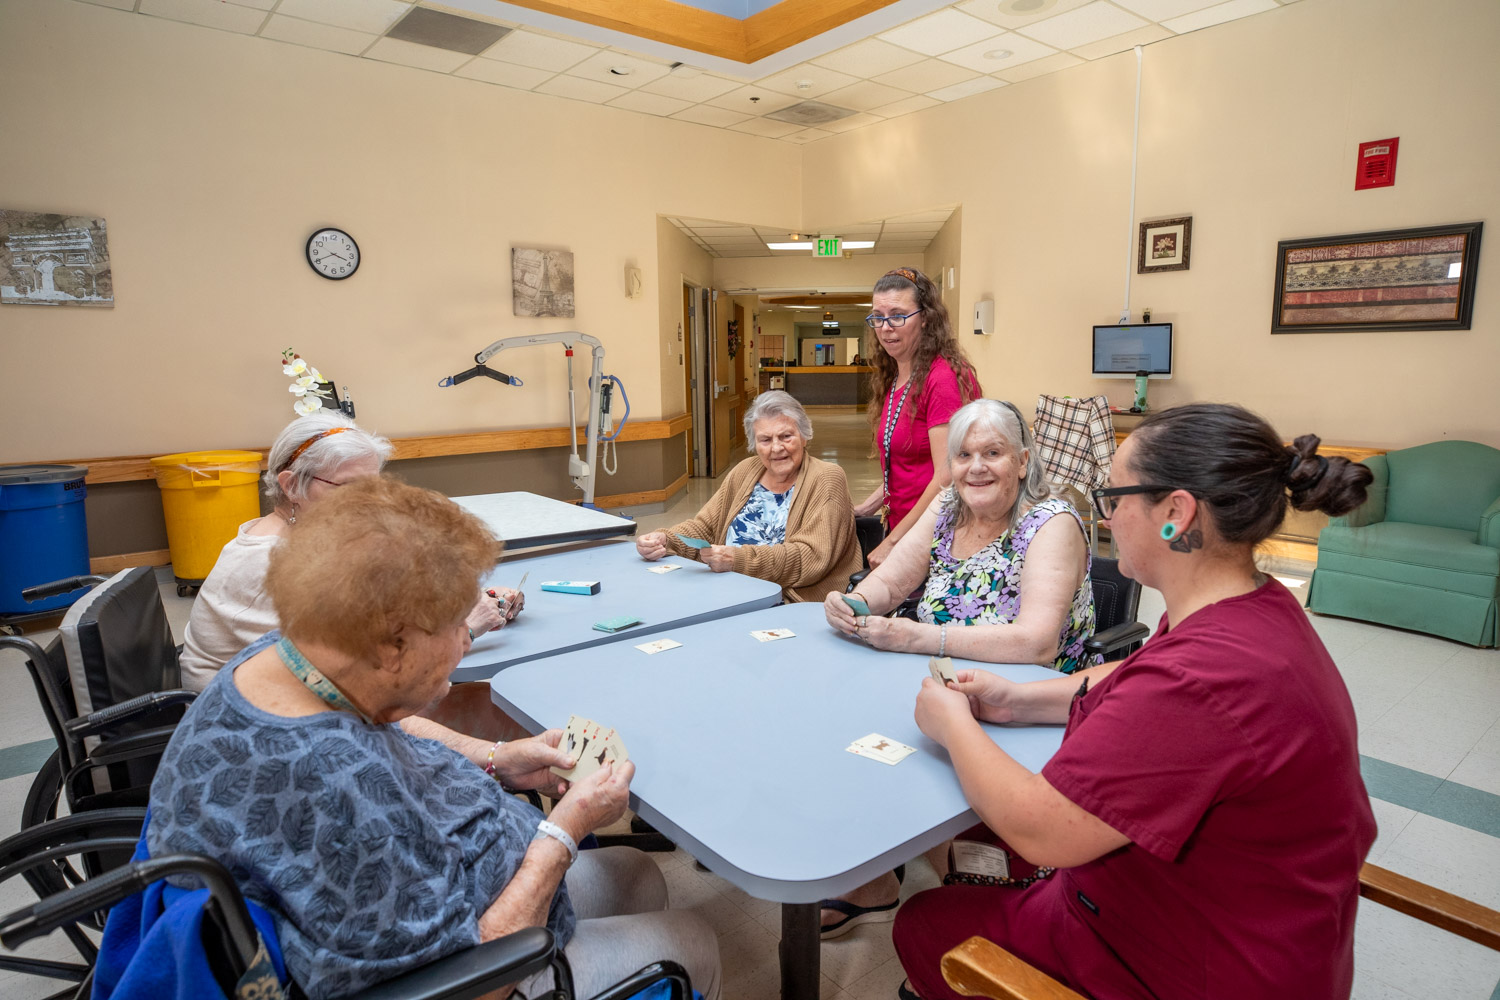
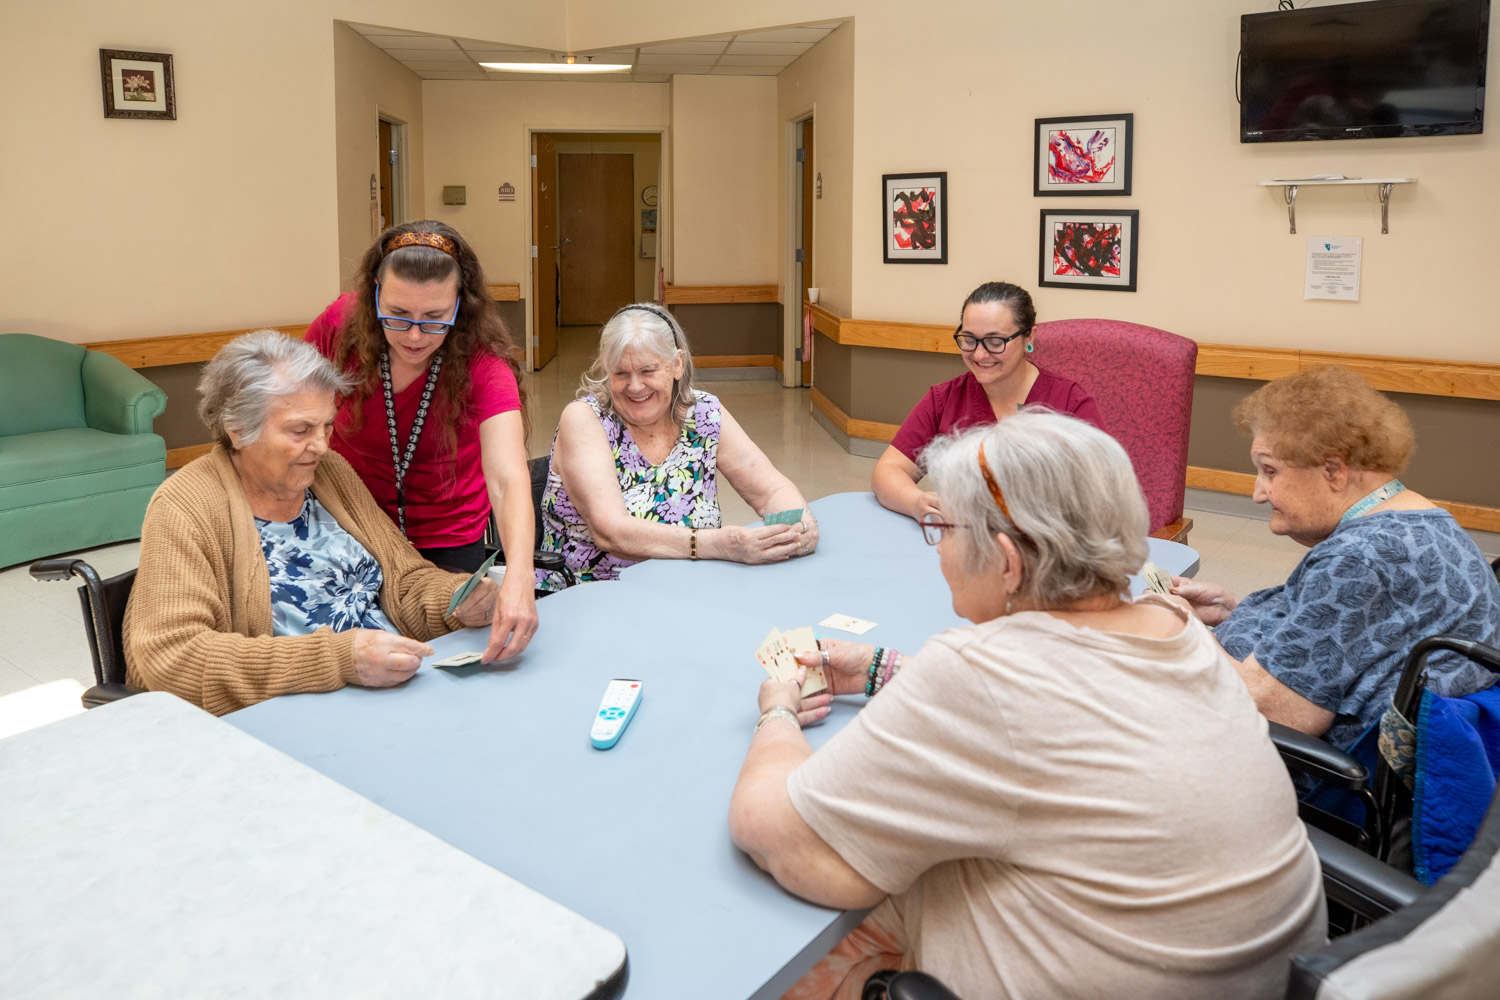
Residents meet regularly to discuss policies, care quality, and activities
Organized group of residents that meets regularly to discuss facility policies, quality of life, and activities.
Data sourced from CMS Long-Term Care Facility Characteristics quarterly report. Payer mix reflects the current resident census by primary payment source.
These measures show how residents usually do over time at this home, based on health outcomes and preventive care.
Nevada average: 9.7
Nevada average: 17.5
Nevada average: 15.6%
Nevada average: 20.8%
Nevada average: 16.9%
Nevada average: 2.5%
Nevada average: 5.5%
Nevada average: 1.4%
Nevada average: 5.4%
Nevada average: 4.2%
Nevada average: 14.1%
Nevada average: 91.0%
Nevada average: 89.6%
Nevada average: 1.82
Nevada average: 1.50
Nevada average: 83.9%
Nevada average: 2.0%
Nevada average: 80.7%
Nevada average: 23.4%
Nevada average: 9.8%
Nevada average: 0.8%
Nevada average: 53.7%
Nevada average: 50.6%
Quality measures are calculated from Minimum Data Set (MDS) assessments. For most measures, lower percentages indicate better care quality.
Federal penalties imposed by CMS for regulatory violations, including civil money penalties (fines) and denials of payment for new Medicare/Medicaid admissions.
Source: CMS Penalties Database (Data as of Jan 2026)
Nevada average: $34K
Nevada average: 1.4
Nevada average: 0.1
Penalties are imposed by CMS for violations of federal nursing home regulations.
Last updated: Jan 2026
Historical financial and operational data for Hearthstone of Northern Nevada based on CMS SNF Cost Reports.
Loading trend charts...
Care Cost Calculator: See Prices in Your Area
Nursing Home Data Explorer
Don’t Wait Too Long: 7 Red Flag Signs Your Parent Needs Assisted Living Now
The True Cost of Assisted Living in 2025 – And How Families Are Paying For It
Understanding Senior Living Costs: Pricing Models, Discounts & Financial Assistance

Touring a community? Use this expert-backed checklist to stay organized, ask the right questions, and find the perfect fit.
We'll send you a PDF version of the touring checklist.