


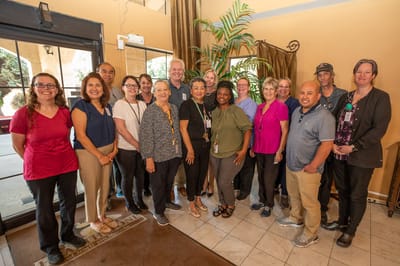
Total staff
152
Employees
152
Contractors
0
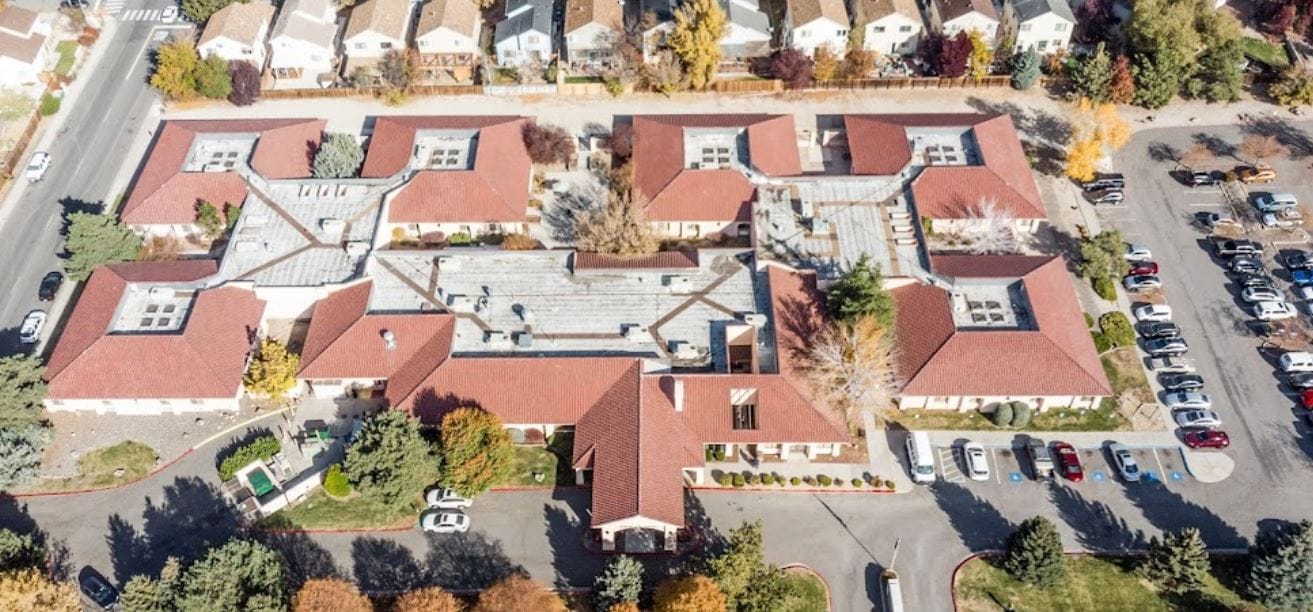
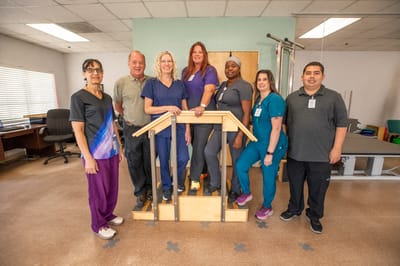
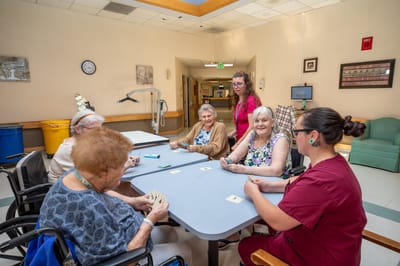
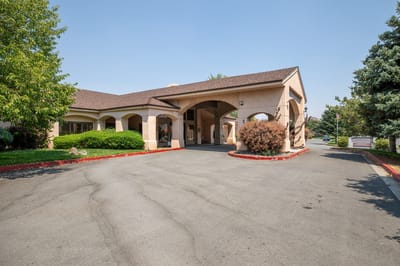
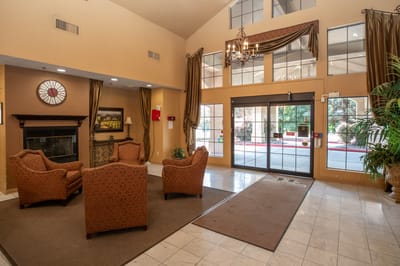
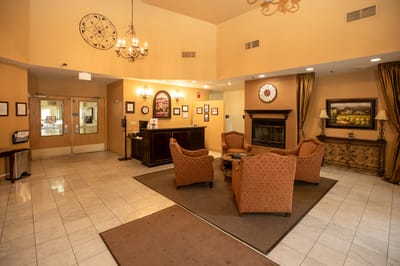
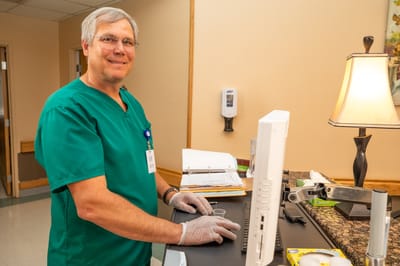

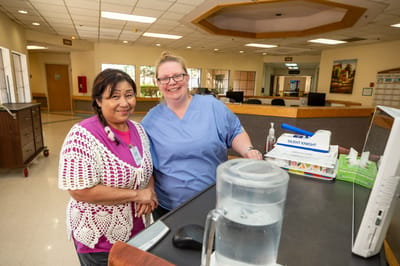
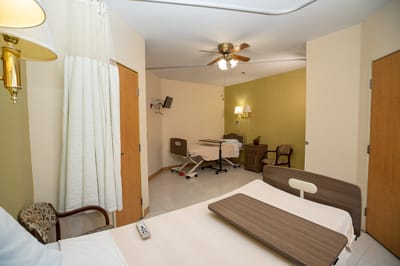
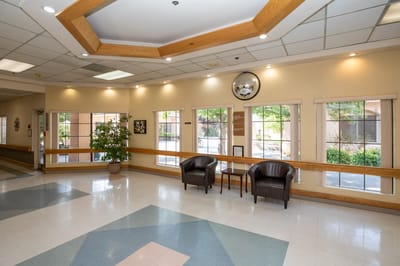
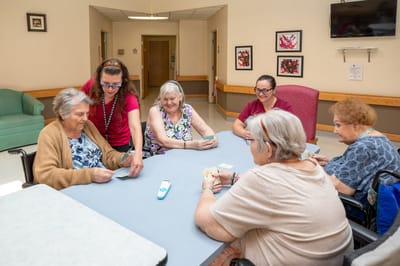
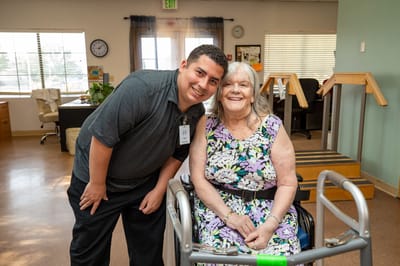
Standing tall among senior living communities in Sparks, Nevada, Hearthstone of Northern Nevada is renowned for exceptional nursing home care. This community is committed to providing superior care to its residents, particularly when they need it the most. Striking an effective balance between clinical outcomes and social well-being, Hearthstone operates under the principle of prioritizing resident needs, all in a homelike atmosphere.
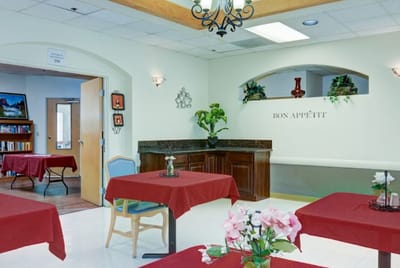
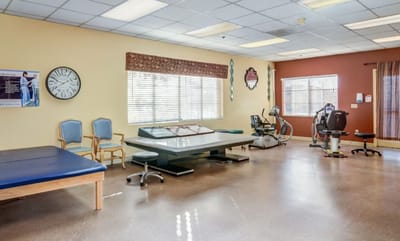
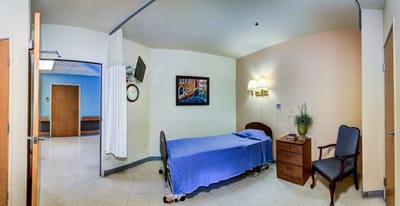
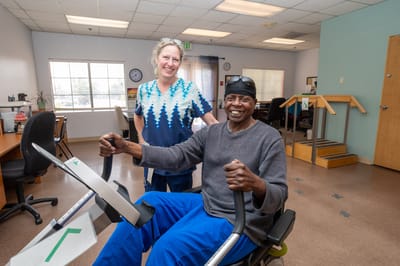
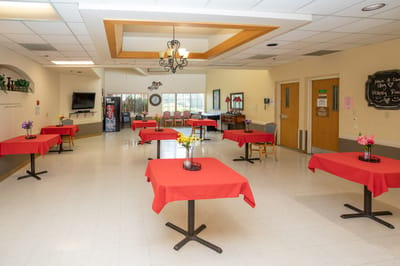
Hearthstone extends an array of essential services, from certified wound care and skilled nursing care to short-term rehabilitation, long-term care, and varying levels of hospice-respite support, demonstrating an effective and inclusive approach to nursing home care. The community also offers cutting-edge nutritional and culinary support, ensuring residents’ wellbeing extends beyond just medical needs. Engaging with residents at their time of need, Hearthstone of Northern Nevada personifies a commitment to care and compassion.
| Staff type | Hours / Day / Resident | vs state avg |
|---|---|---|
|
Registered Nurse (RN)
| 40m per day | ▼ 38% State avg: 1h 4m per day · National avg: 41m per day |
|
LPN / LVN
| 59m per day | ▲ 10% State avg: 54m per day · National avg: 52m per day |
|
Nurse Aide
| 1h 57m per day | ▼ 18% State avg: 2h 23m per day · National avg: 2h 21m per day |
|
Weekend Total Nursing
| 3h 6m per day | ▼ 20% State avg: 3h 51m per day · National avg: 3h 26m per day |
|
Physical Therapist
| 6m per day | ▲ 13% State avg: 5m per day · National avg: 4m per day |
|
Weekend RN
| 19m per day | ▼ 62% State avg: 51m per day · National avg: 29m per day |
Reporting period: October 1 – December 31, 2025 (Q4 2025). Source: CMS Payroll-Based Journal report.
Manages medical care and health needs.
Assists with medical care and medications.
Helps with daily care and mobility.
| Certified Nursing Assistant | 73 | 0 | 73 | 20,083 | 92 | 100% | 8.5 |
| Licensed Practical Nurse | 28 | 0 | 28 | 9,580 | 92 | 100% | 9.6 |
| Registered Nurse | 13 | 0 | 13 | 4,587 | 92 | 100% | 9.6 |
| Clinical Nurse Specialist | 7 | 0 | 7 | 1,677 | 66 | 72% | 8.9 |
| Dental Services Staff | 5 | 0 | 5 | 1,561 | 72 | 78% | 7.9 |
| Physical Therapy Aide | 4 | 0 | 4 | 1,287 | 69 | 75% | 7.1 |
| Qualified Social Worker | 4 | 0 | 4 | 1,023 | 68 | 74% | 7.8 |
| Respiratory Therapy Technician | 3 | 0 | 3 | 974 | 71 | 77% | 8.5 |
| Speech Language Pathologist | 2 | 0 | 2 | 798 | 78 | 85% | 6.8 |
| Nurse Practitioner | 1 | 0 | 1 | 585 | 65 | 71% | 9 |
| RN Director of Nursing | 2 | 0 | 2 | 582 | 64 | 70% | 8.9 |
| Physical Therapy Assistant | 4 | 0 | 4 | 581 | 74 | 80% | 6.8 |
| Occupational Therapy Aide | 1 | 0 | 1 | 496 | 62 | 67% | 8 |
| Dietitian | 1 | 0 | 1 | 484 | 67 | 73% | 7.2 |
| Mental Health Service Worker | 1 | 0 | 1 | 480 | 60 | 65% | 8 |
| Other Dietary Services Staff | 2 | 0 | 2 | 386 | 64 | 70% | 6 |
| Administrator | 1 | 0 | 1 | 368 | 46 | 50% | 8 |
Includes penalties issued in 2023
Federal penalties imposed by CMS for regulatory violations, including civil money penalties (fines) and denials of payment for new Medicare/Medicaid admissions.
Source: CMS Penalties Database (Data as of Jan 2026)
Nevada average: $34K
Nevada average: 1.4
Nevada average: 0.1
Penalties are imposed by CMS for violations of federal nursing home regulations.
1 penalty in the past 3 years
Nov 16, 2023 · $49K
Last updated: Jan 2026
These measures show how residents usually do over time at this home, based on health outcomes and preventive care.
Nevada average: 9.7
Nevada average: 17.5
Nevada average: 15.6%
Nevada average: 20.8%
Nevada average: 16.9%
Nevada average: 2.5%
Nevada average: 5.5%
Nevada average: 1.4%
Nevada average: 5.4%
Nevada average: 4.2%
Nevada average: 14.1%
Nevada average: 91.0%
Nevada average: 89.6%
Nevada average: 1.82
Nevada average: 1.50
Nevada average: 83.9%
Nevada average: 2.0%
Nevada average: 80.7%
Nevada average: 23.4%
Nevada average: 9.8%
Nevada average: 0.8%
Nevada average: 53.7%
Nevada average: 50.6%
Quality measures are calculated from Minimum Data Set (MDS) assessments. For most measures, lower percentages indicate better care quality.
39% of new residents, usually for short-term rehab.
60% of new residents, often for short stays.
1% of new residents, often for long-term daily care.
Source: CMS Long-Term Care Facility Characteristics (Data as of Jan 2026)
Residents meet regularly to discuss policies, care quality, and activities
Organized group of residents that meets regularly to discuss facility policies, quality of life, and activities.
Data sourced from CMS Long-Term Care Facility Characteristics quarterly report. Payer mix reflects the current resident census by primary payment source.
Historical financial and operational data for Hearthstone of Northern Nevada from 2012–2022, based on CMS SNF Cost Reports.
Key figures below are for fiscal year ending in 12/2022 — the home's most recent complete cost report, an older period than most facilities report.
Based on the home's most recent complete CMS SNF Cost Report — fiscal year ending in 12/2022. This is an older period than most facilities report, so compare with that in mind.
Residents typically stay for brief periods, with frequent admissions and discharges throughout the year.
Most new residents arrive under private pay (60% of admissions), and a typical private pay stay runs around 25 days.
Coverage residents most often arrive under.
Coverage residents most often leave under.
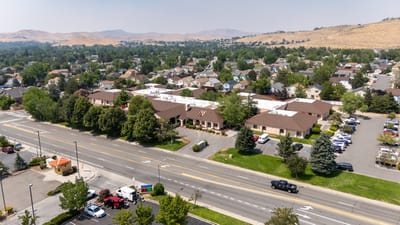
![]() 4.1 miles from city center
4.1 miles from city center
![]() Estimated distance in miles from Sparks's city center to Hearthstone of Northern Nevada's address, calculated via Google Maps.
Estimated distance in miles from Sparks's city center to Hearthstone of Northern Nevada's address, calculated via Google Maps.
Add your location
Info below is compiled from CMS reports & the NV Dept. of Health & Human Services, senior community websites & trusted data sources such as Walk Score & BBB.
Communities are listed from highest to lowest based on our ranking methodology.
| Northern Nevada State Veterans Home | NH MC SNF | Sparks | 96
Facility
96
NV AVG
42
Rank
#66 / 321 |
95.8%
Facility
95.8%
NV AVG
79.4
Rank
#59 / 263 | +21% | 5.66
Facility
5.66
NV AVG
4.03
Rank
#1 / 40 | -2% | +40% | $0
Facility
$0
NV AVG
$34.1k
Rank
#1 / 42 | 57
Facility
57
NV AVG
36.2
Rank
#34 / 42 | 7.1
Facility
7.1
NV AVG
7.1
Rank
#24 / 42 | 1 | 92 | - |
74
Facility
74
NV AVG
45
Rank
#26 / 415 | Avalon Veterans Services, L.l.c | $18.3MFiscal year ending 06/2024
Facility
$18.3MFiscal year ending 06/2024
NV AVG
$18.7M
Rank
#23 / 42 | $9.3MFiscal year ending 06/2024
Facility
$9.3MFiscal year ending 06/2024
NV AVG
$6.3M
Rank
#11 / 42 | 50.9%Fiscal year ending 06/2024
Facility
50.9%Fiscal year ending 06/2024
NV AVG
34.9%
Rank
#9 / 42 | 295105 | ||||
| Wingfield Skilled Nursing And Rehabilitation Center | NH SNF | Sparks (Saddlebrook) | 120
Facility
120
NV AVG
42
Rank
#42 / 321 |
94.2%
Facility
94.2%
NV AVG
79.4
Rank
#66 / 263 | +19% | 3.77
Facility
3.77
NV AVG
4.03
Rank
#8 / 40 | +3% | -6% | $75.7k
Facility
$75.7k
NV AVG
$34.1k
Rank
#41 / 42 | 56
Facility
56
NV AVG
36.2
Rank
#33 / 42 | 11.2
Facility
11.2
NV AVG
7.1
Rank
#38 / 42 | 3 | 113 | - |
13
Facility
13
NV AVG
45
Rank
#373 / 415 | - | $14.2MFiscal year ending 12/2023
Facility
$14.2MFiscal year ending 12/2023
NV AVG
$18.7M
Rank
#22 / 42 | $7.1MFiscal year ending 12/2023
Facility
$7.1MFiscal year ending 12/2023
NV AVG
$6.3M
Rank
#28 / 42 | 50.2%Fiscal year ending 12/2023
Facility
50.2%Fiscal year ending 12/2023
NV AVG
34.9%
Rank
#38 / 42 | 295088 | ||||
| Hearthstone of Northern Nevada | NH SNF | Sparks (Baring Boulevard) | 125
Facility
125
NV AVG
42
Rank
#36 / 321 |
89.6%
Facility
89.6%
NV AVG
79.4
Rank
#94 / 263 | +13% | 3.50
Facility
3.50
NV AVG
4.03
Rank
#19 / 40 | -43% | -13% | $48.7k
Facility
$48.7k
NV AVG
$34.1k
Rank
#37 / 42 | 72
Facility
72
NV AVG
36.2
Rank
#39 / 42 | 12.0
Facility
12.0
NV AVG
7.1
Rank
#39 / 42 | 3 | 112 | - |
40
Facility
40
NV AVG
45
Rank
#255 / 415 | - | $11.7M*Fiscal year ending 12/2022These figures are from this home's most recent complete cost report — an older period than most facilities report. Compare with that in mind.
Facility
$11.7M*Fiscal year ending 12/2022These figures are from this home's most recent complete cost report — an older period than most facilities report. Compare with that in mind.
NV AVG
$18.7M
Rank
#32 / 42 | $6.5M*Fiscal year ending 12/2022These figures are from this home's most recent complete cost report — an older period than most facilities report. Compare with that in mind.
Facility
$6.5M*Fiscal year ending 12/2022These figures are from this home's most recent complete cost report — an older period than most facilities report. Compare with that in mind.
NV AVG
$6.3M
Rank
#30 / 42 | 56%*Fiscal year ending 12/2022These figures are from this home's most recent complete cost report — an older period than most facilities report. Compare with that in mind.
Facility
56%*Fiscal year ending 12/2022These figures are from this home's most recent complete cost report — an older period than most facilities report. Compare with that in mind.
NV AVG
34.9%
Rank
#12 / 42 | 295044 |
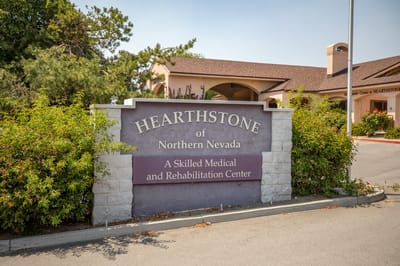
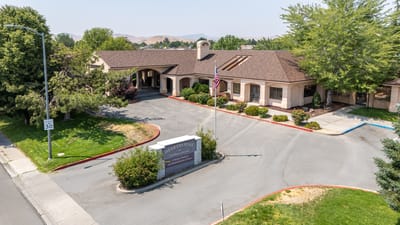
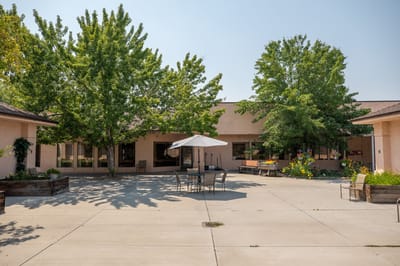
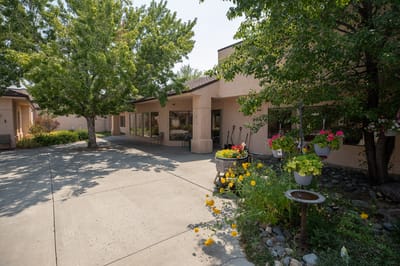
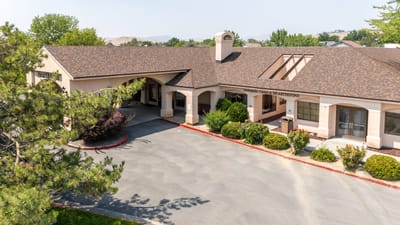
Hearthstone of Northern Nevada is located in Sparks, Nevada.
Here are the financial assistance programs available to residents in Nevada.
Hearthstone of Northern Nevada is in the Baring Boulevard neighborhood.
Hearthstone of Northern Nevada has a walk score of 40. Somewhat walkable. A few nearby services may be reachable on foot, but most trips require transportation.
Hearthstone of Northern Nevada's occupancy is 91.3%.
No, Hearthstone of Northern Nevada has a no-pet policy.
Hearthstone of Northern Nevada is registered as a for-profit.
Yes — there are 35 photos of Hearthstone of Northern Nevada in the photo gallery on this page.
Hearthstone of Northern Nevada is located at 1950 Baring Blvd, Sparks, NV 89434.
Care Cost Calculator: See Prices in Your Area
Nursing Home Data Explorer
Don’t Wait Too Long: 7 Red Flag Signs Your Parent Needs Assisted Living Now
The True Cost of Assisted Living in 2025 – And How Families Are Paying For It
Understanding Senior Living Costs: Pricing Models, Discounts & Financial Assistance


