Nursing Home

Heritage Trails Nursing & Rehabilitation

Nursing Home

Heritage Trails Nursing & Rehabilitation

301 Lincoln Park Dr, Cleburne, TX 76033 View map
Overview of Heritage Trails Nursing & Rehabilitation

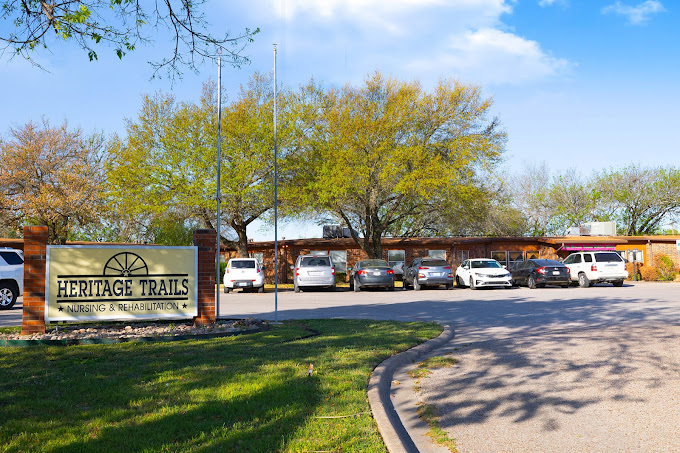
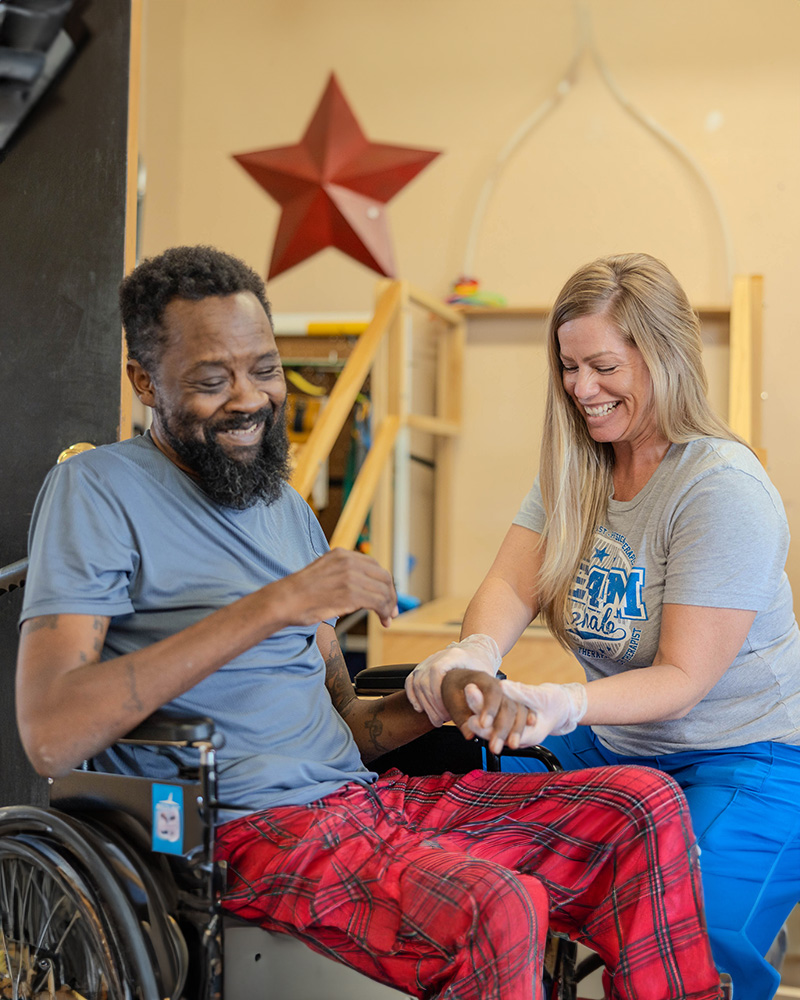
Offering skilled nursing, rehabilitation therapy, and long and short-term care, Heritage Trails Nursing and Rehab located in Lincoln Park Drive, Cleburne, TX, strives to enhance seniors’ quality of life. With physical, speech, and occupational therapy, the community provides its residents with the utmost care and support they deserve. Residents may keep their woes away and families ease their minds with a team of compassionate, reliable, and well-trained professionals tending to their needs.

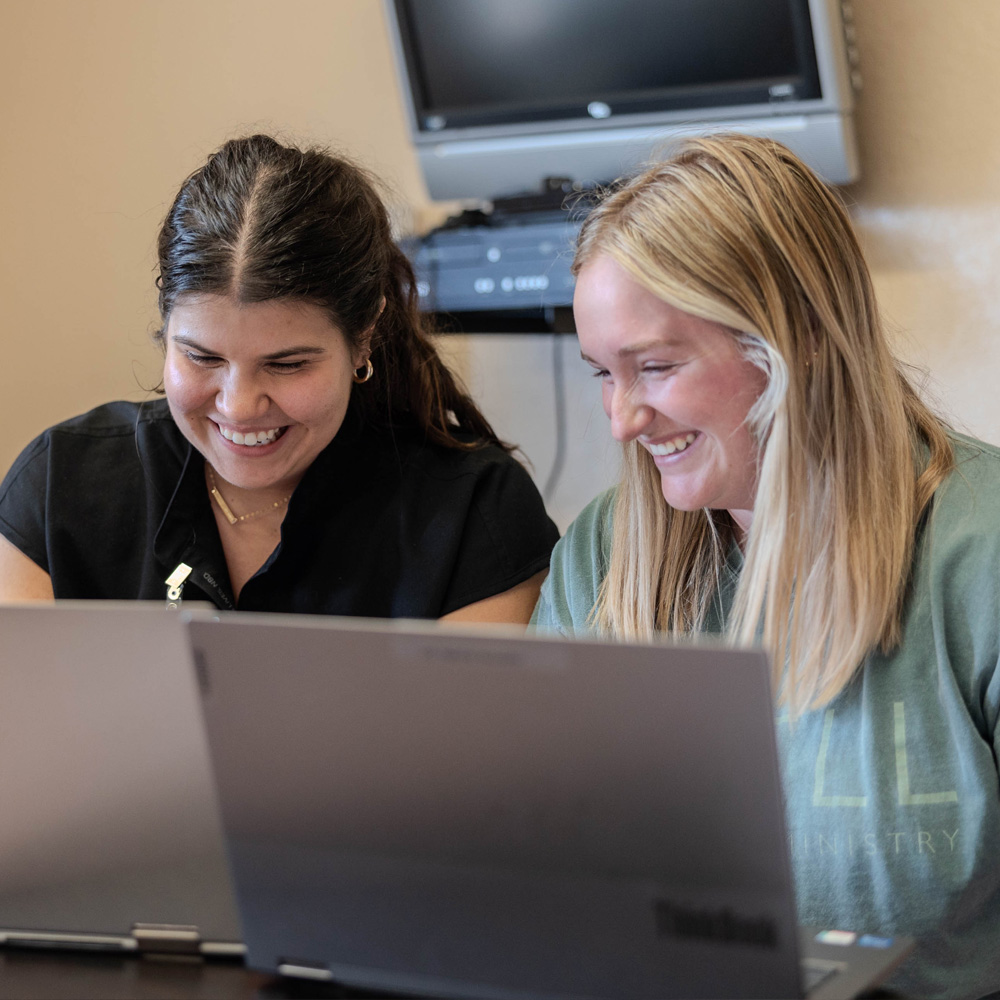
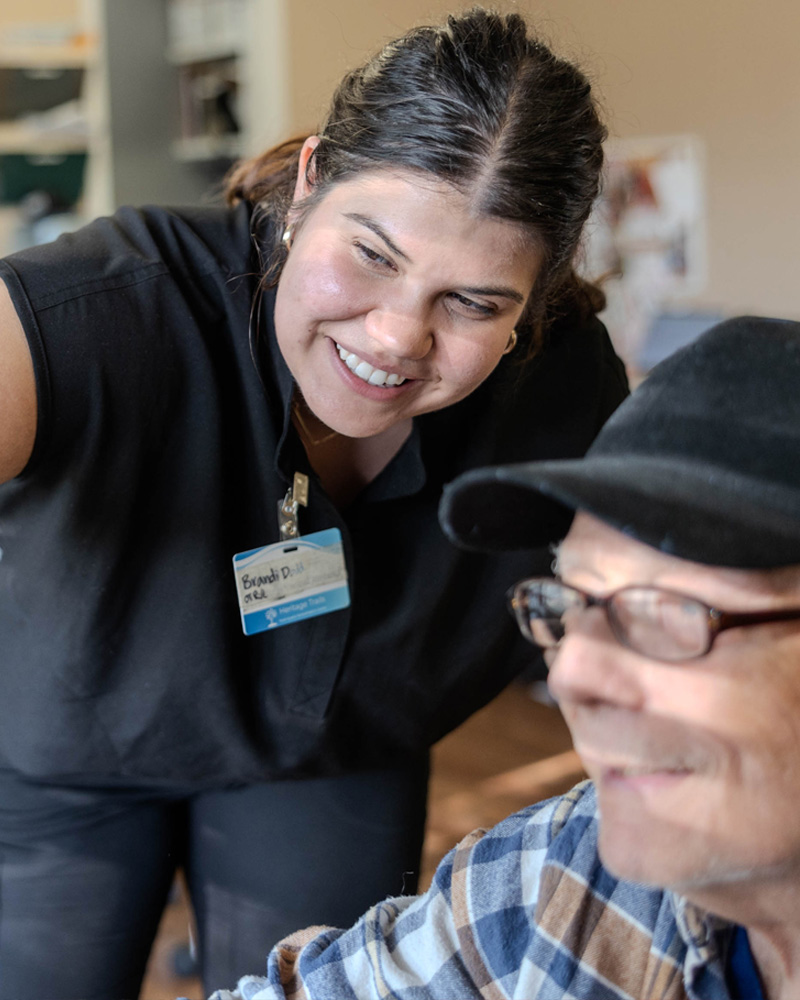
The community understands the uniqueness of every individual, communicating with its residents to devise a care plan that best suits their specific needs. Fostering a healing and nurturing environment, the community ensures a comfortable and safe accommodation. Heritage Trails Nursing and Rehab is an ideal place to start your healing journey accompanied by serene surroundings.

(817) 558-8999

Quality ratings

Measured by Centers for Medicare & Medicaid Services (CMS)

Overall rating Info Official CMS rating based on health inspections, staffing and quality measures.
4/5
Texas average: 3.0/5
Health Inspection Info Official CMS rating based on deficiencies found during state health inspections.
4/5
Texas average: 2.9/5
Staffing Info Official CMS rating based on nurse staffing hours per resident per day.
2/5
Texas average: 2.4/5
Quality Measures Info Official CMS rating based on clinical outcomes for residents.
3/5
Texas average: 4.0/5

Nursing care per resident

Info Average daily nursing hours per resident (adjusted for acuity). Higher values indicate more nursing time per resident.
3h 9m per day

This home provides 16% less nursing time per resident than the Texas average.

Texas average: 3h 46m per day

Staffing hours breakdown

Info Hours of care per resident per day, broken down by staff type. Data from CMS Medicare.
Staff type Facility State avg National avg
Registered Nurse (RN) Info Registered nurse hours per resident per day. 15m per day 21m per day 29m per day

Capacity and availability

Medium-capacity home

Offers a balance of services and community atmosphere.

Total beds 122

This home usually has availability

Lower occupancy suggests more openings may be available.

Lower demand than the Texas average
Occupancy rate 79.1%
Residents per day (avg) 83
Occupancy rate
79.1%
Residents per day (avg)
83

Who this home usually serves

TYPE OF STAY

Mix of rehab and long-term care

This home supports both short-term rehab and long-term care, with residents staying for a wide range of durations.

Breakdown by payment type

Medicare

27% of new residents, usually for short-term rehab.

Typical stay 1 - 2 months

Private pay

57% of new residents, often for short stays.

Typical stay 1 - 2 months

Medicaid

17% of new residents, often for long-term daily care.

Typical stay 1 - 2 years

Finances and operations

Governmental community
Operated by state authorities.
Home revenue
$13.0M
Surplus of revenue
$776.7K
Governmental community Operated by state authorities.
Home revenue
$12,961,777.00
Surplus of revenue
$776,668.00
Payroll costs Info The portion of the home's budget spent on staff, including nurses, caregivers, and other employees who support care and operations.
$1
0% of revenue
Other operating costs Info All remaining costs needed to run the home, such as food, utilities, building maintenance, supplies and administrative expenses.
$13.0M
Total costs $13.0M
Bed community size
122-bed community
A larger shared setting that may offer more common spaces and organized community services.
Years in operation
28 years in operation
A longer operating history, which may indicate experience navigating regulations and delivering ongoing care.
Walk Score
Walk Score: 35 / 100
Somewhat walkable. A few nearby services may be reachable on foot, but most trips require transportation.

Services

Medicare/medicaid

About this community

License details

Facility type
Nursing
Status Active
Issuance January 10, 2025
Expiration January 10, 2028
County: JOHNSON

Additional licensing details

License number: 308998
Year opened: 1/21/1998

Ownership & operating entity

Heritage Trails Nursing & Rehabilitation is administrated by SAMANTHA KING.

Management company: CLEBURNE NURSING AND REHAB CENTER LLC
Owner: MAVERICK COUNTY HOSPITAL BOARD
Ownership type: HOSPITAL DISTRICT/AUTHORITY

Type Of Units

Medicare
2 units
Medicaid and Medicare
120 units
Total beds
122 units

Staffing

Key information about the people who lead and staff this community.

Leadership

Administrator email: [email protected]

What does this home offer?

Building type icon
Building type icon

Building Type: Single-story

Types of Care at Heritage Trails Nursing & Rehabilitation

Skilled Nursing
Contact Heritage Trails Nursing & Rehabilitation

Health Inspection History

Inspections
Total health inspections 7

Texas average 7.4


Last Health inspection on May 2025

Total health citations 12
Citations per inspection
1.71

Health citations are formal notices following inspections when they fail to comply with safety and care standards.

6 of 12 citations resulted from standard inspections; and 6 of 12 resulted from complaint investigations.

Breakdown of citation severity (last 3 years)
Critical Health citations More info 2
In line with Texas average

Texas average: 2


Serious Health citations More info 1
150% worse than Texas average

Texas average: 0.4

2 critical citations More info Texas average: 2

1 serious citation More info Texas average: 0.4

9 moderate citations More info Texas average: 23

0 minor citations More info Texas average: 0.4
Citations history (last 3 years)
Resident Rights moderate citation May 08, 2025
Corrected

Quality of Care critical citation Sep 19, 2024
Corrected

Care Planning critical citation Sep 19, 2024
Corrected

Infection Control moderate citation Jul 11, 2024
Corrected

Compare Nursing Homes around Cleburne

The information below is reported by the Texas Health and Human Services Commission.
Heritage Trails Nursing & Rehabilitation
SNF

Nursing Homes 24/7 care needed

Cleburne
122
35
CLEBURNE NURSING AND REHAB CENTER LLC
79.1%
$11,964,561.00
$1.00
0%
83.40
4/5
3.1494
4/5
2/5
3/5
7
12
3
-56%
-13%
+25%

Places of interest near Heritage Trails Nursing & Rehabilitation

Address 1.8 miles from city center — 17.72 miles to nearest hospital (Texas Health Huguley Hospital)

Address 301 Lincoln Park Dr, Cleburne, TX 76033

Calculate Travel Distance to Heritage Trails Nursing & Rehabilitation

Add your location

Address

Staffing Data

Source: CMS Payroll-Based Journal (Q2 2025)

239
Total Staff
98
Employees
141
Contractors
32,271
Total Hours (Quarter)
47
Avg Staff/Day
7.5
Avg Shift (hrs)
Nursing Staff Breakdown
Role Count Avg Shift (hrs) Uses Contractors?
Registered Nurse 8 7.3 No
Licensed Practical Nurse 68 8.1 Yes
Certified Nursing Assistant 112 7.3 Yes
Staff by Category
Administration
2 staff
8hs shift avg
Nursing Staff
202 staff
7.6hs shift avg
Physicians & Practitioners
4 staff
7.9hs shift avg
Therapy Services
20 staff
7.4hs shift avg
Activities & Recreation
1 staff
7.9hs shift avg
Social Services
6 staff
7.3hs shift avg
Dietary Services
3 staff
8.7hs shift avg
Other Services
1 staff
8hs shift avg
Contractor Analysis
10.7%
of total hours from contractors
3,455 contractor hours this quarter
Certified Nursing Assistant: 81 Licensed Practical Nurse: 57 Qualified Social Worker: 1 Physician Assistant: 1 Feeding Assistant: 1
Role Employees Contractors Total Staff Total Hours Days Worked % of Days Avg Shift (hrs)
Certified Nursing Assistant 31 81 112 9,918 91 100% 7.3
Licensed Practical Nurse 11 57 68 5,287 91 100% 8.1
Physical Therapy Aide 10 0 10 2,802 77 85% 7.1
Speech Language Pathologist 6 0 6 2,383 72 79% 7.6
Registered Nurse 8 0 8 2,229 91 100% 7.3
RN Director of Nursing 5 0 5 1,535 67 74% 7.9
Medication Aide/Technician 6 0 6 1,459 91 100% 9
Qualified Social Worker 5 1 6 1,183 78 86% 7.3
Other Dietary Services Staff 3 0 3 1,167 77 85% 8.7
Respiratory Therapy Technician 3 0 3 1,053 73 80% 7.5
Administrator 2 0 2 536 64 70% 8
Clinical Nurse Specialist 1 0 1 512 64 70% 8
Mental Health Service Worker 1 0 1 512 64 70% 8
Physical Therapy Assistant 1 0 1 504 63 69% 8
Qualified Activities Professional 1 0 1 400 51 56% 7.9
Nurse Practitioner 2 0 2 376 47 52% 8
Physician Assistant 0 1 1 212 28 31% 7.6
Nurse Aide in Training 2 0 2 201 30 33% 5.6
Feeding Assistant 0 1 1 2 4 4% 0.6

Facility Characteristics

Source: CMS Long-Term Care Facility Characteristics (Data as of Jan 2026)

Total census
89 residents
Residents by payment source
Medicare
3 residents (3.4%)
Medicaid
60 residents (67.4%)
Private pay or other
26 residents (29.2%)
Programs & Services
Residents' Group

Residents meet regularly to discuss policies, care quality, and activities

Active Resident Council

Organized group of residents that meets regularly to discuss facility policies, quality of life, and activities.

Quality of care over time

These measures show how residents usually do over time at this home, based on health outcomes and preventive care.

High-risk clinical events score Info A composite score based on pressure ulcers, falls with injury, weight loss, walking ability decline, and activities of daily living decline. 10.0
16% worse than Texas average

Texas average: 8.6

Functional decline score Info A composite score based on activities of daily living decline, walking ability decline, and incontinence. 17.3
8% worse than Texas average

Texas average: 16.0

Long-stay resident measures
Average Texas avg: 4.2 Info CMS star rating based on long-stay quality measure performance. 5 stars = significantly above average, 1 star = significantly below average.
Need for Help with Daily Activities Increased Info Percent of long-stay residents whose need for help with daily activities has increased 14.0%
13% better than Texas average

Texas average: 16.2%

Walking Ability Worsened Info Percent of long-stay residents whose ability to move independently worsened 22.8%
41% worse than Texas average

Texas average: 16.2%

Low Risk Residents with Bowel/Bladder Incontinence Info Percent of low risk long-stay residents who lose control of their bowels or bladder 15.2%
In line with Texas average

Texas average: 15.7%

Falls with Major Injury Info Percent of long-stay residents experiencing one or more falls with major injury 2.4%
26% better than Texas average

Texas average: 3.2%

High Risk Residents with Pressure Ulcers Info Percent of long-stay high risk residents with pressure ulcers 6.5%
48% worse than Texas average

Texas average: 4.4%

Urinary Tract Infection Info Percent of long-stay residents with a urinary tract infection 1.8%
128% worse than Texas average

Texas average: 0.8%

Lost Too Much Weight Info Percent of long-stay residents who lose too much weight 4.2%
22% worse than Texas average

Texas average: 3.5%

Depressive Symptoms Info Percent of long-stay residents who have depressive symptoms 3.4%
19% worse than Texas average

Texas average: 2.9%

Antipsychotic Use Info Percent of long-stay residents who received an antipsychotic medication 18.0%
128% worse than Texas average

Texas average: 7.9%

Pneumococcal Vaccine Info Percent of long-stay residents assessed and appropriately given the pneumococcal vaccine 99.7%
In line with Texas average

Texas average: 97.3%

Influenza Vaccine Info Percent of long-stay residents assessed and appropriately given the seasonal influenza vaccine 94.6%
In line with Texas average

Texas average: 97.9%

Hospitalizations per 1,000 days Info Number of hospitalizations per 1,000 long-stay resident days. 1.47
31% better than Texas average

Texas average: 2.13

ED visits per 1,000 days Info Number of outpatient emergency department visits per 1,000 long-stay resident days. 2.15
In line with Texas average

Texas average: 2.07

Short-stay resident measures
Above average Texas avg: 2.9 Info CMS star rating based on short-stay quality measure performance. 5 stars = much above average, 1 star = much below average.
Pneumococcal Vaccine Info Percent of short-stay residents assessed and appropriately given the pneumococcal vaccine 95.5%
6% better than Texas average

Texas average: 90.4%

Antipsychotic medication increase Info Percent of short-stay residents who newly received an antipsychotic medication 2.9%
99% worse than Texas average

Texas average: 1.4%

Influenza Vaccine Info Percent of short-stay residents assessed and appropriately given the seasonal influenza vaccine 84.0%
5% worse than Texas average

Texas average: 88.0%

Re-hospitalized after SNF stay Info Percentage of short-stay residents who were re-hospitalized after their nursing home admission. 19.5%
25% better than Texas average

Texas average: 25.9%

Emergency department visits Info Percentage of short-stay residents who had an outpatient emergency department visit. 7.3%
39% better than Texas average

Texas average: 12.0%

Falls with major injury Info Percentage of SNF residents who experience falls with major injury during their stay. 0.0%
100% better than Texas average

Texas average: 0.8%

Ability to care for self at discharge Info Percentage of residents at or above expected ability to care for themselves at discharge. 42.9%
20% worse than Texas average

Texas average: 53.7%

Successful return to home or community Info Rate of successful return to home or community from a skilled nursing facility. 59.8%
18% better than Texas average

Texas average: 50.6%

Penalties and fines

Federal penalties imposed by CMS for regulatory violations, including civil money penalties (fines) and denials of payment for new Medicare/Medicaid admissions.

Source: CMS Penalties Database (Data as of Jan 2026)

Total fines amount $67K
17% lower than Texas average

Texas average: $80K

Number of fines 7
182% more fines than Texas average

Texas average: 2.5

Payment Denials Info Serious action where Medicare and/or Medicaid temporarily stops payments for new residents until issues are fixed. 0
100% fewer payment denials than Texas average

Texas average: 0.2

Fines amount comparison
This facility $67K
Texas average $80K
Penalty History

Penalties are imposed by CMS for violations of federal nursing home regulations.

Civil Money Penalty Info Fines imposed for noncompliance, which can be assessed per day or per instance of violation. Sep 19, 2024
$25K
Civil Money Penalty Info Fines imposed for noncompliance, which can be assessed per day or per instance of violation. Feb 12, 2024
$5K
Civil Money Penalty Info Fines imposed for noncompliance, which can be assessed per day or per instance of violation. Jan 22, 2024
$14K
Civil Money Penalty Info Fines imposed for noncompliance, which can be assessed per day or per instance of violation. Jan 8, 2024
$4K

Last updated: Jan 2026

Guides for Better Senior Living

Care Cost Calculator: See Prices in Your Area

Nursing Home Data Explorer

Don’t Wait Too Long: 7 Red Flag Signs Your Parent Needs Assisted Living Now

The True Cost of Assisted Living in 2025 – And How Families Are Paying For It

Understanding Senior Living Costs: Pricing Models, Discounts & Financial Assistance

Financial Aid for Texas Seniors

Get financial aid guidance

Community Care for the Aged and Disabled (CCAD)

TX Medicaid CCAD

Age 65+ or disabled, Texas resident, Medicaid-eligible, care need (not always nursing home level).

~$2,829/month (300% FBR, individual).

$2,000 (individual), $3,000 (couple).

Large state; rural access challenges.

Texas Community Care Services

TX CCS

Age 60+, Texas resident, at risk of decline.

~$2,000/month (individual, varies).

$5,000 (individual).

Limited funding; high demand in urban areas.

Area Agency on Aging (AAA) Services

Texas AAA Services

Age 60+, TX resident; no income/asset limits.

None; donations encouraged.

Not assessed.

28 AAAs; includes Meals on Wheels in some areas.

Medicare Savings Program (MSP)

Texas Medicare Savings Program

Age 65+ or disabled, TX resident, Medicare Part A/B.

~$2,510/month (QMB), ~$3,380/month (SLMB), ~$3,598/month (QI)—individual.

$9,430 (individual), $14,130 (couple).

Includes Extra Help for Part D; no waitlist.

Low-Income Home Energy Assistance Program (LIHEAP)

Texas Comprehensive Energy Assistance Program (CEAP)

Age 60+ prioritized, TX resident, low-income.

~$3,970/month (185% FPL).

Not assessed.

Priority for elderly/disabled; covers gas, electric, propane.

Family Caregiver Support Program (FCSP)

Texas Family Caregiver Support Program

Caregivers of 60+ needing care or 55+ caregivers of others; TX resident; 2+ ADLs.

No strict cap; prioritizes low-income (~$24,980/year).

Not assessed.

High rural demand; includes grandparent caregivers.

Senior Community Service Employment Program (SCSEP)

Texas SCSEP

Age 55+, unemployed, low-income, TX resident.

~$1,983/month (125% FPL).

Not specified.

Priority for veterans, rural residents; AARP partnership.

VA Aid and Attendance (A&A) and Housebound Benefits

Texas VA Aid and Attendance/Housebound

Age 65+ or disabled veteran/spouse, TX resident, wartime service, ADL help (A&A) or homebound.

Net income < ~$1,984/month (veteran with dependent, A&A); pension offsets income.

~$155,356 (net worth).

High veteran population; supports rural/urban needs.

Property Tax Exemption for Seniors

Texas Senior Property Tax Exemption

Age 65+, TX resident, homeowner (homestead).

None; tax-based eligibility.

Not assessed.

$25,000+ exemption; optional freeze in some counties; saves ~$500-$1,000/year.

Senior Farmers’ Market Nutrition Program (SFMNP)

Texas SFMNP

Age 60+, TX resident, low-income.

~$2,322/month (185% FPL).

Not assessed.

Vouchers (~$50/season); serves ~20,000 via 28 AAAs.