Occupancy rate
22%

We arrange tours, appointments, and even moving support so you don’t have to
Thank you for your interest!
Our team will be in touch shortly to help with next steps.
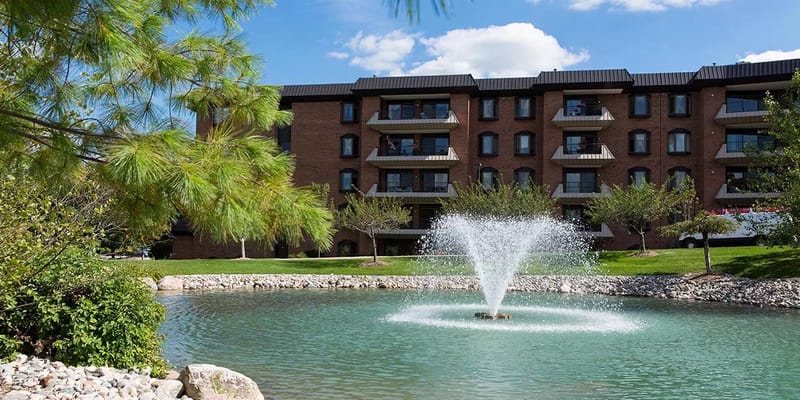
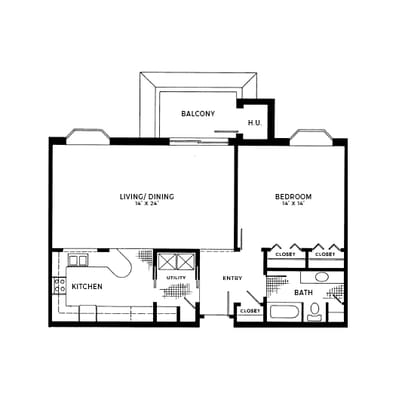


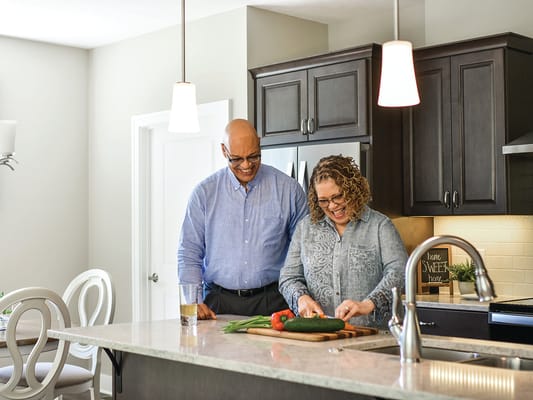

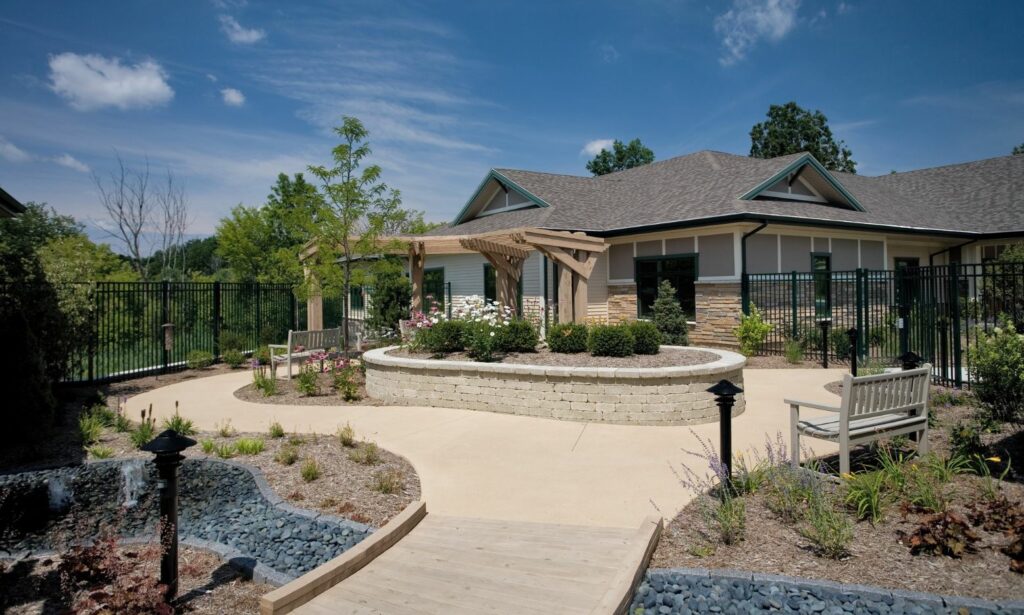
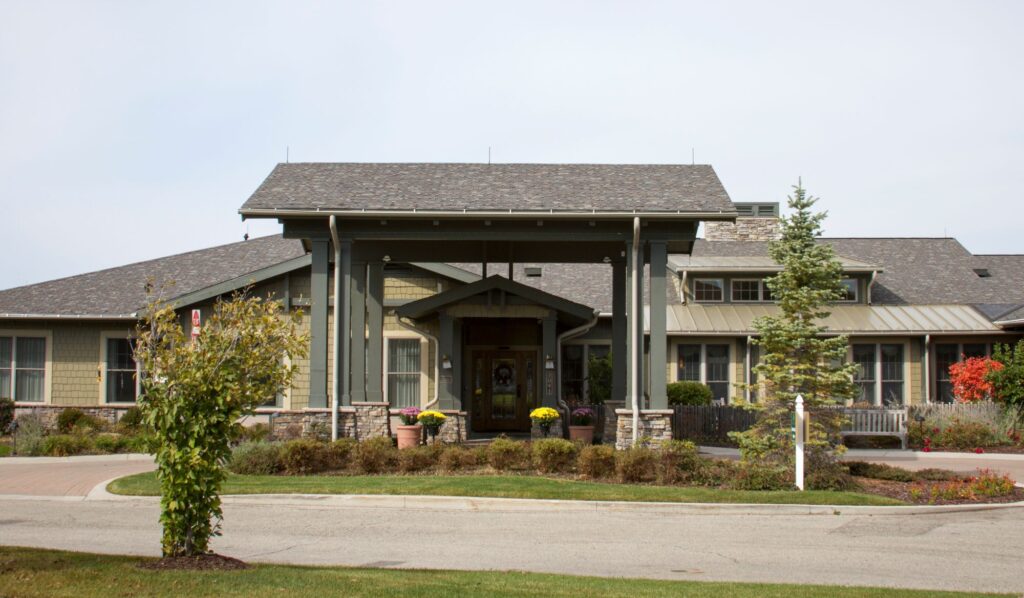
Holland Raybrook Campus offers independent living, assisted living, memory care, and skilled nursing where exceptional lifestyle is found. The award-winning non-profit community leads as the retirement home that improves the holistic wellness of each resident; they boast a nurturing and stimulating atmosphere that stimulates the mind, body, and spirit through social programs and spiritual activities. Holland Home strives in committing to providing service to its residents with Christ-like care.
The Raybrook residences of Holland Home provide a range of outing activities such as watching a musical or theater performance. They proudly house the William C. Buiten Wellness Center which is fully equipped with state-of-the-art machines. Other community amenities include a billiards room, a pool, and a library.
May provide extensive amenities, services and programs.
Lower occupancy suggests more openings may be available.
Residents typically stay for brief periods, with frequent admissions and discharges throughout the year.
20% of new residents, usually for short-term rehab.
75% of new residents, often for short stays.
6% of new residents, often for long-term daily care.
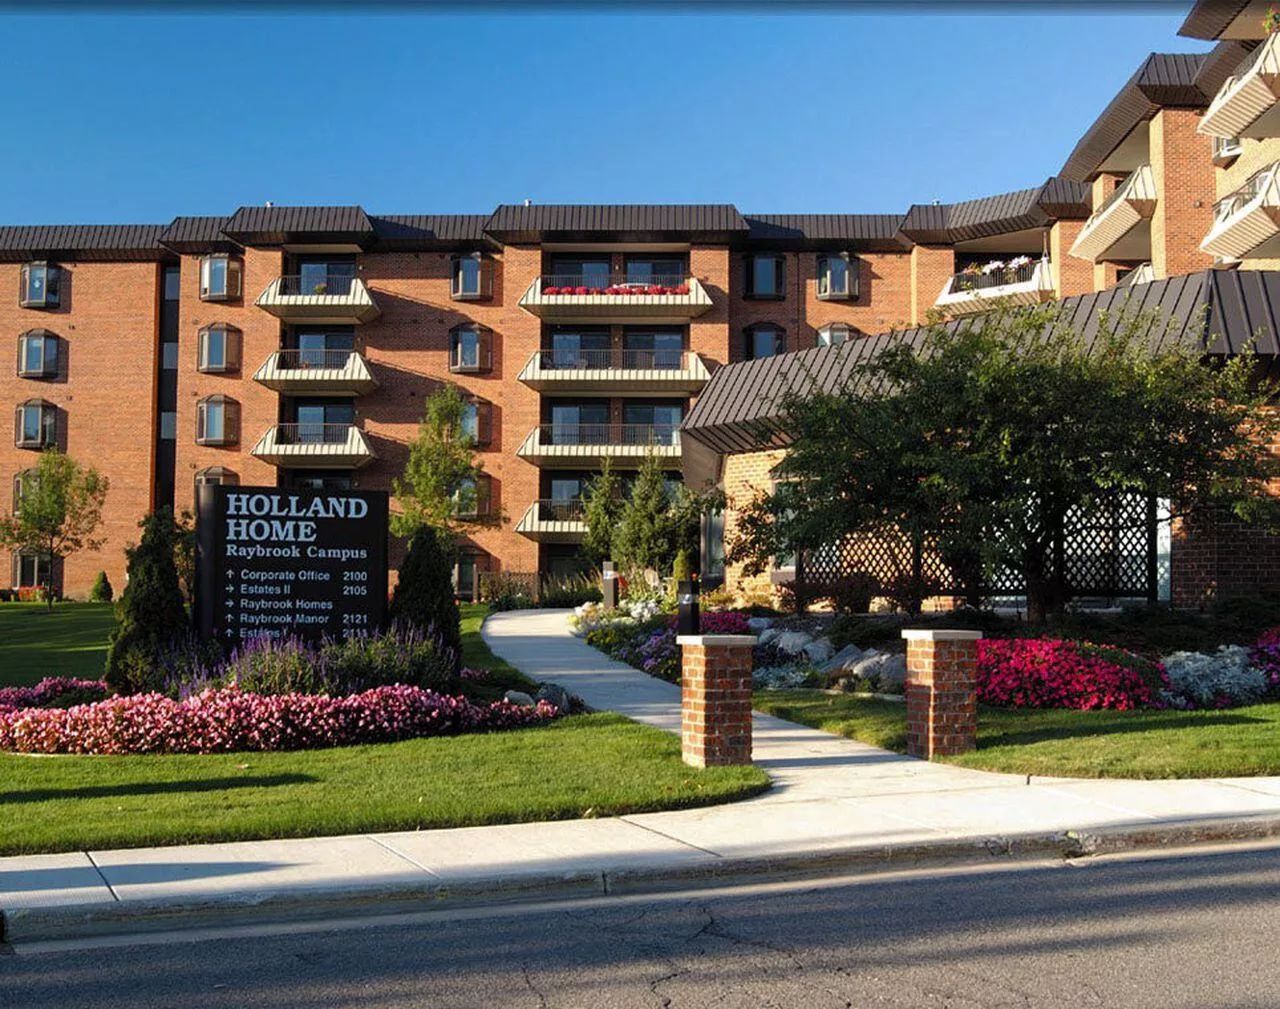
Holland Home Raybrook Campus is legally operated by Holland Home.
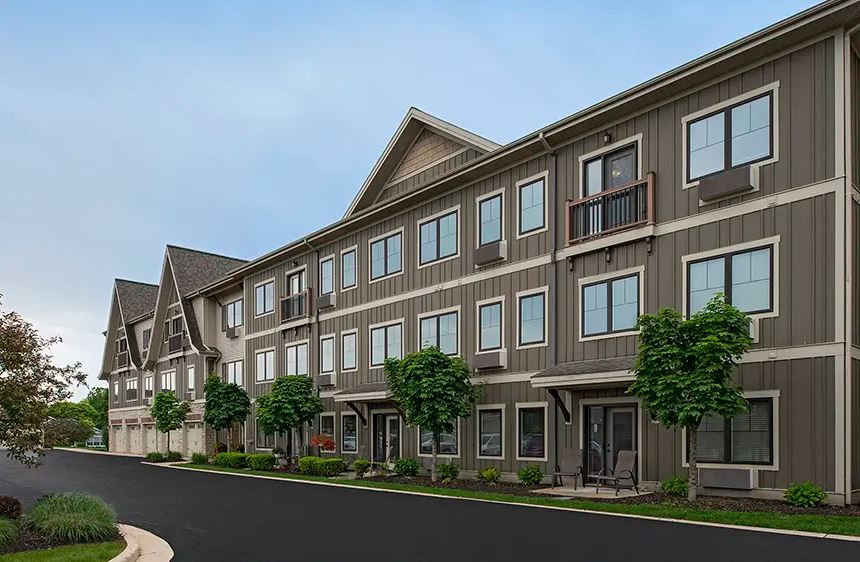
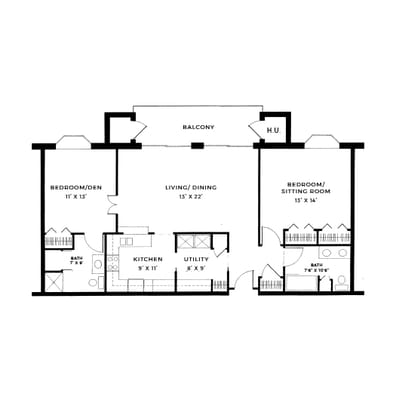
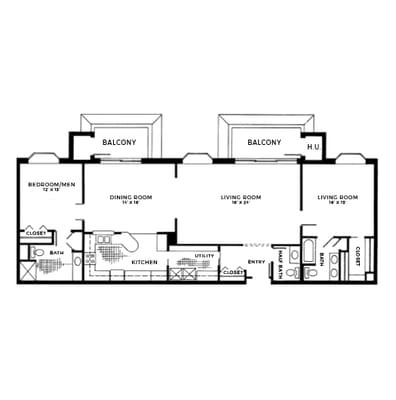
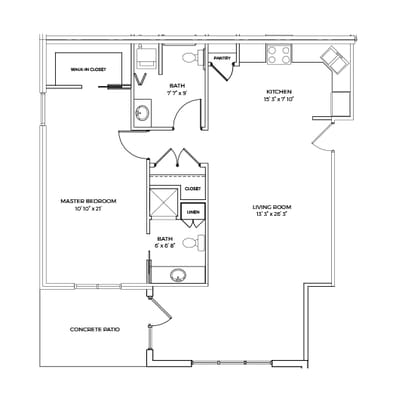
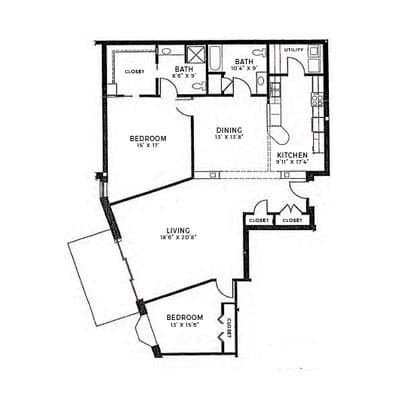
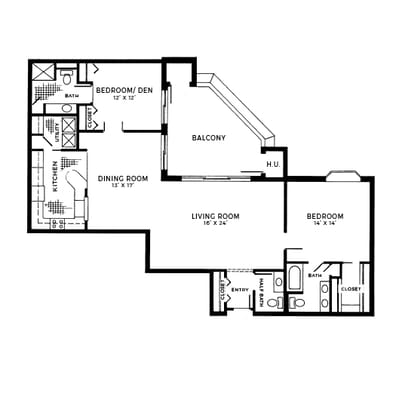
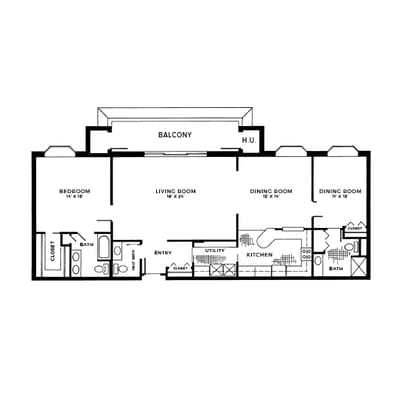
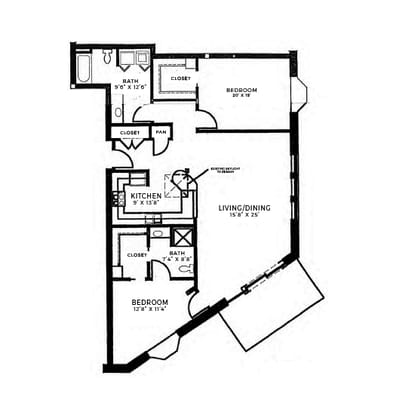
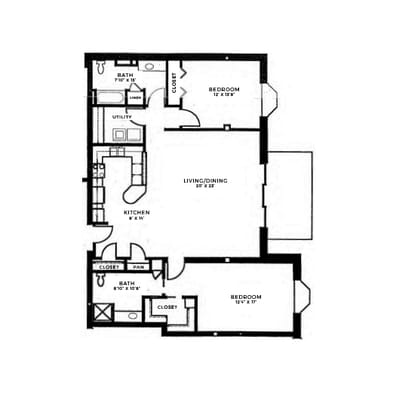
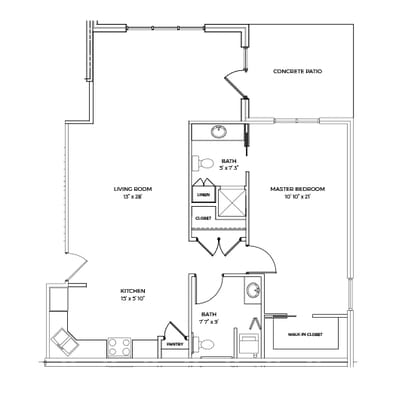
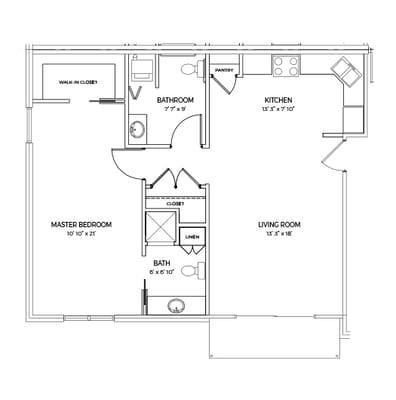
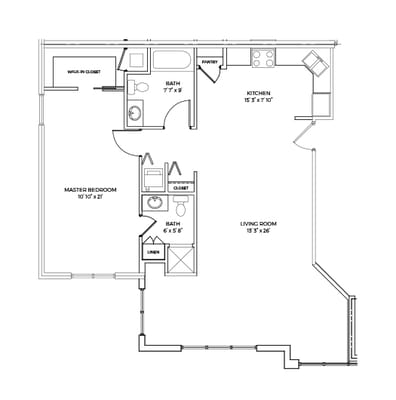
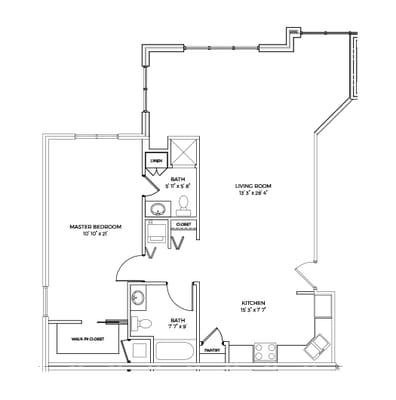
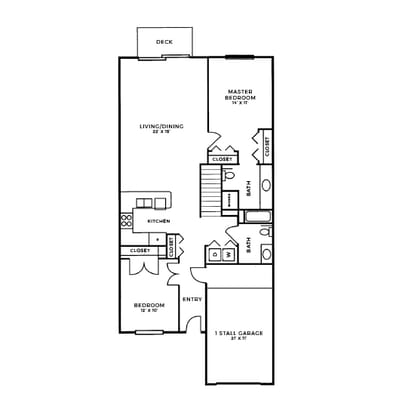
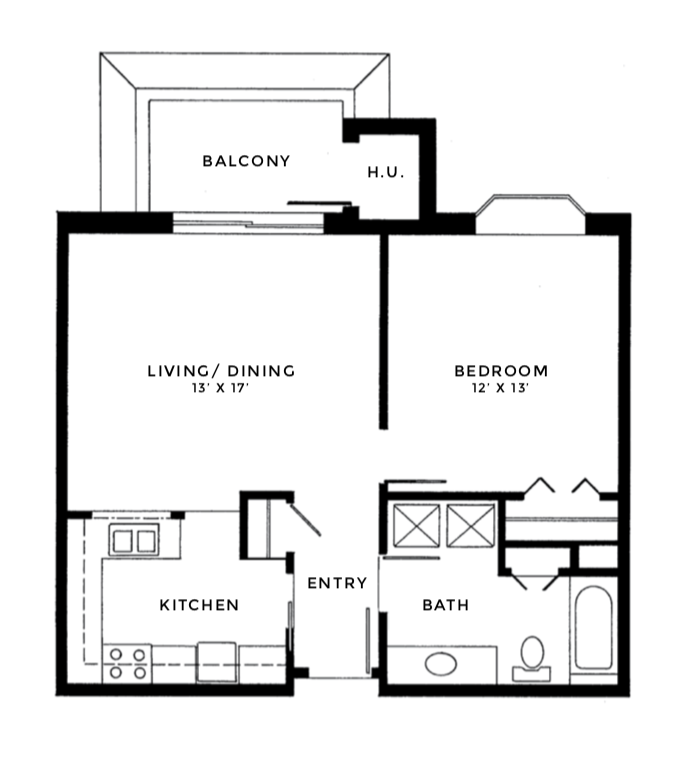
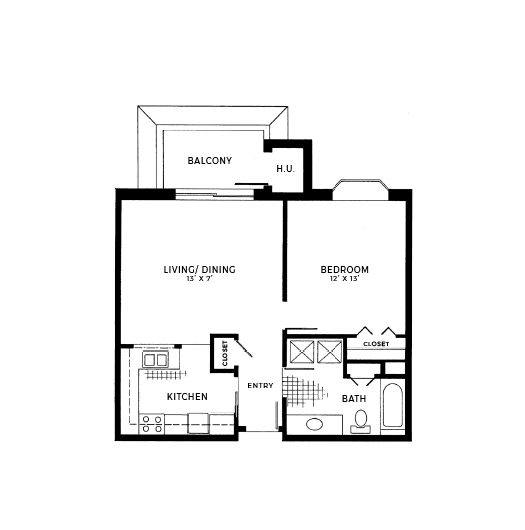
Building Type: Mid-rise
Fitness and Recreation
In Michigan, the Department of Licensing and Regulatory Affairs (LARA) conducts unannounced inspections and investigations to ensure long-term care facilities comply with state health codes.
Deficiencies indicate regulatory issues. A higher number implies the facility had several areas requiring improvement.
Michigan average: 8 deficiencies
Michigan average 6.5
Last Health inspection on Feb 2025
Michigan average 33.5
Michigan average 5.18
Health citations are formal notices following inspections when they fail to comply with safety and care standards.
17 of 21 citations resulted from standard inspections; 3 of 21 resulted from complaint investigations; and 1 of 21 came from combined inspections (standard and complaint).
Michigan average: 0.3
Michigan average: 1.9
Data sourced from CMS Health Deficiencies reports. Citation severity codes range from A (least serious) to L (most serious). Immediate Jeopardy (J-L) citations indicate situations where the facility's noncompliance has placed residents at risk of death or serious harm.
Assisted Living A licensed, long-term care setting for seniors or individuals with disabilities who need help with daily activities — like bathing, dressing, and medication management — but not 24-hour skilled nursing. Offers housing, meals, and around-the-clock support while aiming to maximize resident independence.
Independent Living Lifestyle-focused communities for older adults offering dining, activities, and transportation with minimal personal care. Best for active, independent seniors who want community without medical support.
Memory Care Secured, specialized care for people living with Alzheimer's or dementia. Staff trained in cognitive impairment, with higher staff-to-resident ratios and an environment designed to reduce confusion and wandering risk.
Nursing Home Licensed facility providing 24/7 skilled nursing care for residents with complex, ongoing medical needs. Staffed by RNs, LPNs, and CNAs. Inspected and star-rated annually by CMS. Accepts Medicare (short-term rehab) and Medicaid (long-term care).
Assisted Living A licensed, long-term care setting for seniors or individuals with disabilities who need help with daily activities — like bathing, dressing, and medication management — but not 24-hour skilled nursing. Offers housing, meals, and around-the-clock support while aiming to maximize resident independence.
Memory Care Secured, specialized care for people living with Alzheimer's or dementia. Staff trained in cognitive impairment, with higher staff-to-resident ratios and an environment designed to reduce confusion and wandering risk.
Assisted Living A licensed, long-term care setting for seniors or individuals with disabilities who need help with daily activities — like bathing, dressing, and medication management — but not 24-hour skilled nursing. Offers housing, meals, and around-the-clock support while aiming to maximize resident independence.
Assisted Living A licensed, long-term care setting for seniors or individuals with disabilities who need help with daily activities — like bathing, dressing, and medication management — but not 24-hour skilled nursing. Offers housing, meals, and around-the-clock support while aiming to maximize resident independence.
Home Care Professional care delivered in the person's own home — from companionship and errands to skilled nursing and therapy. Allows seniors to age in place. Medicare covers skilled home health when medically necessary.
Independent Living Lifestyle-focused communities for older adults offering dining, activities, and transportation with minimal personal care. Best for active, independent seniors who want community without medical support.
Memory Care Secured, specialized care for people living with Alzheimer's or dementia. Staff trained in cognitive impairment, with higher staff-to-resident ratios and an environment designed to reduce confusion and wandering risk.
Respite Care Short-term temporary care — days to weeks — to give family caregivers a break. Full care provided during the stay. Often used after hospitalization or to trial a facility before a permanent placement decision.

![]() 6.6 miles from city center — 0.98 miles to nearest hospital (Vet Center, Grand Rapids, Mi.)
6.6 miles from city center — 0.98 miles to nearest hospital (Vet Center, Grand Rapids, Mi.)
Add your location
This data corresponds to Q2 2025 and is based on CMS Payroll-Based Journal.
Michigan average ratio: 1.75:1
Michigan average: 7.9 hours
Manages medical care and health needs.
No contractors work on this role.
Assists with medical care and medications.
No contractors work on this role.
Helps with daily care and mobility.
No contractors work on this role.
Total hours from contractors
1,609 contractor hours this quarter
| Certified Nursing Assistant | 94 | 0 | 94 | 24,854 | 91 | 100% | 7.7 |
| Licensed Practical Nurse | 27 | 0 | 27 | 6,388 | 91 | 100% | 7.6 |
| Registered Nurse | 15 | 0 | 15 | 4,742 | 91 | 100% | 8.7 |
| Clinical Nurse Specialist | 6 | 0 | 6 | 2,320 | 64 | 70% | 8 |
| Other Dietary Services Staff | 8 | 0 | 8 | 1,645 | 82 | 90% | 7.3 |
| Other Social Services Staff | 1 | 0 | 1 | 539 | 68 | 75% | 7.9 |
| Mental Health Service Worker | 1 | 0 | 1 | 519 | 59 | 65% | 8.8 |
| Dental Services Staff | 1 | 0 | 1 | 511 | 57 | 63% | 9 |
| Respiratory Therapy Technician | 0 | 3 | 3 | 480 | 70 | 77% | 6.7 |
| Administrator | 1 | 0 | 1 | 472 | 59 | 65% | 8 |
| Nurse Practitioner | 1 | 0 | 1 | 472 | 59 | 65% | 8 |
| Qualified Social Worker | 0 | 1 | 1 | 462 | 61 | 67% | 7.6 |
| Physical Therapy Aide | 0 | 3 | 3 | 450 | 68 | 75% | 6.2 |
| Physical Therapy Assistant | 0 | 2 | 2 | 163 | 43 | 47% | 3.8 |
| Dietitian | 2 | 0 | 2 | 144 | 21 | 23% | 6.8 |
| Occupational Therapy Assistant | 0 | 1 | 1 | 32 | 8 | 9% | 4 |
| Medical Director | 0 | 1 | 1 | 12 | 12 | 13% | 1 |
| Speech Language Pathologist | 0 | 2 | 2 | 12 | 3 | 3% | 3.8 |
Source: CMS Long-Term Care Facility Characteristics (Data as of Jan 2026)
Residents meet regularly to discuss policies, care quality, and activities
Part of a Continuing Care Retirement Community offering multiple care levels
Organized group of residents that meets regularly to discuss facility policies, quality of life, and activities.
Data sourced from CMS Long-Term Care Facility Characteristics quarterly report. Payer mix reflects the current resident census by primary payment source.
These measures show how residents usually do over time at this home, based on health outcomes and preventive care.
Michigan average: 8.4
Michigan average: 16.3
Michigan average: 12.5%
Michigan average: 15.3%
Michigan average: 21.0%
Michigan average: 3.2%
Michigan average: 5.7%
Michigan average: 1.7%
Michigan average: 5.7%
Michigan average: 3.9%
Michigan average: 15.0%
Michigan average: 94.9%
Michigan average: 95.0%
Michigan average: 82.5%
Michigan average: 1.4%
Michigan average: 79.5%
Quality measures are calculated from Minimum Data Set (MDS) assessments. For most measures, lower percentages indicate better care quality.
Federal penalties imposed by CMS for regulatory violations, including civil money penalties (fines) and denials of payment for new Medicare/Medicaid admissions.
Source: CMS Penalties Database (Data as of Jan 2026)
Michigan average: $76K
Michigan average: 2.0
Michigan average: 0.8
Penalties are imposed by CMS for violations of federal nursing home regulations.
Last updated: Jan 2026
Historical financial and operational data for Holland Home Raybrook Campus based on CMS SNF Cost Reports.
Loading trend charts...
Care Cost Calculator: See Prices in Your Area
Nursing Home Data Explorer
Don’t Wait Too Long: 7 Red Flag Signs Your Parent Needs Assisted Living Now
The True Cost of Assisted Living in 2025 – And How Families Are Paying For It
Understanding Senior Living Costs: Pricing Models, Discounts & Financial Assistance

Touring a community? Use this expert-backed checklist to stay organized, ask the right questions, and find the perfect fit.
We'll send you a PDF version of the touring checklist.