


Kawabe Memorial House
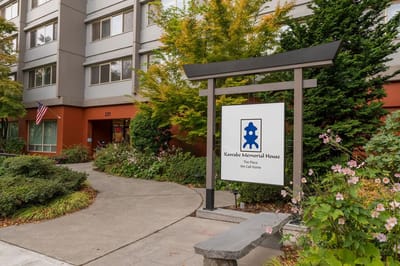

Kawabe Memorial House
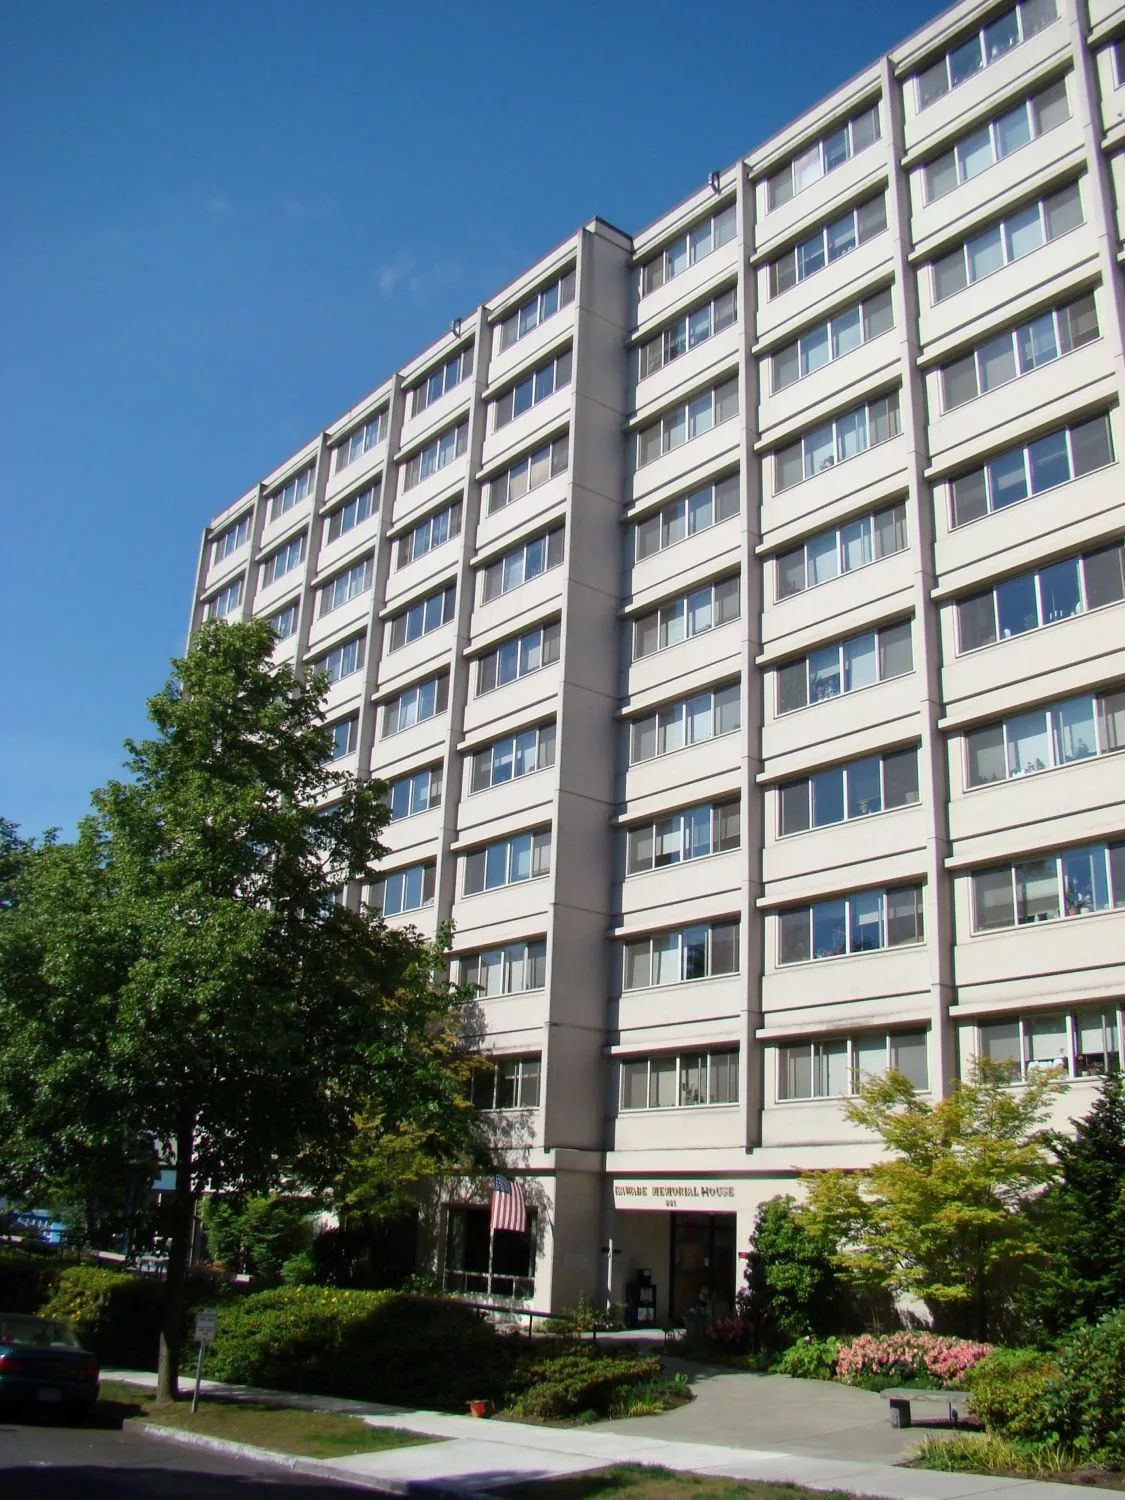
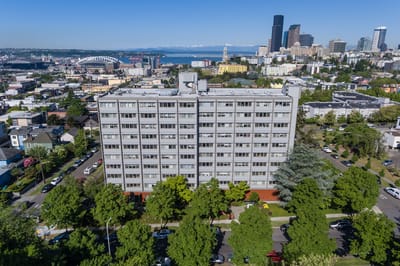
Welcome to Kawabe Memorial House, a thriving senior community established in 1969 by the descendants of Harry S. Kawabe. With a mission to provide secure and affordable housing for first-generation immigrant seniors, this ten-story building houses 174 residents, averaging 76 years of age. Located east of Seattle’s International District, the apartments offer stunning views of downtown, Elliott Bay, and the Cascades and Olympic Mountains. Kawabe Memorial House operates as a private non-profit organization, governed by a corporate Board of Directors.
Beyond independent living, the community provides a range of culturally sensitive services, including translation assistance in Japanese, Chinese, and Korean, and group recreational outings. Residents can partake in Tai Chi classes, bingo, and Shigin (Japanese singing). Moreover, the Asian menu inspired lunch program, which serves an average of 65 people daily, welcomes both residents and community members aged 60 and above, with menus translated into multiple languages. Kawabe Memorial House exemplifies the power of community involvement, as residents actively contribute to special projects. They raised $10,000 through bake sales and rummage sales for a garden restoration initiative. Additionally, an Arts grant facilitated the creation of sixteen postcards designed by an artist, showcasing residents’ life stories and translated captions in various languages. As part of the same project, residents recorded their narratives in their native languages, creating a captivating listening station within the premises. At Kawabe Memorial House, seniors find not only a safe and affordable place to live but also a close-knit community that cherishes their diverse backgrounds and fosters a sense of purpose and belonging.
Walk Score: 94 / 100 Rank #21 / 626Walk Score — State benchmarkedThis home is ranked 21st out of 626 homes in Washington for walk score. Shows how walkable this facility's neighborhood is compared to the average walk score across Washington facilities. Higher scores benefit residents, families, and staff.Facilities with the same value for a metric share the same rank. Rankings are based only on facilities in Washington that report data for that category. Facilities without available data are excluded from the ranking.Click the rank badge to see the full State ranking.Click here to see the full State ranking.
Walker's paradise. Daily errands do not require a car, with many shops and services nearby.
About this community
AccreditationsAging Services of Washington, Affordable Housing Management Association of Washington
Minimum Age62
Specific ProgramsCalligraphy, flower arranging, bingo, birthday parties, shigin (Japanese singing), computer center, Asian inspired lunch program, community classes and activities
Places of interest near Kawabe Memorial House
![]() 1.5 miles from city center
1.5 miles from city center
![]() Estimated distance in miles from Seattle's city center to Kawabe Memorial House's address, calculated via Google Maps.
— 0.43 miles to nearest hospital (Swedish)
Estimated distance in miles from Seattle's city center to Kawabe Memorial House's address, calculated via Google Maps.
— 0.43 miles to nearest hospital (Swedish)
Calculate Travel Distance to Kawabe Memorial House
Add your location
Financial Assistance for
Independent Living in Washington
Kawabe Memorial House is located in Seattle, Washington State.
Here are the financial assistance programs available to residents in Washington State.
Frequently Asked Questions about Kawabe Memorial House
What neighborhood is Kawabe Memorial House in?
Kawabe Memorial House is in the Central District neighborhood.
Is Kawabe Memorial House in a walkable area?
Kawabe Memorial House has a walk score of 94. Walker's paradise. Daily errands do not require a car, with many shops and services nearby.
Are pets allowed at Kawabe Memorial House?
No, Kawabe Memorial House has a no-pet policy.
Are there photos of Kawabe Memorial House?
Yes — there are 4 photos of Kawabe Memorial House in the photo gallery on this page.
What is the address of Kawabe Memorial House?
Kawabe Memorial House is located at 221 18Th Ave S, Seattle, WA 98144.
What is the phone number of Kawabe Memorial House?
(206) 322-4550 will put you in contact with the team at Kawabe Memorial House.
Does Kawabe Memorial House provide medical or personal care assistance?
No — Kawabe Memorial House is an independent living community. Residents live on their own in private apartments with access to amenities, dining, and social activities.
Guides for Better Senior Living
Updated on
