Facility type
Nursing Home

We arrange tours, appointments, and even moving support so you don’t have to
Thank you for your interest!
Our team will be in touch shortly to help with next steps.
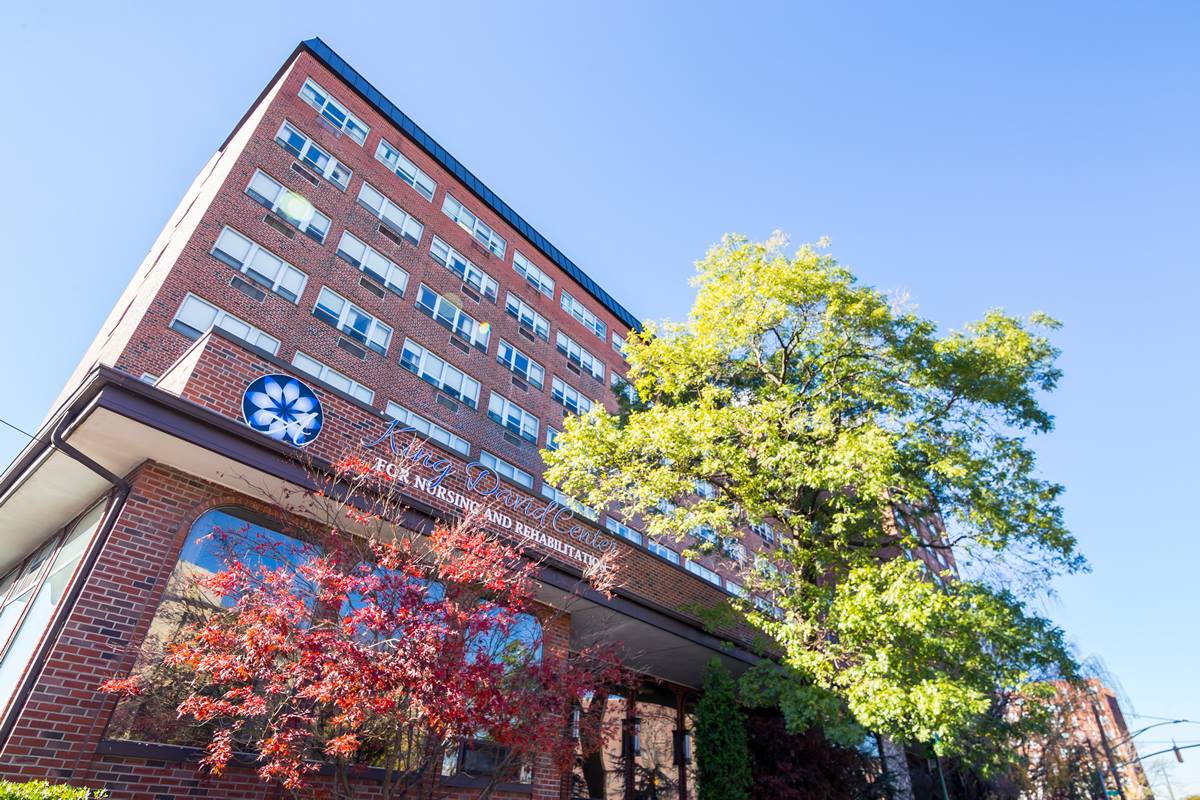
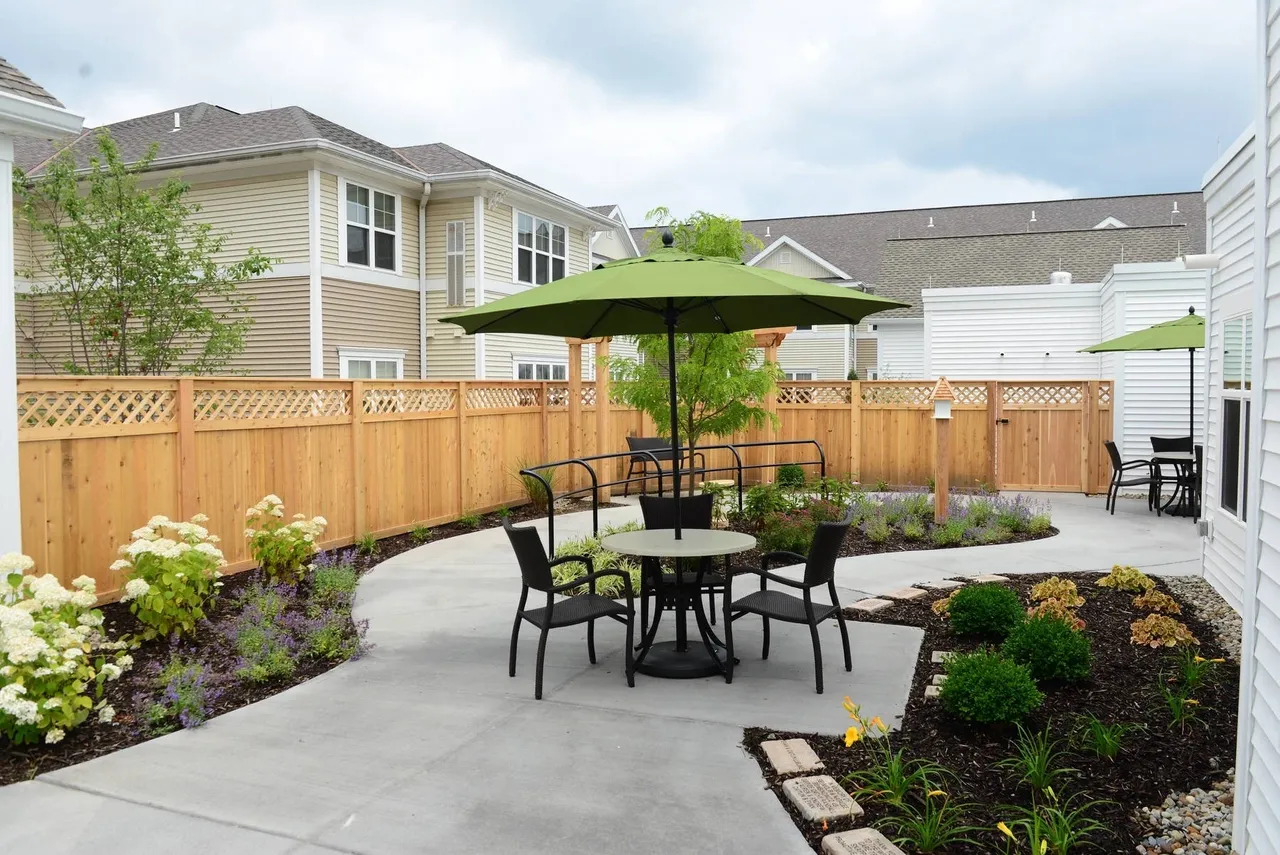

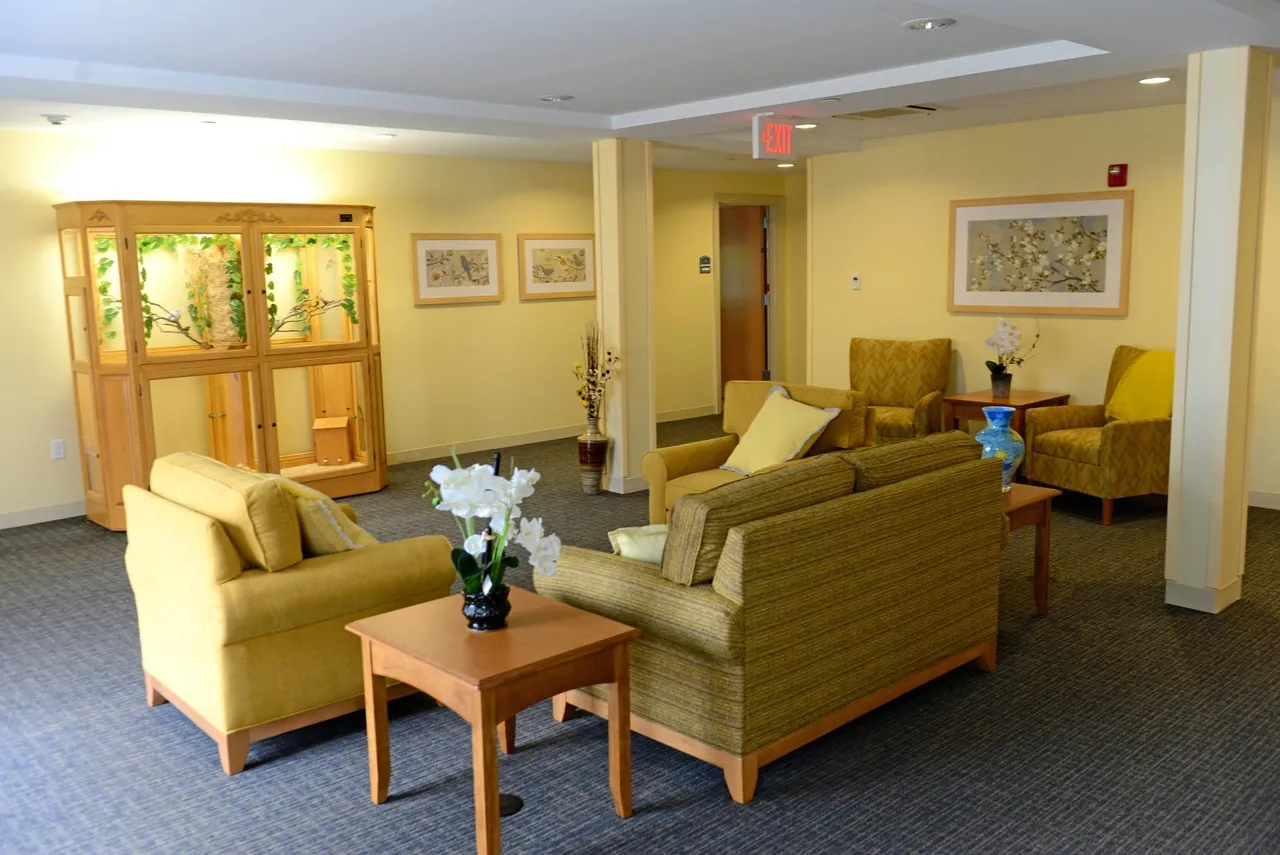
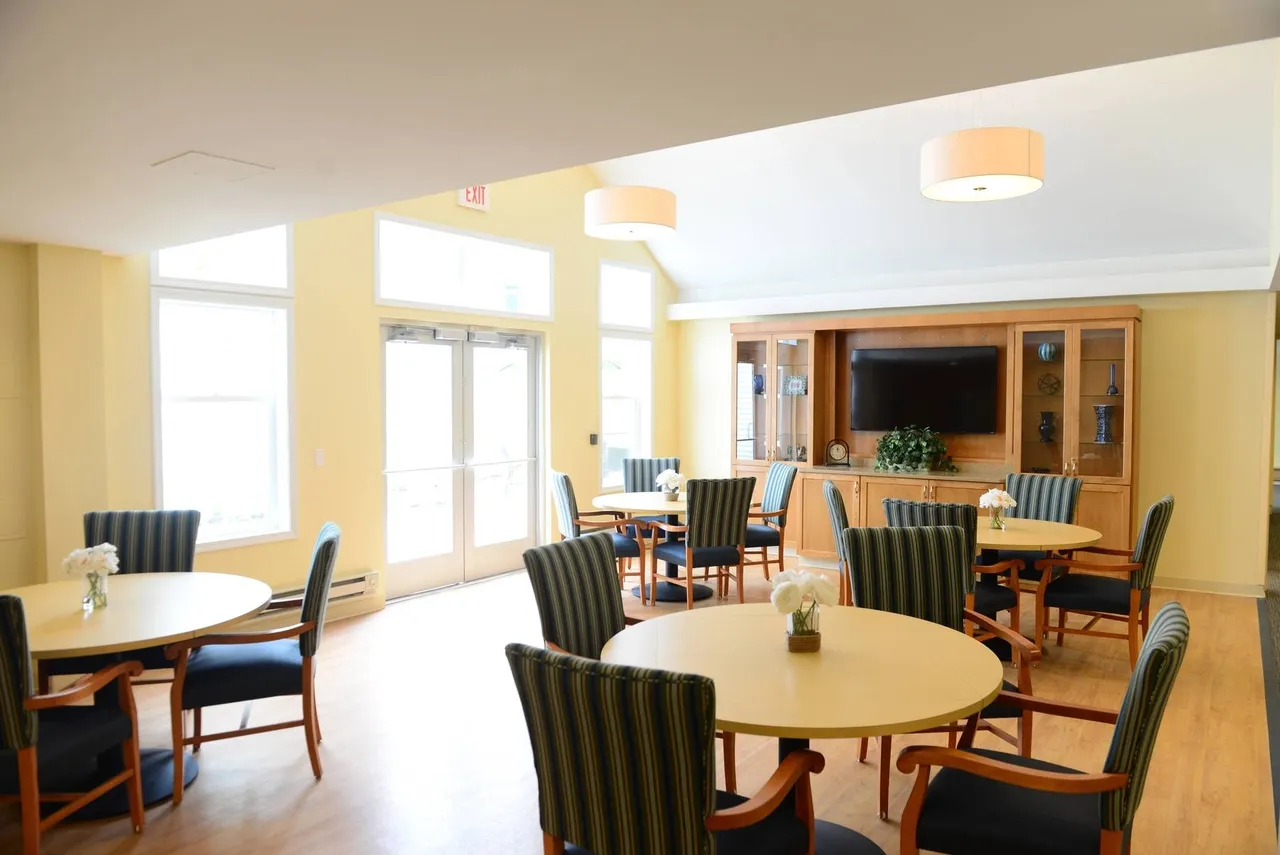
King David Center, located in Florida, is committed to enhancing the quality of life for its residents by creating a lively, safe, and inclusive community that promotes independence, wellness, and continuous learning. The center provides a range of residential options and healthcare services, including skilled nursing, independent living, assisted living, and memory care. In the Skilled Nursing Facility, the center delivers compassionate and expert care for individuals with complex medical needs, focusing on specialized, goal-oriented treatment plans to aid recovery and enhance independence.
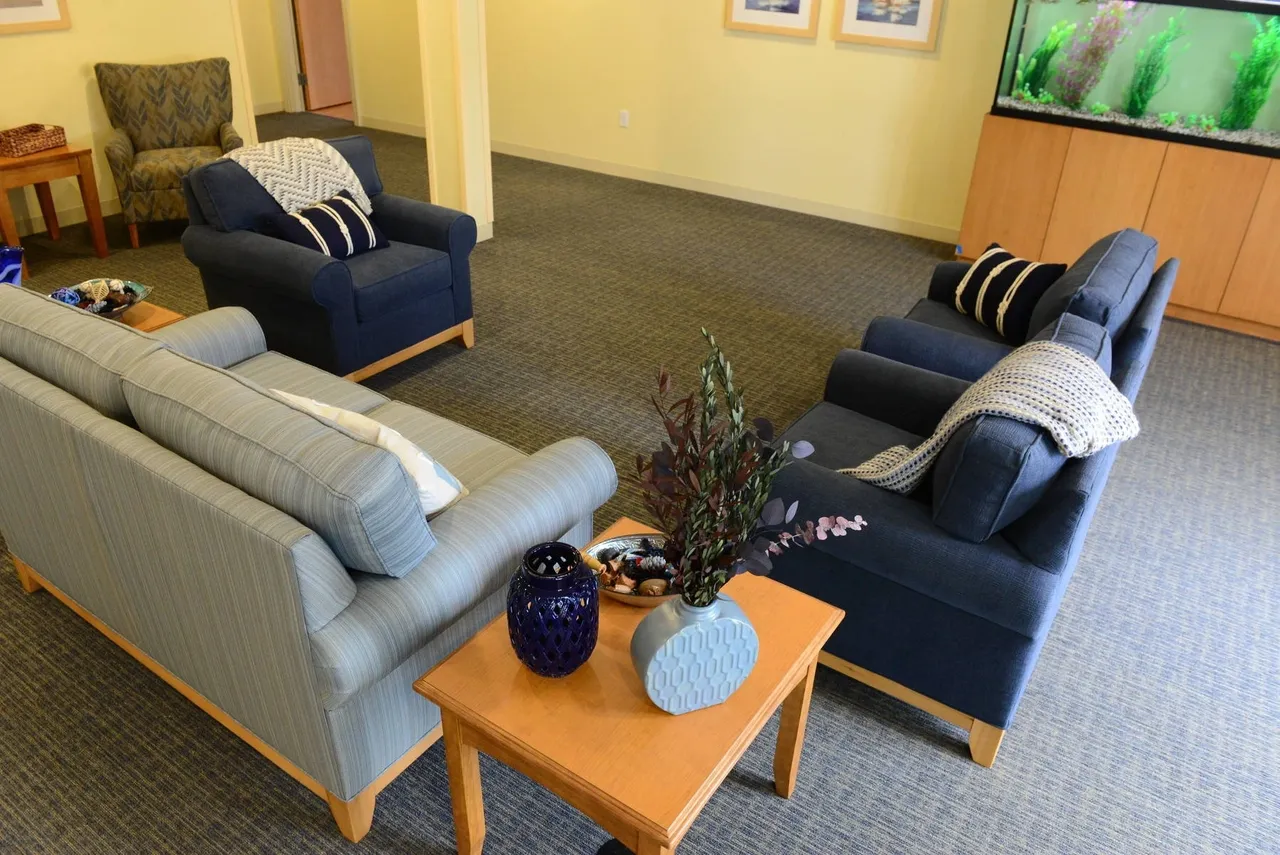
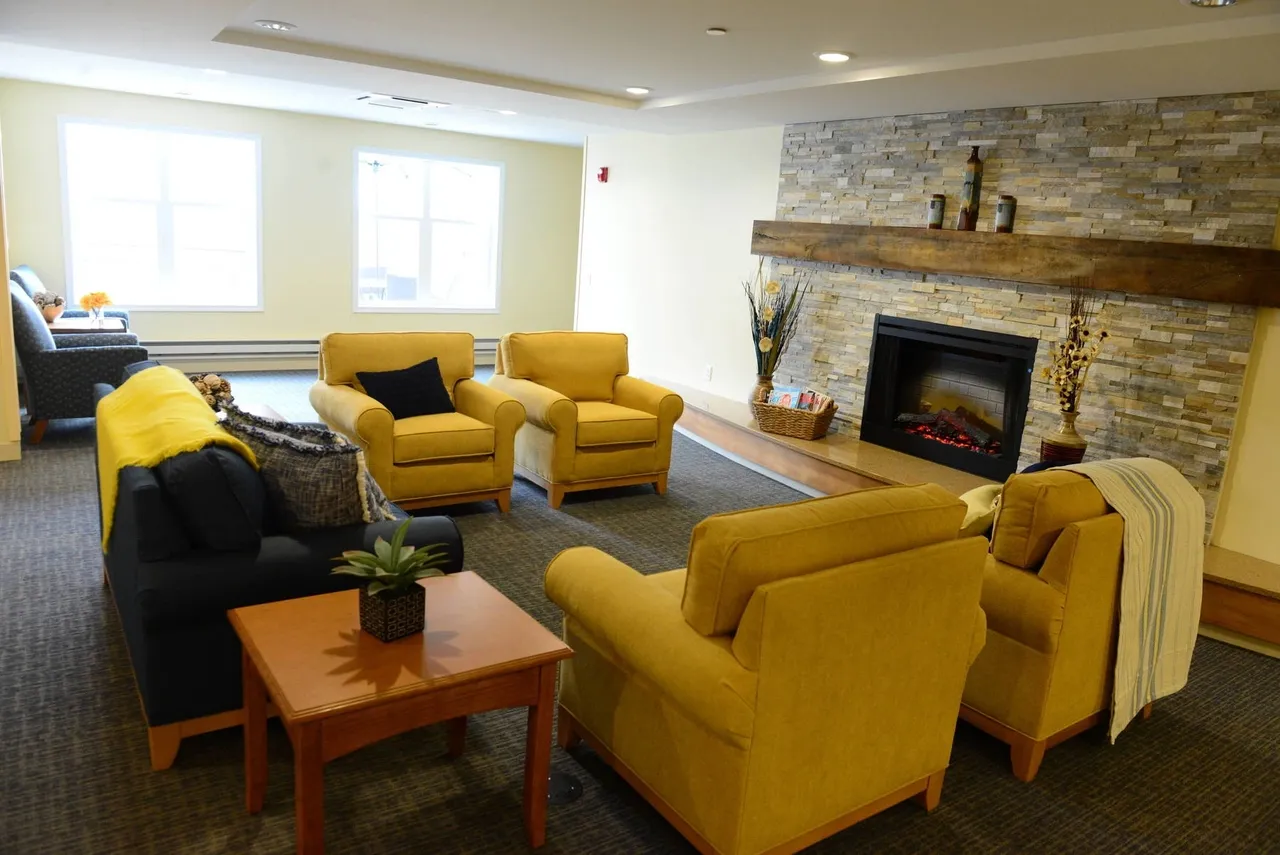
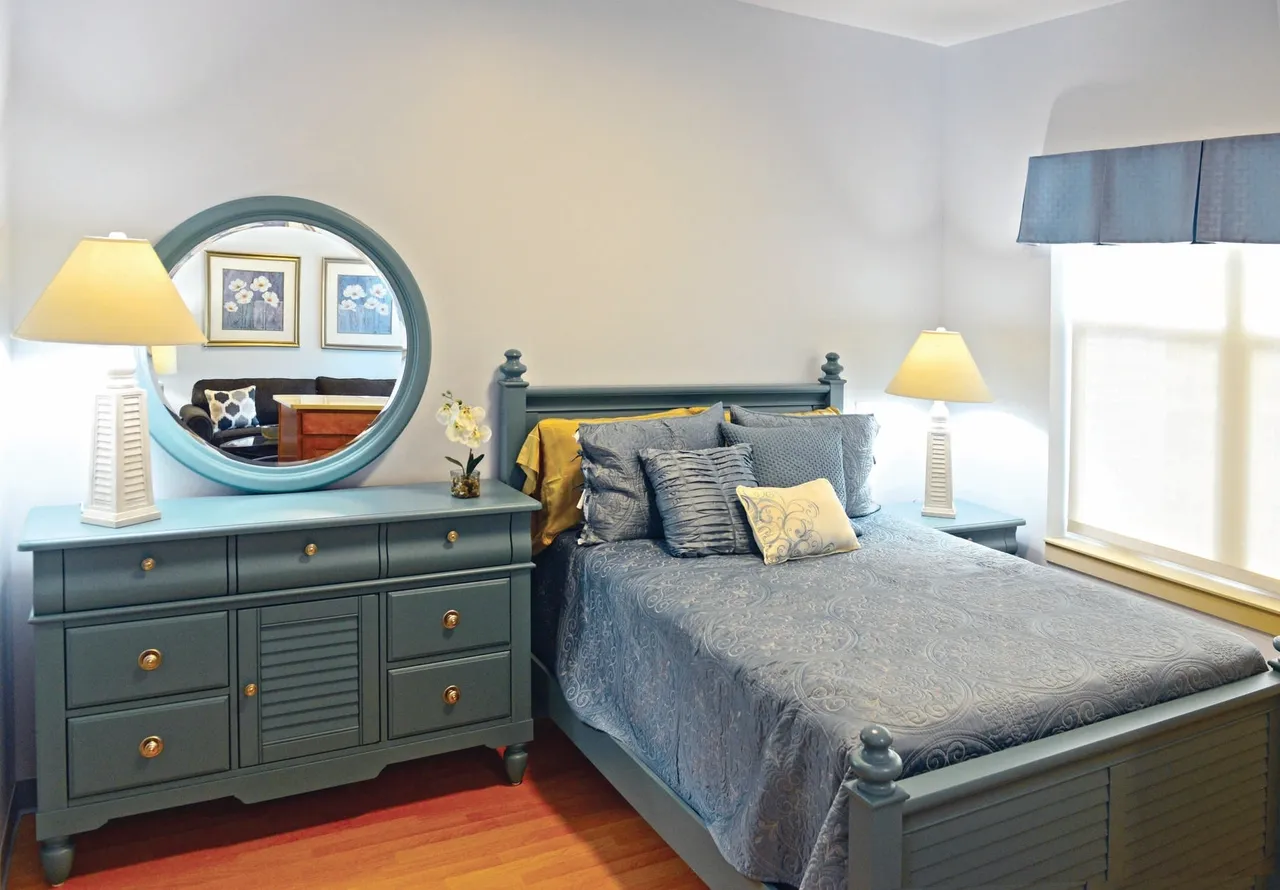
For those requiring long-term care, the nurturing environment fosters a sense of community and ensures a high quality of life. The center’s comprehensive services encompass skilled nursing, rehabilitative therapies, and compassionate assistance, all delivered with the utmost professionalism and warmth. Residents can enjoy a variety of amenities, such as a Speakeasy Lounge, creative arts center, and intergenerational activities, fostering a dynamic and engaging lifestyle.
May provide extensive amenities, services and programs.
That suggests steady demand, but availability may be limited.
This home supports both short-term rehab and long-term care, with residents staying for a wide range of durations.
50% of new residents, usually for short-term rehab.
49% of new residents, often for short stays.
1% of new residents, often for long-term daily care.
King David Center is legally operated by SGRNC, LLC (For Profit).
Minimum Age: 55
Building Type: Medium-high rise building
In New York, the Department of Health, Office of Aging and Long Term Care performs unannounced onsite inspections to monitor compliance with state and federal healthcare regulations.
2 with citations, 1 without citations
5 on-site complaint investigations
New York average: 9 inspections (5 with citations), 15 on-site complaint investigations
15 complaints per 100 occupied beds
New York average: 49.9 complaints per 100 occupied beds
Formal expressions of dissatisfaction or concern made by residents, or their families regarding various aspects of the care, services, and environment provided.
New York average: 93 complaints
Citations indicate regulatory violations. A higher number implies the facility had several areas requiring improvement.
New York average: 29 citations
New York average: 20 health citations
New York average: 4 life safety citations
Deficiencies indicate regulatory issues. A higher number implies the facility had several areas requiring improvement.
Penalties or interventions imposed by state regulators when facilities do not comply with quality, safety or regulatory standards.
New York average 3.6
Last Health inspection on Jan 2024
New York average 18.5
New York average 5.05
Health citations are formal notices following inspections when they fail to comply with safety and care standards.
19 of 20 citations resulted from standard inspections; and 1 of 20 came from combined inspections (standard and complaint).
New York average: 0.2
New York average: 0.2
Data sourced from CMS Health Deficiencies reports. Citation severity codes range from A (least serious) to L (most serious). Immediate Jeopardy (J-L) citations indicate situations where the facility's noncompliance has placed residents at risk of death or serious harm.
Nursing Home Licensed facility providing 24/7 skilled nursing care for residents with complex, ongoing medical needs. Staffed by RNs, LPNs, and CNAs. Inspected and star-rated annually by CMS. Accepts Medicare (short-term rehab) and Medicaid (long-term care).
Memory Care Secured, specialized care for people living with Alzheimer's or dementia. Staff trained in cognitive impairment, with higher staff-to-resident ratios and an environment designed to reduce confusion and wandering risk.
Nursing Home Licensed facility providing 24/7 skilled nursing care for residents with complex, ongoing medical needs. Staffed by RNs, LPNs, and CNAs. Inspected and star-rated annually by CMS. Accepts Medicare (short-term rehab) and Medicaid (long-term care).
Nursing Home Licensed facility providing 24/7 skilled nursing care for residents with complex, ongoing medical needs. Staffed by RNs, LPNs, and CNAs. Inspected and star-rated annually by CMS. Accepts Medicare (short-term rehab) and Medicaid (long-term care).
Home Care Professional care delivered in the person's own home — from companionship and errands to skilled nursing and therapy. Allows seniors to age in place. Medicare covers skilled home health when medically necessary.
Nursing Home Licensed facility providing 24/7 skilled nursing care for residents with complex, ongoing medical needs. Staffed by RNs, LPNs, and CNAs. Inspected and star-rated annually by CMS. Accepts Medicare (short-term rehab) and Medicaid (long-term care).
Nursing Home Licensed facility providing 24/7 skilled nursing care for residents with complex, ongoing medical needs. Staffed by RNs, LPNs, and CNAs. Inspected and star-rated annually by CMS. Accepts Medicare (short-term rehab) and Medicaid (long-term care).
![]() 11.8 miles from city center — 3.03 miles to nearest hospital (Maimonides Medical Center)
11.8 miles from city center — 3.03 miles to nearest hospital (Maimonides Medical Center)
![]() 2266 Cropsey Ave, Brooklyn, NY 11214
2266 Cropsey Ave, Brooklyn, NY 11214
Add your location
This data corresponds to Q2 2025 and is based on CMS Payroll-Based Journal.
New York average ratio: 0.18:1
New York average: 7.7 hours
Manages medical care and health needs.
This role is partially covered by contractors.
Assists with medical care and medications.
This role is partially covered by contractors.
Helps with daily care and mobility.
This role is partially covered by contractors.
Total hours from contractors
9,984 contractor hours this quarter
| Certified Nursing Assistant | 160 | 12 | 172 | 58,614 | 91 | 100% | 7.2 |
| Registered Nurse | 64 | 15 | 79 | 18,037 | 91 | 100% | 7.8 |
| Licensed Practical Nurse | 25 | 22 | 47 | 14,112 | 91 | 100% | 7.2 |
| Clinical Nurse Specialist | 8 | 1 | 9 | 3,840 | 67 | 74% | 8.4 |
| Other Dietary Services Staff | 12 | 0 | 12 | 3,639 | 91 | 100% | 7 |
| Dental Services Staff | 4 | 0 | 4 | 1,404 | 76 | 84% | 7.5 |
| Other Activities Staff | 4 | 0 | 4 | 1,056 | 91 | 100% | 11.5 |
| Administrator | 2 | 0 | 2 | 928 | 62 | 68% | 8 |
| Occupational Therapy Aide | 0 | 16 | 16 | 887 | 61 | 67% | 6.3 |
| Mental Health Service Worker | 1 | 0 | 1 | 480 | 60 | 66% | 8 |
| Dietitian | 1 | 0 | 1 | 472 | 59 | 65% | 8 |
| Nurse Practitioner | 2 | 0 | 2 | 386 | 46 | 51% | 8.4 |
| Occupational Therapy Assistant | 0 | 2 | 2 | 121 | 34 | 37% | 3.2 |
Source: CMS Long-Term Care Facility Characteristics (Data as of Jan 2026)
Residents meet regularly to discuss policies, care quality, and activities
Organized group of residents that meets regularly to discuss facility policies, quality of life, and activities.
Data sourced from CMS Long-Term Care Facility Characteristics quarterly report. Payer mix reflects the current resident census by primary payment source.
These measures show how residents usually do over time at this home, based on health outcomes and preventive care.
New York average: 9.8
New York average: 18.1
New York average: 16.4%
New York average: 16.6%
New York average: 21.4%
New York average: 3.0%
New York average: 7.2%
New York average: 1.4%
New York average: 6.1%
New York average: 18.1%
New York average: 12.6%
New York average: 91.4%
New York average: 95.2%
New York average: 1.71
New York average: 1.35
New York average: 76.6%
New York average: 1.3%
New York average: 78.8%
New York average: 20.6%
New York average: 9.7%
New York average: 0.8%
New York average: 53.7%
New York average: 50.6%
Quality measures are calculated from Minimum Data Set (MDS) assessments. For most measures, lower percentages indicate better care quality.
Historical financial and operational data for King David Center based on CMS SNF Cost Reports.
Loading trend charts...
Care Cost Calculator: See Prices in Your Area
Nursing Home Data Explorer
Don’t Wait Too Long: 7 Red Flag Signs Your Parent Needs Assisted Living Now
The True Cost of Assisted Living in 2025 – And How Families Are Paying For It
Understanding Senior Living Costs: Pricing Models, Discounts & Financial Assistance
Touring a community? Use this expert-backed checklist to stay organized, ask the right questions, and find the perfect fit.
We'll send you a PDF version of the touring checklist.