Explore Open Rooms
1 Contact details
2 What type of senior care service are you looking for?
3 What budget do you have in mind for senior care?
4 How soon do you need to find care?
5 Additional details

Thank you for your interest!

Our team will be in touch shortly to help with next steps.

Nursing Home in Pikesville

CMS overall rating Info The Overall CMS Rating combines results from health inspections, staffing levels and quality measures. Health inspections carry the most weight. Staffing and quality scores can increase or decrease the final rating based on performance compared to state and national standards.

King David Nursing and Rehabilitation Center

Overview of King David Nursing and Rehabilitation Center

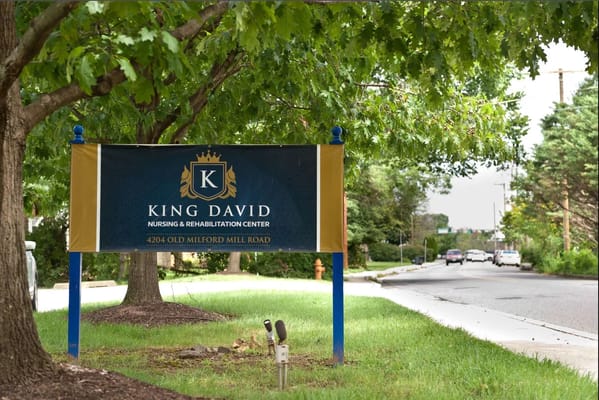
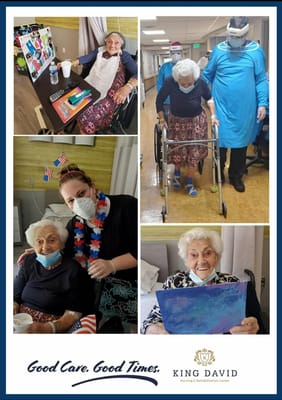
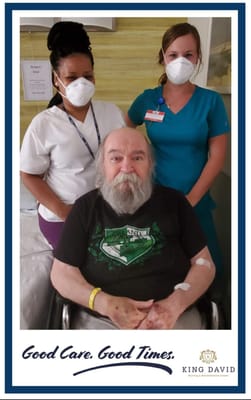
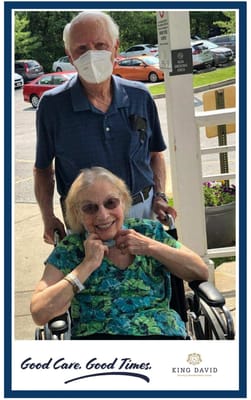
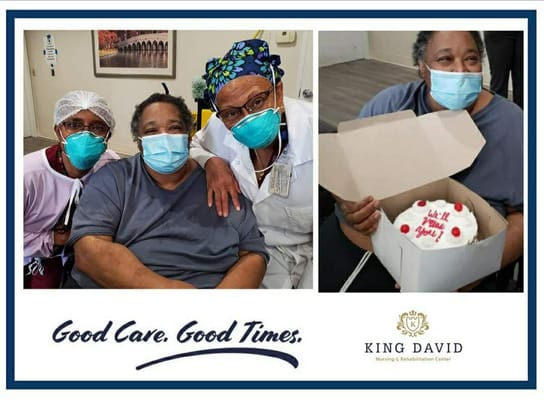
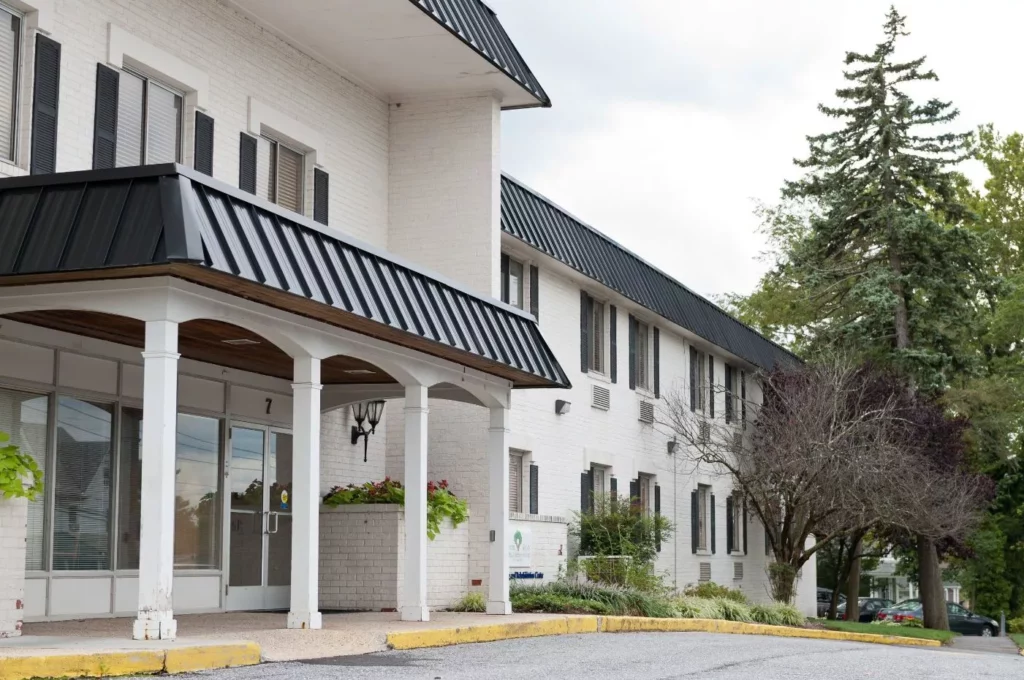
King David Nursing & Rehabilitation Center, an independently owned healthcare facility in Pikesville, Maryland, excels in providing top-notch nursing home care services. They accept various insurances, including Medicare, Medicaid, and private pay options, helping seniors navigate nursing home costs with ease.
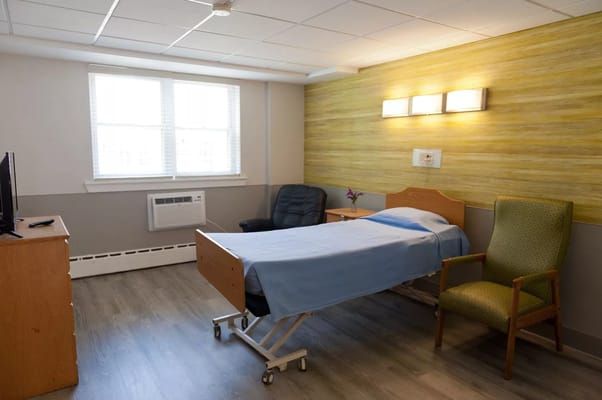
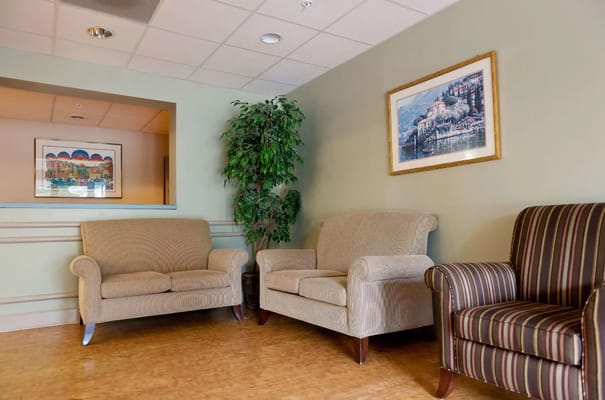
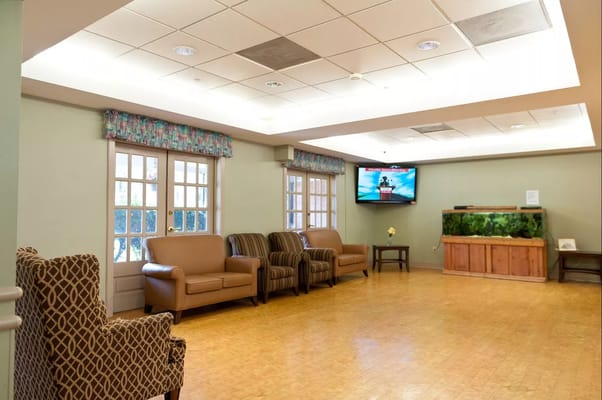
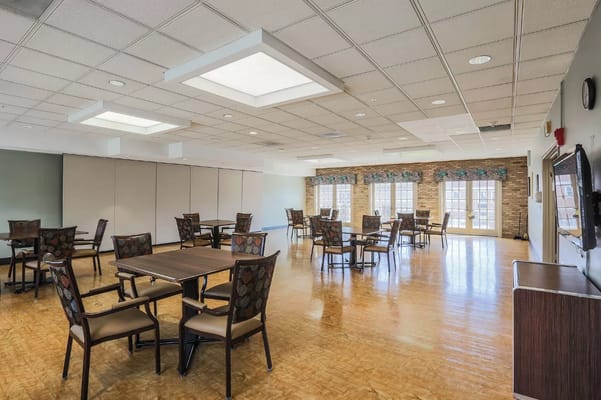
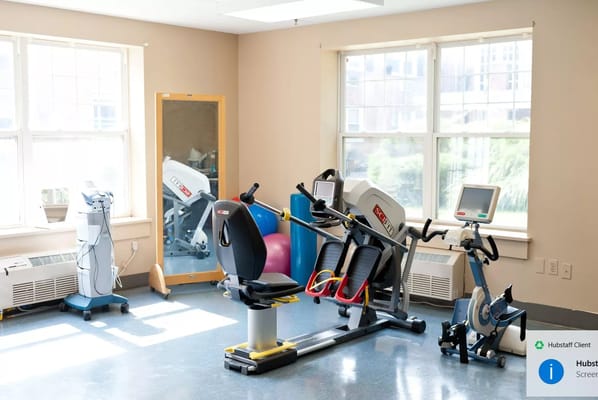
This facility also distinguishes itself with its impeccable cleanliness and elegant ambiance, offering seniors a secure and comfortable environment. With spacious lounges, it fosters socialization among residents, and their dining options cater to different tastes and dietary restrictions. This trusted abode provides a choice between private and semi-private rooms as well, all equipped with amenities like cable and Wi-Fi access. Moreover, it includes an on-site beauty salon and covers daily housekeeping and laundry services, ensuring a hassle-free experience within their nursing home facilities.

King David Nursing & Rehabilitation Center is an independently owned and operated healthcare center that is licensed to use the Autumn Lake Healthcare name and receive non-healthcare related services. All healthcare-related services are provided solely by King David Nursing & Rehabilitation Center.

Quality ratings

Measured by Centers for Medicare & Medicaid Services (CMS)

Overall rating Info The Overall CMS Rating combines results from health inspections, staffing levels and quality measures. Health inspections carry the most weight. Staffing and quality scores can increase or decrease the final rating based on performance compared to state and national standards.
3/5
Maryland average: 3.0/5
Health Inspection Info Based on the results of the facility's three most recent standard inspections and any complaint investigations. CMS reviews the number, scope, and severity of deficiencies, with more recent findings weighted more heavily.
3/5
Maryland average: 2.8/5
Staffing Info Measures average nursing staff hours per resident per day, including Registered Nurses (RNs) and total nursing staff. Ratings are adjusted based on the level of care residents require and are compared to state and national benchmarks.
2/5
Maryland average: 3.0/5
Quality Measures Info Based on clinical and physical health indicators reported to CMS, such as hospital readmissions, falls, pressure ulcers, and improvements in mobility. These measures reflect how well residents' health needs are being managed.
3/5
Maryland average: 3.7/5

Nursing care per resident

Info This shows how many total hours of nursing staff time are available per resident each day. Higher numbers usually mean more staff support.
3h 23m per day

This home provides 10% less nursing time per resident than the Maryland average.

Maryland average: 3h 46m per day

Staffing hours breakdown

Info Hours of care per resident per day, broken down by staff type. Data from CMS Medicare.
Staff type Facility State avg National avg
Registered Nurse (RN) Info Registered nurse hours per resident per day. 16m per day 50m per day 41m per day
Nurse Aide Info Nurse aide hours per resident per day. 2h 40m per day 2h 10m per day 2h 21m per day
Total Nursing (Weekend) Info Total number of nurse staff hours per resident per day on weekends. 3h 37m per day 3h 29m per day 3h 26m per day
Physical Therapist Info Physical therapist staff hours per resident per day. 9m per day 5m per day 4m per day
RN (Weekend) Info Registered nurse hours per resident per day on weekends. 8m per day 37m per day 29m per day

Capacity and availability

Medium-capacity home

Offers a balance of services and community atmosphere.

Total beds 110

This home usually has limited availability

Occupancy is moderate, suggesting balanced demand.

Similar demand to the Maryland average
Occupancy rate 88.8%
Residents per day (avg) 99
Occupancy rate
88.8%
Residents per day (avg)
99

Who this home usually serves

TYPE OF STAY

Mostly short-term rehab stays

Most residents typically stay for a few weeks or months before returning home or moving on.

Might be optimal for
Short stays Recovery Medicare-covered care

Breakdown by payment type

Medicare

56% of new residents, usually for short-term rehab.

Typical stay 1 - 2 months

Private pay

34% of new residents, often for short stays.

Typical stay 25 days

Medicaid

11% of new residents, often for long-term daily care.

Typical stay 1 years

Finances and operations

Privately-owned community
Operated by a business corporation.
Home revenue
$18.7M
Profit
$1.7M
Privately-owned community Operated by a business corporation.
Home revenue
$18.7M
Profit
$1.7M
Payroll costs Info The portion of the home's budget spent on staff, including nurses, caregivers, and other employees who support care and operations.
$2.0M
10.9% of revenue
Other operating costs Info All remaining costs needed to run the home, such as food, utilities, building maintenance, supplies and administrative expenses.
$15.0M
Total costs $17.0M
Walk Score
Walk Score: 72 / 100
Very walkable. Most errands can be accomplished on foot, and many essentials are within a short walk.

About this community

Payment & Insurance

2 services
Accept Medicaid
Accept Medicare

Therapy & Rehabilitation

2 services
Rehabilitation Services
Short-Term Rehab

Staffing & Medical

1 service
Skilled Nursing

Additional Services

1 service
Short-Term Rehabilitation

Amenities & Lifestyle

3 amenities
State-Of-The-Art Gym
Outdoor And Indoor Spaces For Socializing
Activities Schedule
Specific ProgramsShort-term Rehab, Long-term Living, Renowned Specialty Care
Religious ServicesYes

Pricing & Financial Information

Dining & Nutrition

Special DietsKosher

Types of Care at King David Nursing and Rehabilitation Center

Nursing Home Hospice Care Respite Care

Contact King David Nursing and Rehabilitation Center

Health Inspection History

Inspections
Total health inspections 4

Maryland average 3.9


Last Health inspection on Sep 2025

Total health citations 60

Maryland average 49.9

Citations per inspection
15

Maryland average 12.81


Health citations are formal notices following inspections when they fail to comply with safety and care standards.

45 of 60 citations resulted from standard inspections; 13 of 60 resulted from complaint investigations; and 2 of 60 came from combined inspections (standard and complaint).

Breakdown of citation severity (last 3 years)
Critical Health citations More info 0
100% better than Maryland average

Maryland average: 0.5


Serious Health citations More info 0
100% better than Maryland average

Maryland average: 0.6

0 critical citations More info Maryland average: 0.5

0 serious citations More info Maryland average: 0.6

60 moderate citations More info Maryland average: 47.2

0 minor citations More info Maryland average: 1.7
Citations history (last 3 years)
Abuse/Neglect moderate citation Info Issues related to protecting resident's from harm, including abuse, neglect, or mistreatment. Sep 18, 2025
Corrected

Abuse/Neglect moderate citation Info Issues related to protecting resident's from harm, including abuse, neglect, or mistreatment. Sep 18, 2025
Corrected

Environmental moderate citation Info Issues related to building safety, cleanliness, maintenance, and overall living conditions. Sep 18, 2025
Corrected

Quality of Care moderate citation Info Issues related to how well residents receive appropriate treatment and support for their medical and daily care needs. Sep 18, 2025
Corrected

Compare Nursing Homes around Pikesville The information below is reported by the Maryland Department of Health, Office of Health Care Quality.

3 facilities compared · CMS & MD Dept. of Health data · Updated Apr 2026

Filter by care type
King David Nursing and Rehabilitation Center
HC

Home Care Professional care delivered in the person's own home — from companionship and errands to skilled nursing and therapy. Allows seniors to age in place. Medicare covers skilled home health when medically necessary.

NH

Nursing Home Licensed facility providing 24/7 skilled nursing care for residents with complex, ongoing medical needs. Staffed by RNs, LPNs, and CNAs. Inspected and star-rated annually by CMS. Accepts Medicare (short-term rehab) and Medicaid (long-term care).

RC

Respite Care Short-term temporary care — days to weeks — to give family caregivers a break. Full care provided during the stay. Often used after hospitalization or to trial a facility before a permanent placement decision.

Pikesville
110
88.8%
+8%
3.39
-72%
-10%
0
60
15.0
0
99
72
4260 Group Llc
$18.6M
$2.0M
11%
215022
Autumn Lake Healthcare at Pikesville
HC

Home Care Professional care delivered in the person's own home — from companionship and errands to skilled nursing and therapy. Allows seniors to age in place. Medicare covers skilled home health when medically necessary.

NH

Nursing Home Licensed facility providing 24/7 skilled nursing care for residents with complex, ongoing medical needs. Staffed by RNs, LPNs, and CNAs. Inspected and star-rated annually by CMS. Accepts Medicare (short-term rehab) and Medicaid (long-term care).

RC

Respite Care Short-term temporary care — days to weeks — to give family caregivers a break. Full care provided during the stay. Often used after hospitalization or to trial a facility before a permanent placement decision.

Pikesville
140
81.1%
-2%
3.56
-32%
-6%
0
67
16.8
1
115
79
Pikesville Operator, Llc
$17.2M
$2.0M
11.5%
215082
Springhouse A ProMedica Senior Living Community
-
AL

Assisted Living A licensed, long-term care setting for seniors or individuals with disabilities who need help with daily activities — like bathing, dressing, and medication management — but not 24-hour skilled nursing. Offers housing, meals, and around-the-clock support while aiming to maximize resident independence.

IL

Independent Living Lifestyle-focused communities for older adults offering dining, activities, and transportation with minimal personal care. Best for active, independent seniors who want community without medical support.

MC

Memory Care Secured, specialized care for people living with Alzheimer's or dementia. Staff trained in cognitive impairment, with higher staff-to-resident ratios and an environment designed to reduce confusion and wandering risk.

NH

Nursing Home Licensed facility providing 24/7 skilled nursing care for residents with complex, ongoing medical needs. Staffed by RNs, LPNs, and CNAs. Inspected and star-rated annually by CMS. Accepts Medicare (short-term rehab) and Medicaid (long-term care).

Pikesville
105
-
-
-
-
-
-
-
-
0
0
0.0
0
-
39
Promedica Senior Care
-
-
-
-

Places of interest near King David Nursing and Rehabilitation Center

Address 1.1 miles from city center — 3.06 miles to nearest hospital (Dhaval Aghera, MD)

Calculate Travel Distance to King David Nursing and Rehabilitation Center

Add your location

Address

Staffing Data (Q2 2025)

This data corresponds to Q2 2025 and is based on CMS Payroll-Based Journal.

Total staff 135
Employees 109
Contractors 26
Staff to resident ratio 1.41:1
22% worse than Maryland average

Maryland average ratio: 1.81:1

Avg staff/day 59
Average shift 8.2 hours
0% compared with Maryland average

Maryland average: 8 hours

Total staff hours (quarter) 44,262
Nursing staff breakdown
Registered Nurse

Manages medical care and health needs.

Total count 5
Average shift length Info Average shift length. Calculated as total hours divided by days worked and average staff per day. 9.1 hours

No contractors work on this role.

Licensed Practical Nurse

Assists with medical care and medications.

Total count 25
Average shift length Info Average shift length. Calculated as total hours divided by days worked and average staff per day. 9.1 hours

No contractors work on this role.

Certified Nursing Assistant

Helps with daily care and mobility.

Total count 66
Average shift length Info Average shift length. Calculated as total hours divided by days worked and average staff per day. 8.2 hours

No contractors work on this role.

Contractor staffing

Total hours from contractors

12.4%

5,480 contractor hours this quarter

Respiratory Therapy Technician: 10 Qualified Social Worker: 5 Physical Therapy Assistant: 5 Physical Therapy Aide: 4 Speech Language Pathologist: 2
Staff by category
Certified Nursing Assistant 66 0 66 24,490 91 100% 8.2
Licensed Practical Nurse 25 0 25 8,089 91 100% 9.1
Respiratory Therapy Technician 0 10 10 1,560 90 99% 7.8
Registered Nurse 5 0 5 1,495 84 92% 9.1
Qualified Social Worker 0 5 5 1,041 73 80% 7
Physical Therapy Aide 0 4 4 1,034 77 85% 7.5
Physical Therapy Assistant 0 5 5 1,019 67 74% 7.6
Other Dietary Services Staff 4 0 4 928 81 89% 6.8
RN Director of Nursing 2 0 2 923 65 71% 7.5
Dietitian 2 0 2 877 76 84% 8.4
Speech Language Pathologist 0 2 2 826 66 73% 6.8
Clinical Nurse Specialist 2 0 2 547 72 79% 7.6
Nurse Practitioner 1 0 1 489 66 73% 7.4
Administrator 1 0 1 488 65 71% 7.5
Mental Health Service Worker 1 0 1 458 61 67% 7.5
66 Certified Nursing Assistant
% of Days 100%
25 Licensed Practical Nurse
% of Days 100%
10 Respiratory Therapy Technician
% of Days 99%
5 Registered Nurse
% of Days 92%
5 Qualified Social Worker
% of Days 80%
4 Physical Therapy Aide
% of Days 85%
5 Physical Therapy Assistant
% of Days 74%
4 Other Dietary Services Staff
% of Days 89%
2 RN Director of Nursing
% of Days 71%
2 Dietitian
% of Days 84%
2 Speech Language Pathologist
% of Days 73%
2 Clinical Nurse Specialist
% of Days 79%
1 Nurse Practitioner
% of Days 73%
1 Administrator
% of Days 71%
1 Mental Health Service Worker
% of Days 67%

Facility Characteristics

Source: CMS Long-Term Care Facility Characteristics (Data as of Jan 2026)

Total census
96 residents
Residents by payment source
Medicare
38 residents (39.6%)
Medicaid
58 residents (60.4%)
Programs & Services
Residents' Group

Residents meet regularly to discuss policies, care quality, and activities

Active Resident Council

Organized group of residents that meets regularly to discuss facility policies, quality of life, and activities.

Quality of care over time

These measures show how residents usually do over time at this home, based on health outcomes and preventive care.

High-risk clinical events score Info A composite score based on pressure ulcers, falls with injury, weight loss, walking ability decline, and activities of daily living decline. 15.7
21% worse than Maryland average

Maryland average: 12.9

Functional decline score Info A composite score based on activities of daily living decline, walking ability decline, and incontinence. 30.4
18% worse than Maryland average

Maryland average: 25.7

Long-stay resident measures
Average Maryland avg: 3.8 Info CMS star rating based on long-stay quality measure performance. 5 stars = significantly above average, 1 star = significantly below average.
Need for Help with Daily Activities Increased Info Percent of long-stay residents whose need for help with daily activities has increased 37.1%
57% worse than Maryland average

Maryland average: 23.7%

Walking Ability Worsened Info Percent of long-stay residents whose ability to move independently worsened 23.9%
14% better than Maryland average

Maryland average: 27.7%

Low Risk Residents with Bowel/Bladder Incontinence Info Percent of low risk long-stay residents who lose control of their bowels or bladder 30.1%
16% worse than Maryland average

Maryland average: 25.9%

Falls with Major Injury Info Percent of long-stay residents experiencing one or more falls with major injury 0.4%
85% better than Maryland average

Maryland average: 2.3%

High Risk Residents with Pressure Ulcers Info Percent of long-stay high risk residents with pressure ulcers 7.2%
10% worse than Maryland average

Maryland average: 6.5%

Urinary Tract Infection Info Percent of long-stay residents with a urinary tract infection 0.7%
56% better than Maryland average

Maryland average: 1.6%

Lost Too Much Weight Info Percent of long-stay residents who lose too much weight 9.9%
71% worse than Maryland average

Maryland average: 5.8%

Depressive Symptoms Info Percent of long-stay residents who have depressive symptoms 35.4%
75% worse than Maryland average

Maryland average: 20.2%

Antipsychotic Use Info Percent of long-stay residents who received an antipsychotic medication 11.0%
15% better than Maryland average

Maryland average: 12.9%

Pneumococcal Vaccine Info Percent of long-stay residents assessed and appropriately given the pneumococcal vaccine 100.0%
9% better than Maryland average

Maryland average: 92.0%

Influenza Vaccine Info Percent of long-stay residents assessed and appropriately given the seasonal influenza vaccine 100.0%
In line with Maryland average

Maryland average: 96.6%

Hospitalizations per 1,000 days Info Number of hospitalizations per 1,000 long-stay resident days. 2.05
55% worse than Maryland average

Maryland average: 1.32

ED visits per 1,000 days Info Number of outpatient emergency department visits per 1,000 long-stay resident days. 1.91
58% worse than Maryland average

Maryland average: 1.21

Short-stay resident measures
Significantly above average Maryland avg: 3.7 Info CMS star rating based on short-stay quality measure performance. 5 stars = much above average, 1 star = much below average.
Pneumococcal Vaccine Info Percent of short-stay residents assessed and appropriately given the pneumococcal vaccine 99.2%
26% better than Maryland average

Maryland average: 78.4%

Antipsychotic medication increase Info Percent of short-stay residents who newly received an antipsychotic medication 1.1%
22% better than Maryland average

Maryland average: 1.4%

Influenza Vaccine Info Percent of short-stay residents assessed and appropriately given the seasonal influenza vaccine 99.4%
23% better than Maryland average

Maryland average: 80.6%

Re-hospitalized after SNF stay Info Percentage of short-stay residents who were re-hospitalized after their nursing home admission. 26.0%
23% worse than Maryland average

Maryland average: 21.2%

Emergency department visits Info Percentage of short-stay residents who had an outpatient emergency department visit. 6.3%
36% better than Maryland average

Maryland average: 9.9%

Falls with major injury Info Percentage of SNF residents who experience falls with major injury during their stay. 1.3%
71% worse than Maryland average

Maryland average: 0.8%

Ability to care for self at discharge Info Percentage of residents at or above expected ability to care for themselves at discharge. 57.1%
6% better than Maryland average

Maryland average: 53.7%

Successful return to home or community Info Rate of successful return to home or community from a skilled nursing facility. 58.3%
15% better than Maryland average

Maryland average: 50.6%

Guides for Better Senior Living

Care Cost Calculator: See Prices in Your Area

Nursing Home Data Explorer

Don’t Wait Too Long: 7 Red Flag Signs Your Parent Needs Assisted Living Now

The True Cost of Assisted Living in 2025 – And How Families Are Paying For It

Understanding Senior Living Costs: Pricing Models, Discounts & Financial Assistance

Financial Aid for Maryland Seniors

Get financial aid guidance

Community Options Waiver

Maryland Medicaid Community Options Waiver

Age 65+ or disabled, Maryland resident, Medicaid- eligible, nursing home-level care need.

~$2,829/month (300% FBR, individual).

$2,000 (individual), $3,000 (couple) (excludes home, car).

High urban demand; rural outreach efforts.

Senior Care Program

Maryland Senior Care

Age 65+, Maryland resident, at risk of nursing home placement.

~$2,000/month (individual, varies by county).

$11,000 (individual).

Limited funding; waitlists common in high-demand areas.

Maryland Nursing Home Medicaid

Maryland Medical Assistance (Medicaid) Nursing Home Program

Age 65+, Maryland resident, Medicaid-eligible, requires nursing home-level care.

$943/month (individual); most income applied to care costs.

$2,500 (individual), $3,000 (couple); spousal protections up to $155,356.

Home equity limit $636,000; estate recovery applies post-55.

Senior Assisted Living Subsidy Program

Maryland Senior Assisted Living Group Home Subsidy

Age 62+, Maryland resident, in or moving to approved assisted living, low/moderate income.

~$34,000/year (individual, varies by county).

Not strict; prioritizes low-income.

Not available statewide; facility must be licensed by MDH.

Veterans Aid and Attendance (A&A) Benefit

Maryland VA Aid and Attendance

Wartime veteran/spouse, age 65+ or disabled, needs ADL help, Maryland resident.

Net income minus medical expenses < $1,984/month (individual with A&A).

$155,356 (net worth limit).

High veteran population in suburban/rural areas.

Senior Prescription Drug Assistance Program (SPDAP)

Maryland Senior Prescription Drug Assistance Program

Age 65+, Maryland resident (6+ months), Medicare Part D enrolled.

$48,560/year (individual, 300% FPL).

None specified.

Supplements Medicare Part D; annual enrollment required.

Medicare Savings Programs (MSP)

Maryland Medicare Savings Programs

Age 65+, Maryland resident, Medicare Part A/B enrollee.

$2,014/month (QMB), $2,706/month (SLMB/QI, individual).

$9,090 (individual), $13,630 (couple).

Includes QMB, SLMB, QI categories.

Community Personal Assistance Services (CPAS)

Maryland Medicaid Community Personal Assistance Services

Age 65+, Maryland resident, Medicaid-eligible, needs ADL assistance.

$943/month (individual); spend-down available.

$2,500 (individual), $3,000 (couple).

Consumer-directed option allows hiring family caregivers.