Nursing Home

Lake Bennet Center for Rehabilitation and Healing

Nursing Home

Lake Bennet Center for Rehabilitation and Healing

1091 Kelton Ave, Ocoee, FL 34761 View map
Overview of Lake Bennet Center for Rehabilitation and Healing

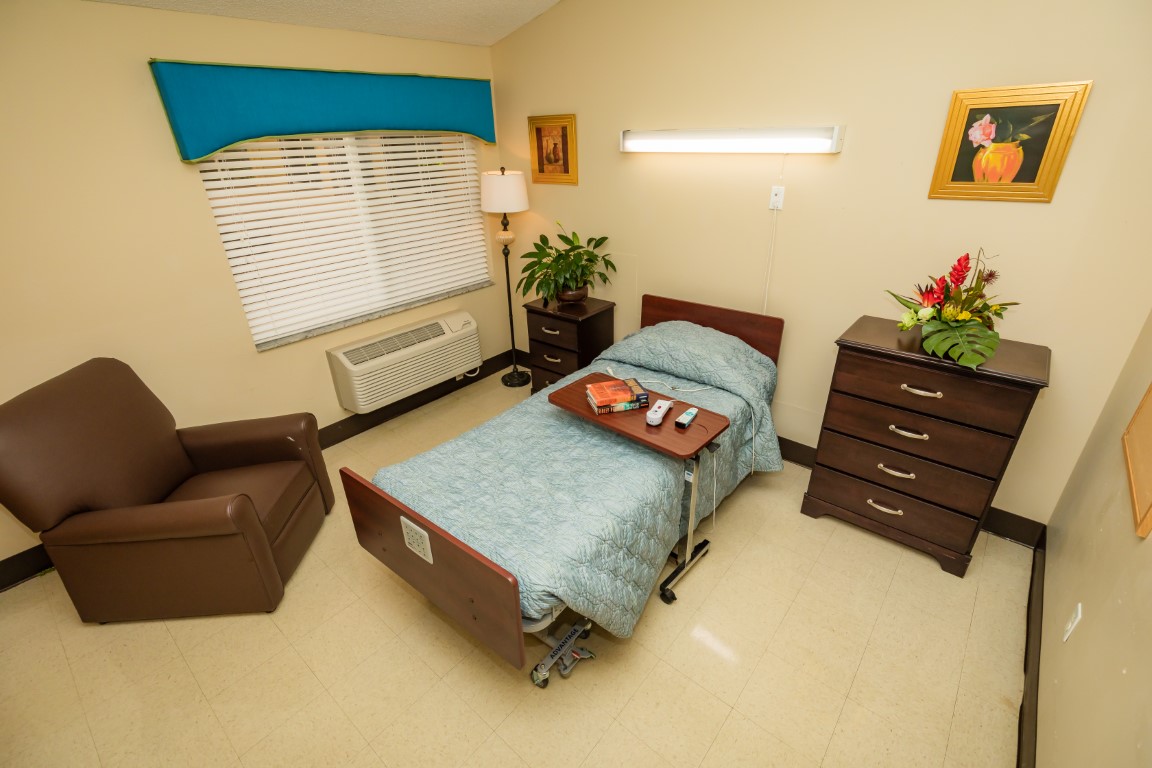
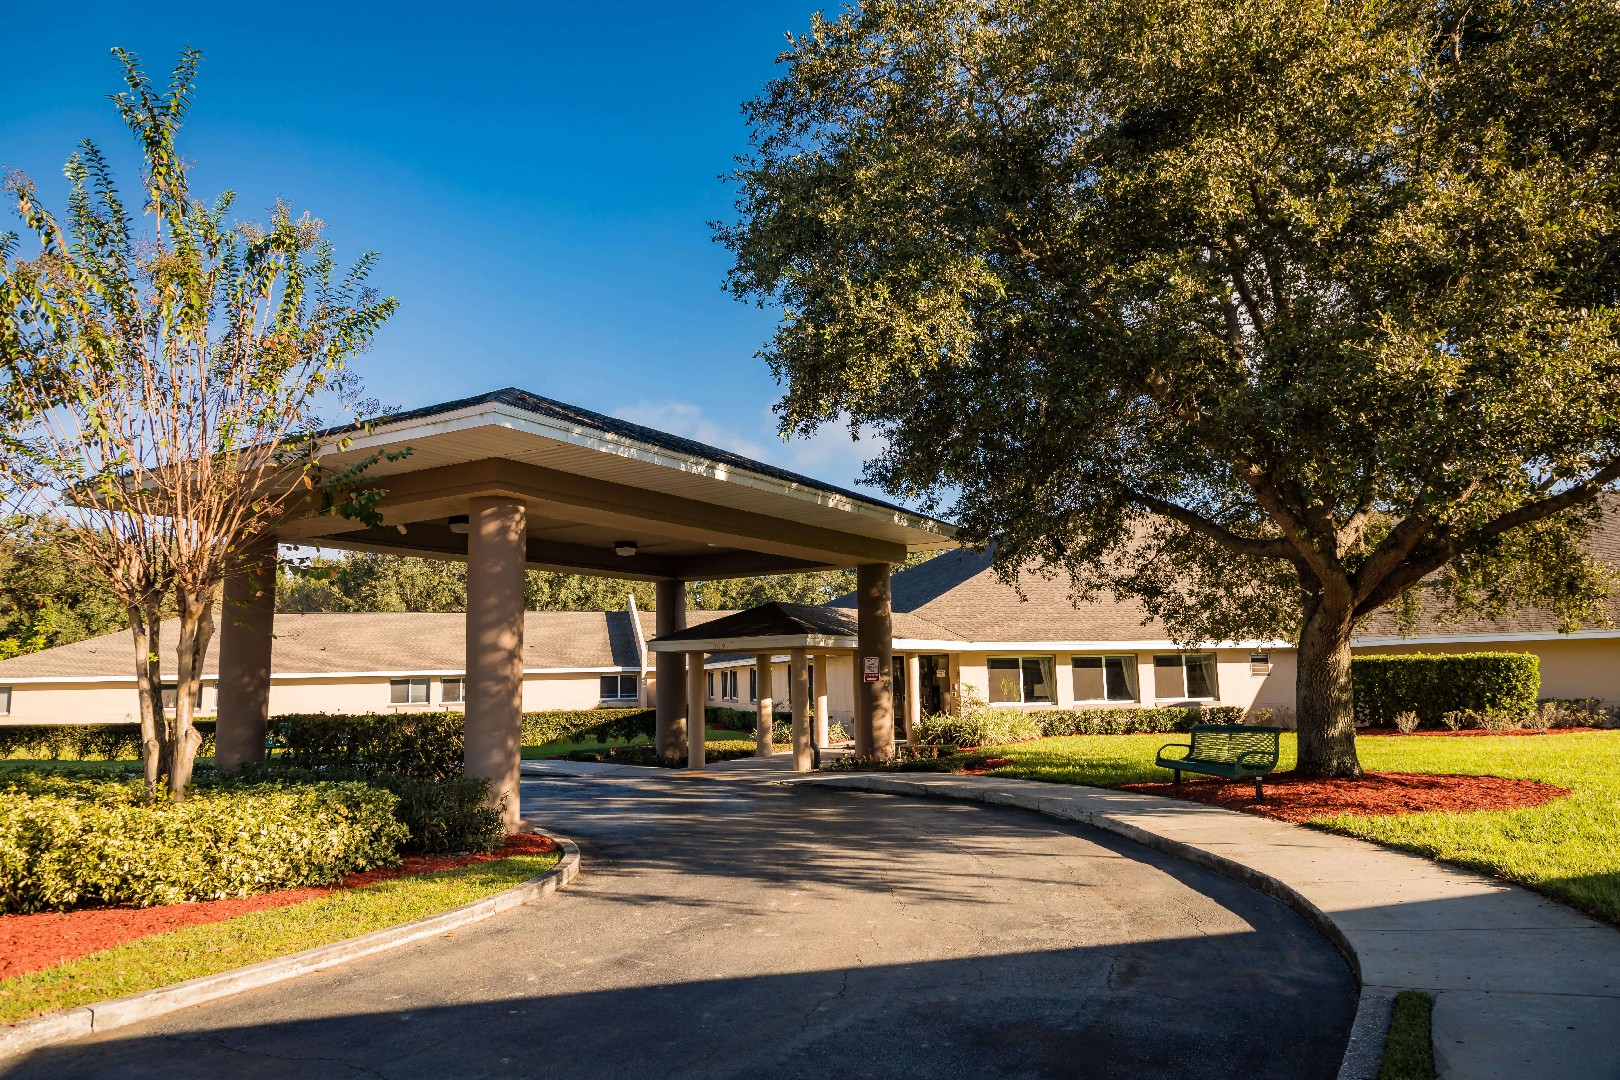
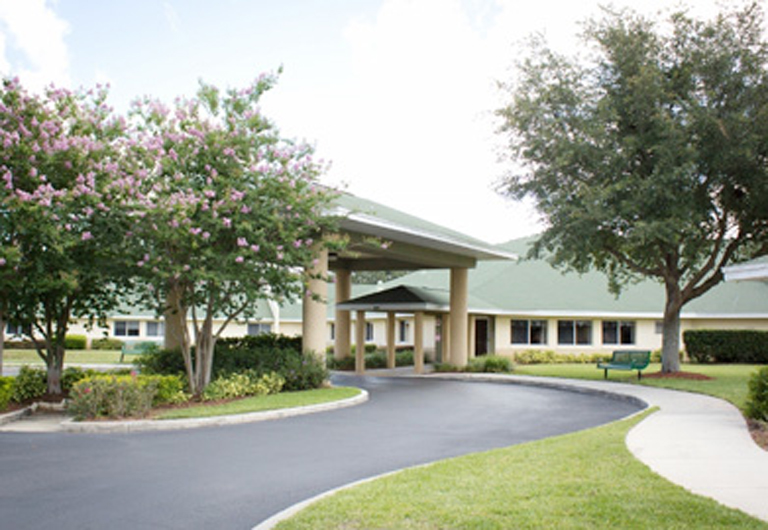
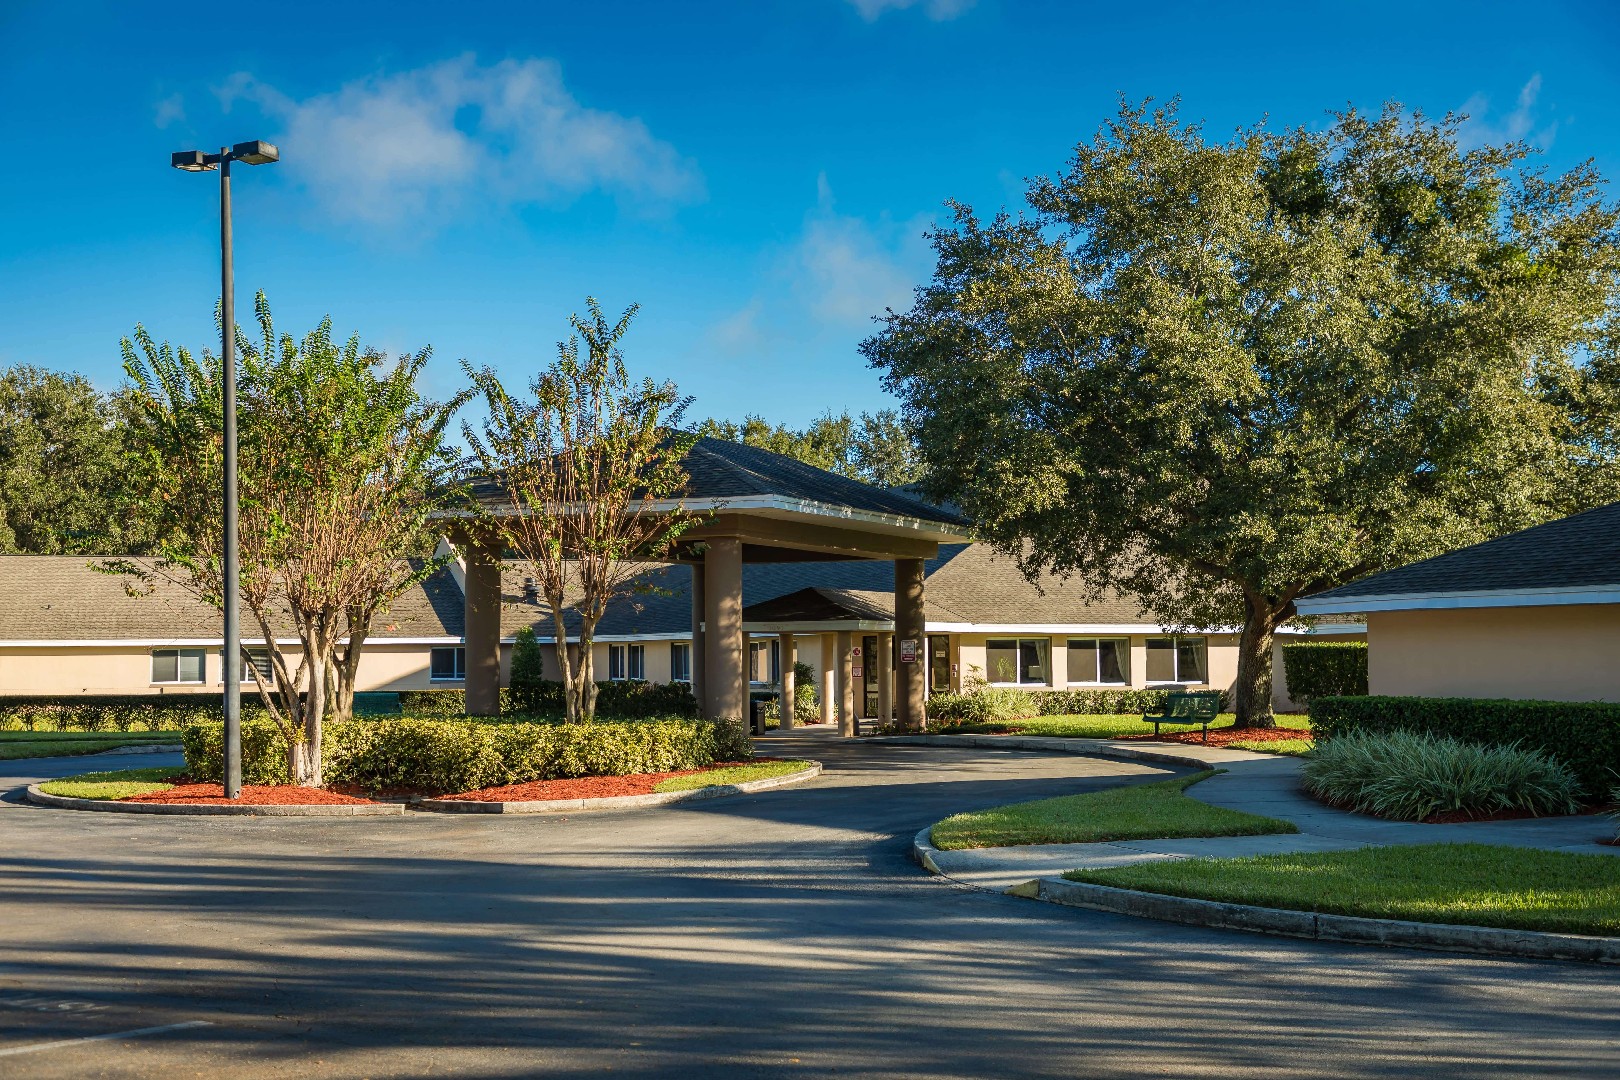
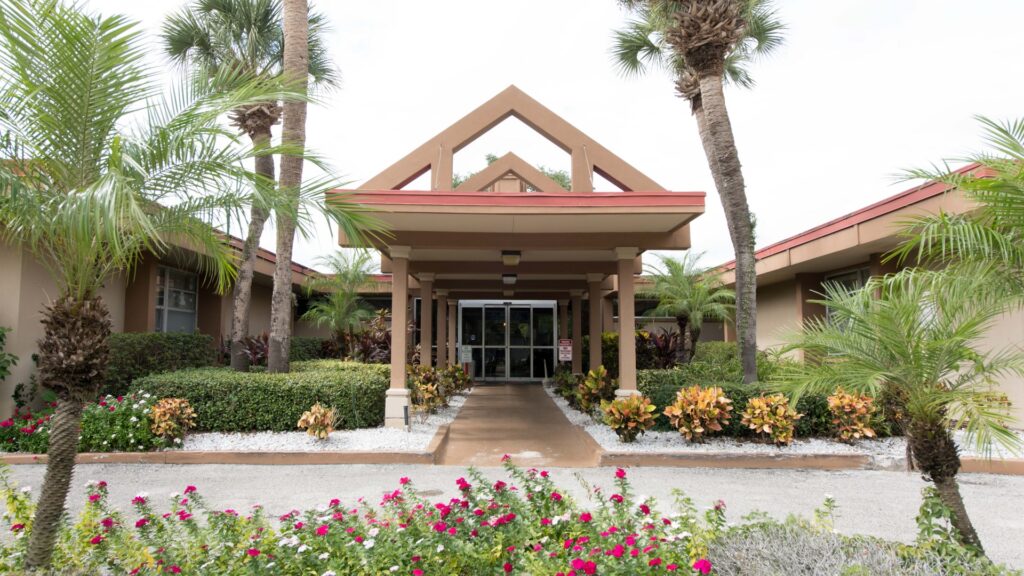
Lake Bennet Center for Rehabilitation and Healing is an astounding community set near delightful local amenities and Orlando Health-Health Central Hospital in Ocoee, FL, offering short-term rehabilitation and long-term care. Featuring extensive care options, including palliative care, respite care, pain management, memory care, podiatry, and other specialized care, residents can keep their peace of mind and receive the utmost care they deserve. A compassionate and specially trained team ensures residents live comfortably in their golden years, providing assistance with their daily living activities around the clock.

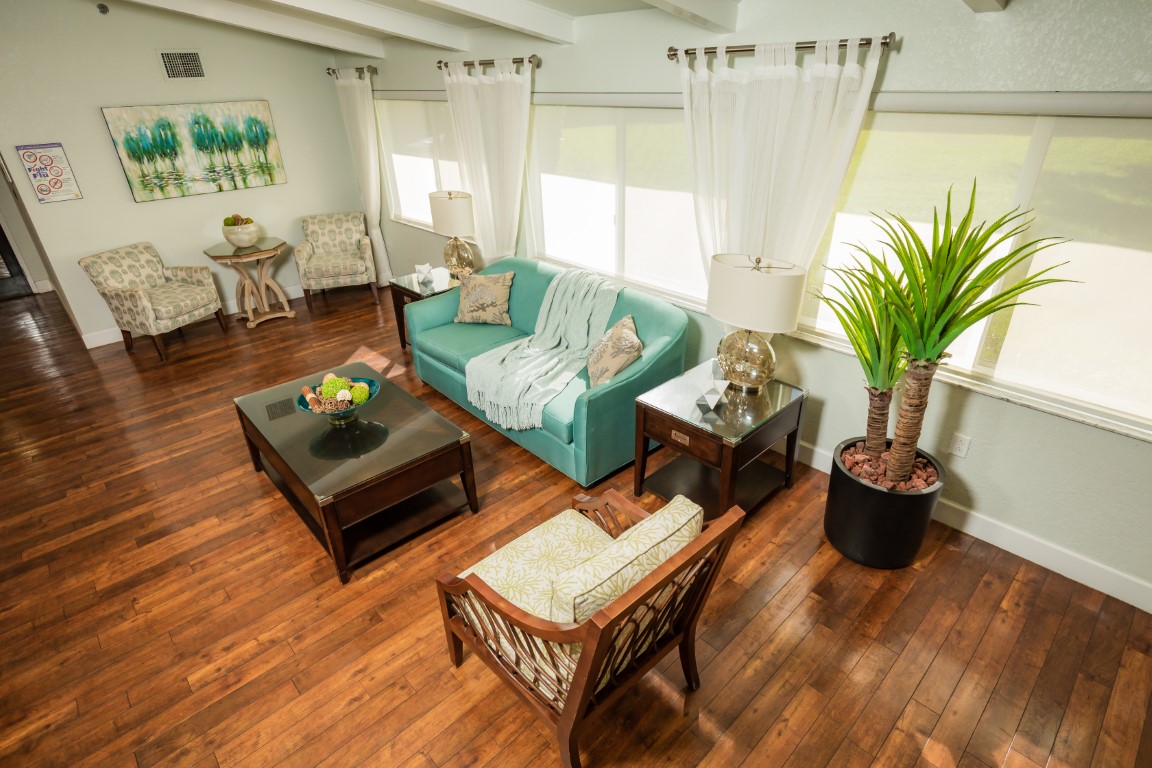
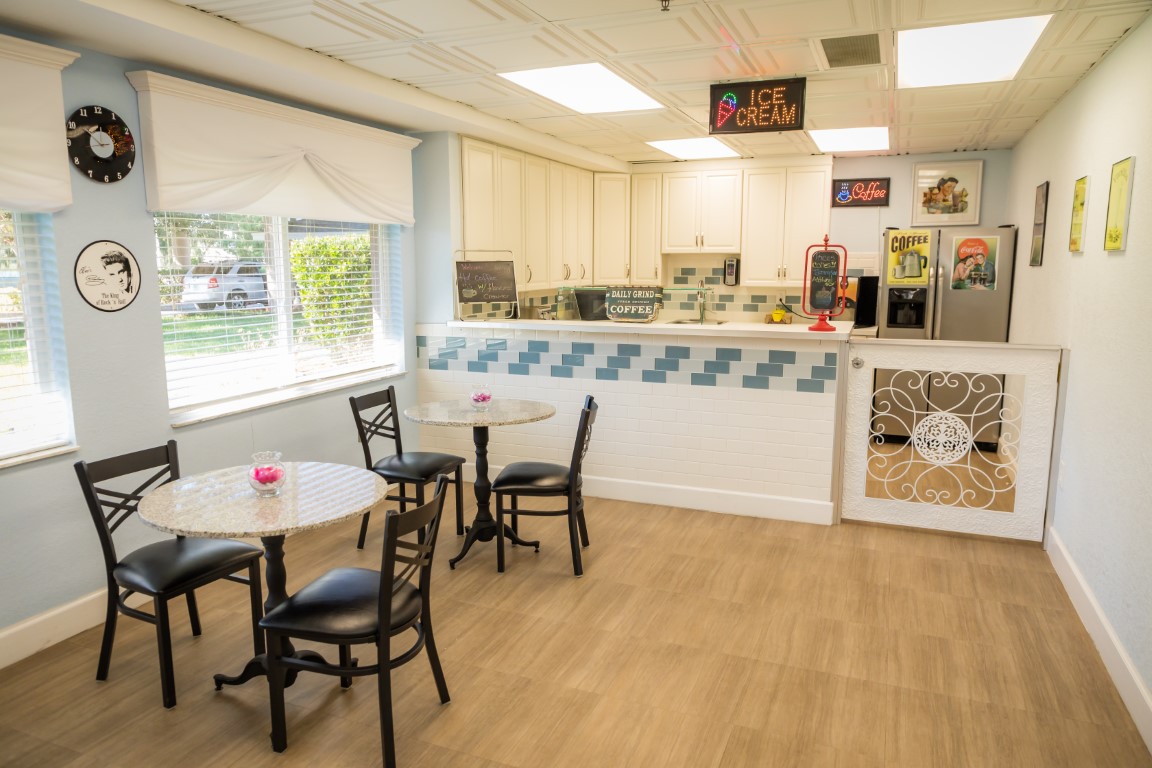
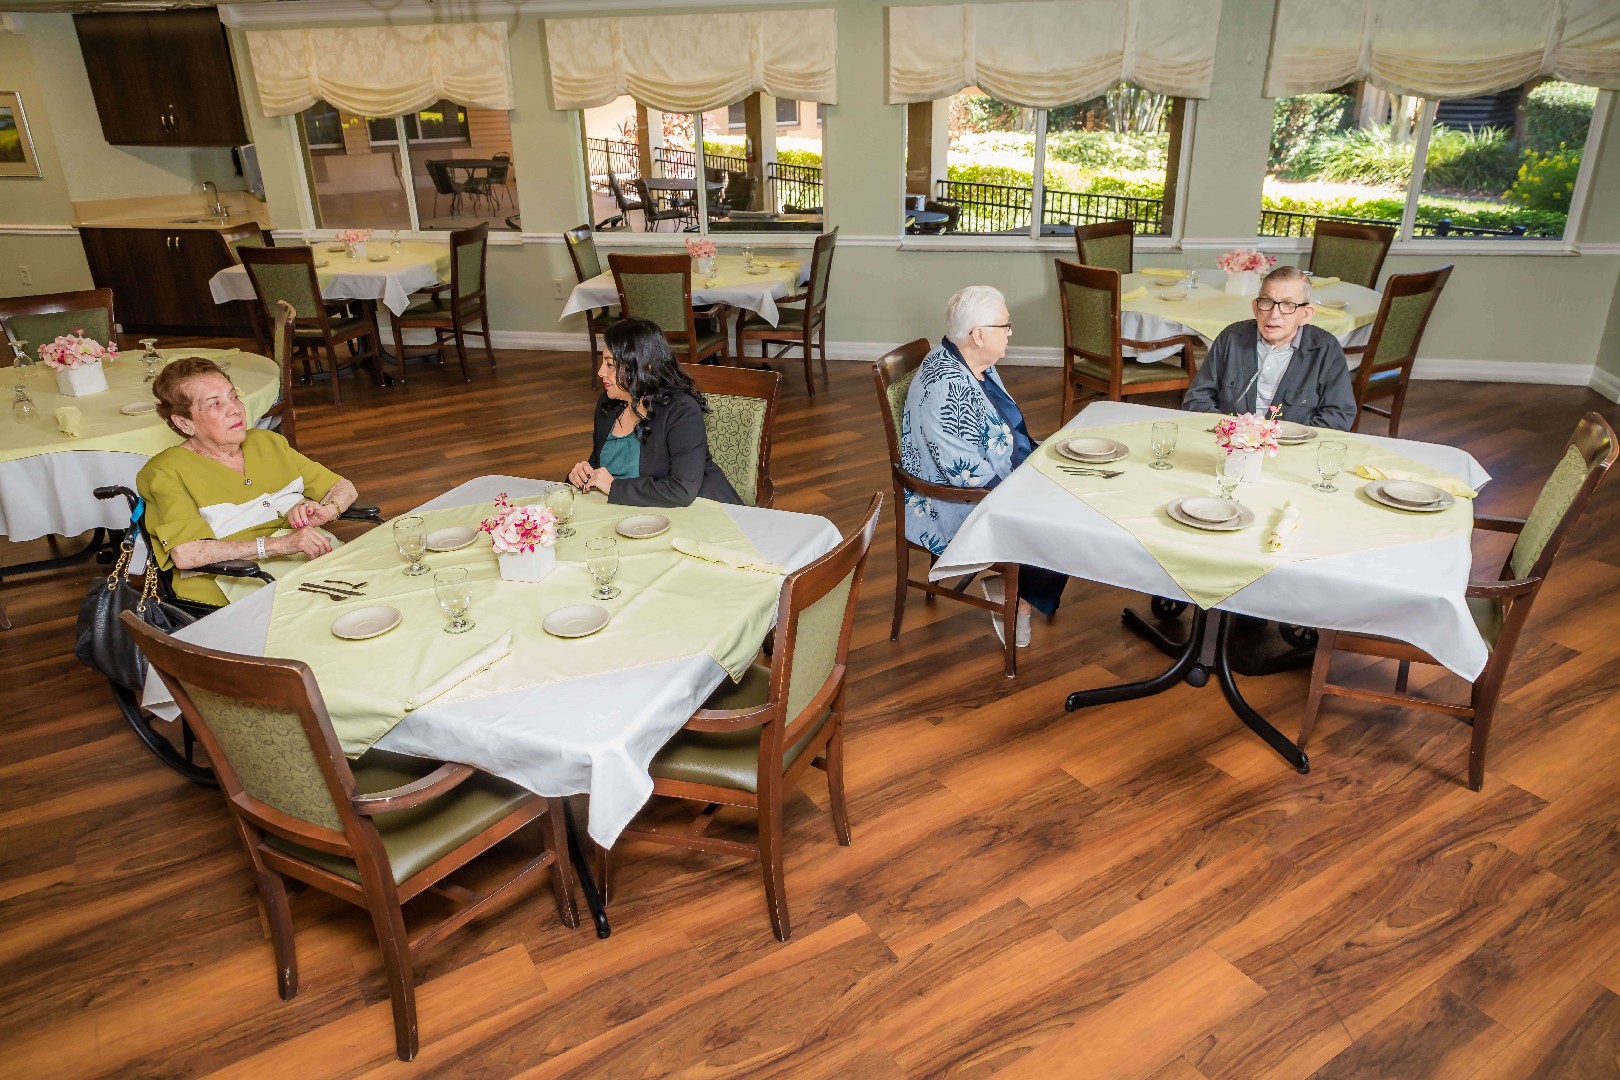
From live entertainment to exciting outings, the community conducts a variety of engaging activities and enriching programs for residents’ leisure and wellness. Mealtimes also promote social interactions and meet dietary needs with delicious and healthy meals that cater to their dietary needs and preferences. Amenities include a library, a dayroom, a cafe, a salon, and beautifully landscaped courtyards, creating the perfect setting for a blissful retirement.

Quality ratings

Measured by Centers for Medicare & Medicaid Services (CMS)

Overall rating Info Official CMS rating based on health inspections, staffing and quality measures.
2/5
Florida average: 3.2/5
Health Inspection Info Official CMS rating based on deficiencies found during state health inspections.
1/5
Florida average: 2.8/5
Staffing Info Official CMS rating based on nurse staffing hours per resident per day.
3/5
Florida average: 3.4/5
Quality Measures Info Official CMS rating based on clinical outcomes for residents.
5/5
Florida average: 4.1/5

Nursing care per resident

Info Average daily nursing hours per resident (adjusted for acuity). Higher values indicate more nursing time per resident.
3h 45m per day

This home provides 7% less nursing time per resident than the Florida average.

Florida average: 4h 2m per day

Staffing hours breakdown

Info Hours of care per resident per day, broken down by staff type. Data from CMS Medicare.
Staff type Facility State avg National avg
Registered Nurse (RN) Info Registered nurse hours per resident per day. 18m per day 32m per day 29m per day

Capacity and availability

This home is often near full

That suggests steady demand, but availability may be limited.

Higher demand than most homes in Florida
Occupancy rate 97%
Residents per day (avg) 115
Occupancy rate
97%
Residents per day (avg)
115

Who this home usually serves

TYPE OF STAY

Mix of rehab and long-term care

This home supports both short-term rehab and long-term care, with residents staying for a wide range of durations.

Breakdown by payment type

Medicare

40% of new residents, usually for short-term rehab.

Typical stay 30 days

Private pay

47% of new residents, often for short stays.

Typical stay 27 days

Medicaid

13% of new residents, often for long-term daily care.

Typical stay 10 - 11 months

Finances and operations

Privately-owned community
Operated by a business corporation.
Home revenue
$16.8M
Profit
$127.0K
Privately-owned community Operated by a business corporation.
Home revenue
$16,763,742.00
Profit
$126,981.00
Payroll costs Info The portion of the home's budget spent on staff, including nurses, caregivers, and other employees who support care and operations.
$7.2M
43.2% of revenue
Other operating costs Info All remaining costs needed to run the home, such as food, utilities, building maintenance, supplies and administrative expenses.
$9.4M
Total costs $16.6M
Walk Score
Walk Score: 40 / 100
Somewhat walkable. A few nearby services may be reachable on foot, but most trips require transportation.

About this community

Care Services

Accepts Medicaid
Accepts Medicare
Doctor on Staff
Nursing Services
Rehabilitation Services
Respite Care
Memory Care
Independent Living
Skilled Nursing
Licensed Nurses/CNAs
24-Hour Staffing
Short-Term Rehab

All Levels of Care

Short-Term Rehab
Long-Term Care
Specialty Care
Subacute Services

Amenities & Lifestyle

Private and Semi-Private Rooms
Elegant Dining Areas
Charming Outdoor Courtyards
Complimentary TV and Wi-Fi
Enrichment Activities
Cafe / Ice Cream Parlor
Dayroom / TV Lounge
Library
Beautician Services / Salon

Programs & Activities

Specific Programs
Short-Term Rehab, Long-Term Care, Specialty Care, Subacute Services
Operating Hours
24 hours a day, 7 days a week

Pricing & Financial Information

What does this home offer?

Accepts Medicaid icon

Accept Medicaid: Yes

Total residents icon

Total Residents: 115 Residents

Housing options icon

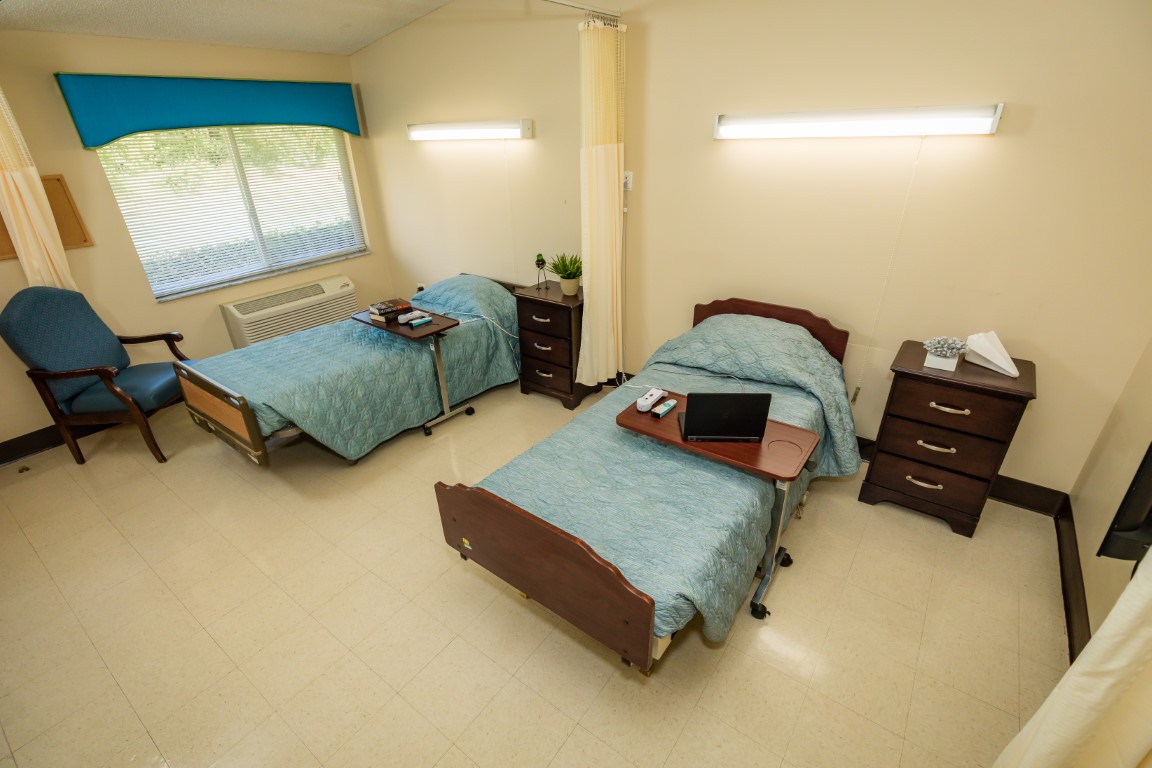
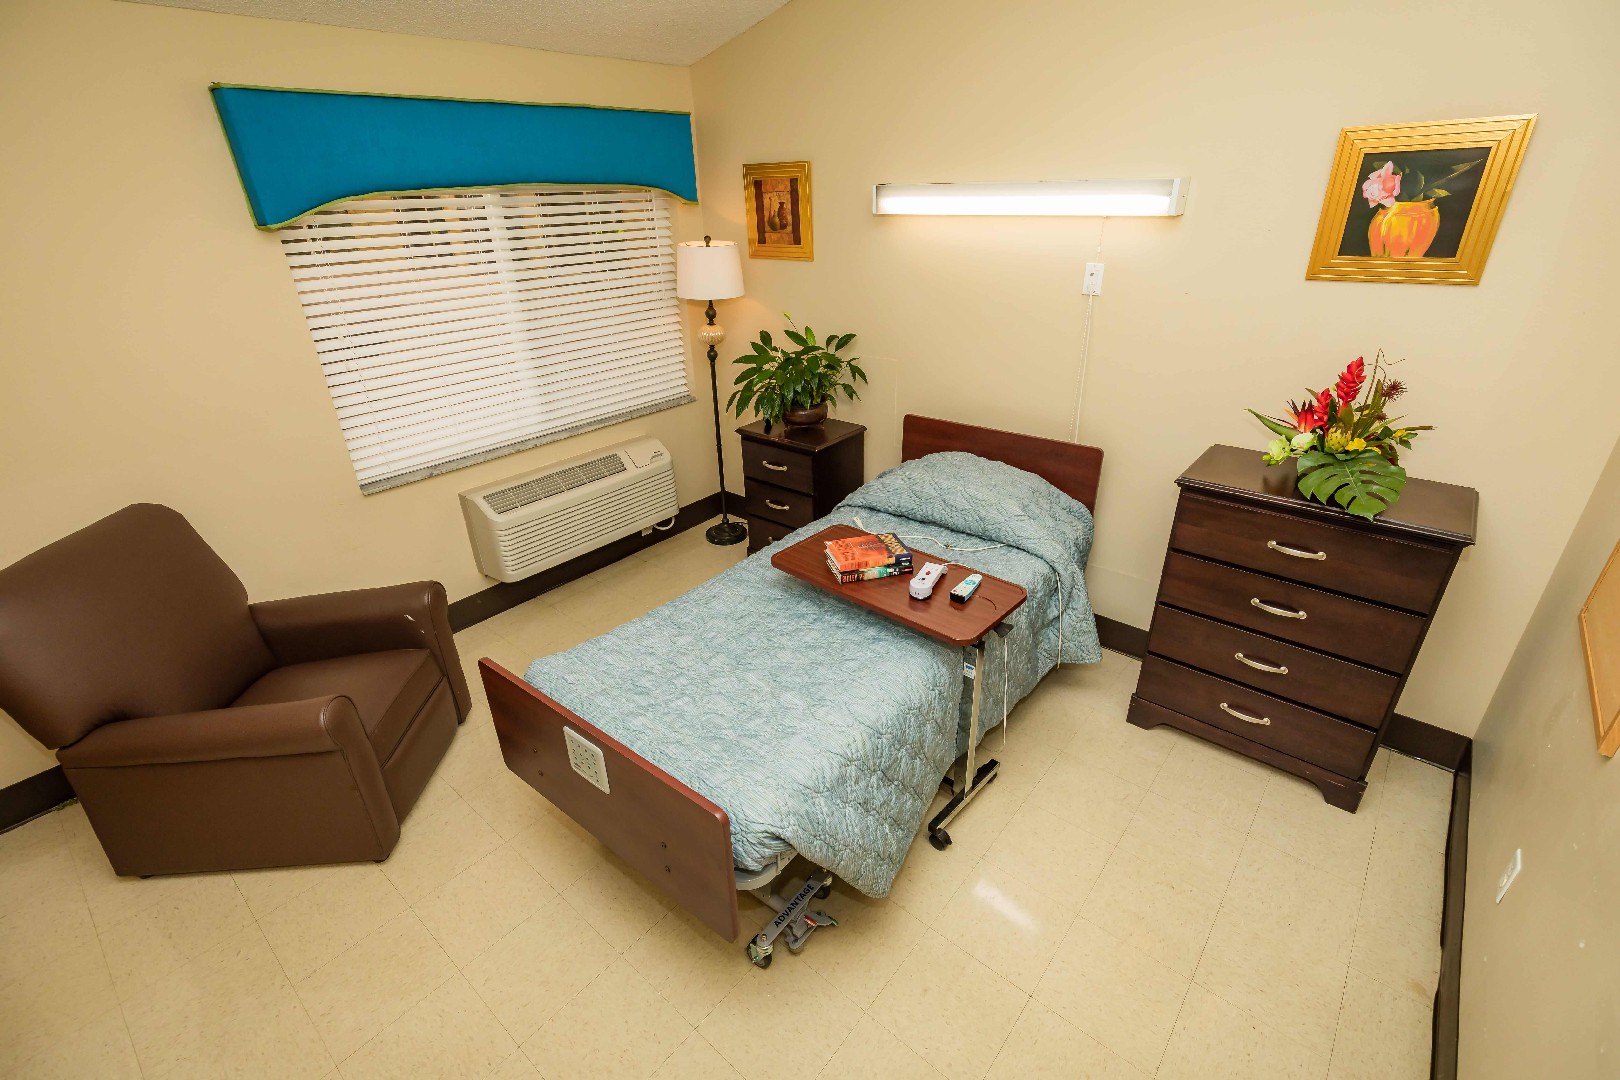
Housing Options: Private / Semi-private Rooms

Building type icon
Building type icon

Building Type: Single-story

Dining services icon

Dining Services

Recreational activities icon

Recreational Activities

Health Programs icon

Health Programs

Types of Care at Lake Bennet Center for Rehabilitation and Healing

Nursing Home Hospice Care Respite Care
Contact Lake Bennet Center for Rehabilitation and Healing

Health Inspection History

Inspections
Total health inspections 4

Florida average 4.3


Last Health inspection on Aug 2025

Total health citations 16
Citations per inspection
4

Health citations are formal notices following inspections when they fail to comply with safety and care standards.

12 of 16 citations resulted from standard inspections; 3 of 16 resulted from complaint investigations; and 1 of 16 came from combined inspections (standard and complaint).

Breakdown of citation severity (last 3 years)
Critical Health citations More info 2
150% worse than Florida average

Florida average: 0.8


Serious Health citations More info 0
100% better than Florida average

Florida average: 0.4

2 critical citations More info Florida average: 0.8

0 serious citations More info Florida average: 0.4

14 moderate citations More info Florida average: 18.4

0 minor citations More info Florida average: 0.2
Citations history (last 3 years)
Nutrition moderate citation Aug 07, 2025
Corrected

Pharmacy moderate citation Aug 07, 2025
Corrected

Abuse/Neglect critical citation May 17, 2025
Corrected

Quality of Care critical citation May 17, 2025
Corrected

Compare Nursing Homes around Orange County

The information below is reported by the Florida Agency for Health Care Administration (AHCA).
Tuskawilla Nursing and Rehab Center
SNF

Nursing Homes 24/7 care needed

RC

Respite Care

Winter Springs
98
A-
62
GALVIN, RODRICK
92.0%
$14,131,211.00
$5,410,587.00
38.3%
91.60
5/5
3.7691
4/5
4/5
5/5
3
9
1
-2%
-7%
+9%
Private / Semi-private Rooms
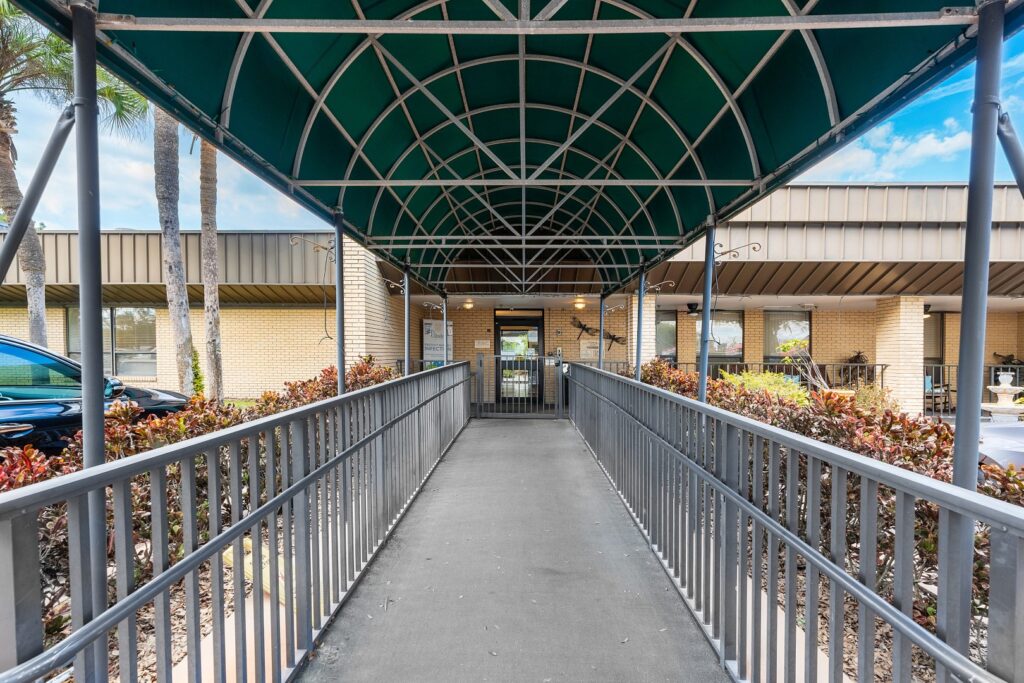
Winter Garden Rehabilitation and Nursing Center
SNF

Nursing Homes 24/7 care needed

Winter Garden
120
-
37
WG REHAB HOLDINGS, LLC
91.9%
$13,106,930.00
$5,718,644.00
43.6%
101.70
2/5
4.0056
2/5
4/5
4/5
1
25
1
-29%
-1%
+9%
Private / Semi-private Rooms
Lake Bennet Center for Rehabilitation and Healing
HC

Hospice Care

SNF

Nursing Homes 24/7 care needed

RC

Respite Care

Ocoee
120
-
40
LAKE BENNET SNF OPERATIONS HOLDINGS LLC
97.0%
$16,761,873.00
$7,236,567.00
43.2%
115.30
2/5
3.7580
1/5
3/5
5/5
1
16
2
-24%
-7%
+15%
Private / Semi-private Rooms
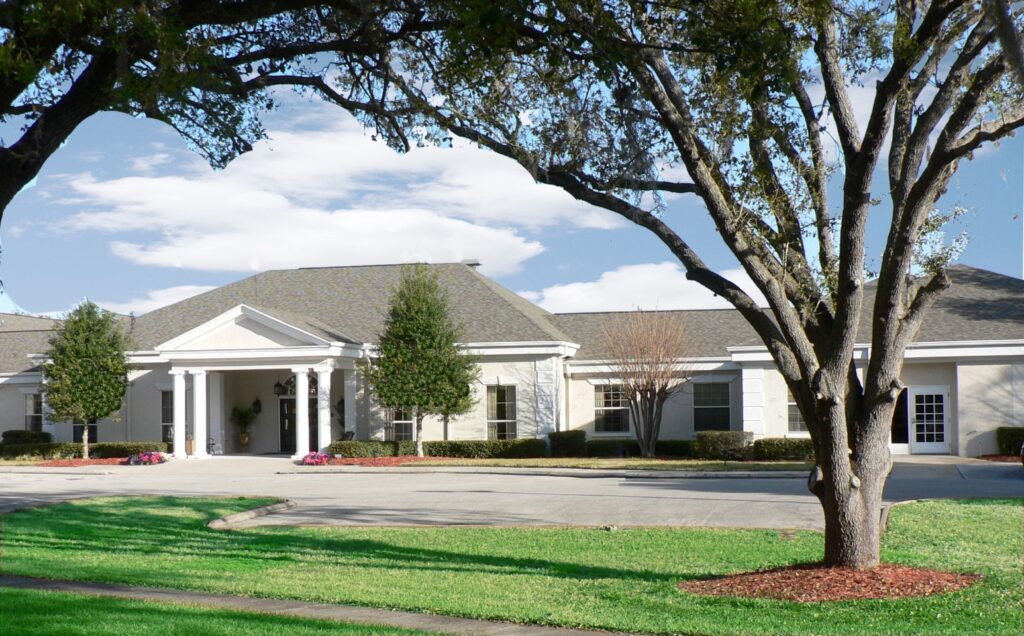
Conway Lakes Health & Rehabilitation
SNF

Nursing Homes 24/7 care needed

Orlando (Dover Manor)
120
-
10
DUMONT, BRITTNEY
95.5%
$18,401,299.00
$7,839,875.00
42.6%
113.20
1/5
4.2087
1/5
4/5
3/5
6
31
3
-7%
+4%
+13%
Private / Semi-private Rooms
South Orange Health and Rehabilitation Center
SNF

Nursing Homes 24/7 care needed

Orlando (Southeast Orlando)
108 Residents
-
60
-
-
-
-
-
-
-
-
-
-
-
-
-
-
-
-
-
Private / Semi-private Rooms

Places of interest near Lake Bennet Center for Rehabilitation and Healing

Address 2.2 miles from city center

Address 1091 Kelton Ave, Ocoee, FL 34761

Calculate Travel Distance to Lake Bennet Center for Rehabilitation and Healing

Add your location

Address

Staffing Data

Source: CMS Payroll-Based Journal (Q2 2025)

155
Total Staff
119
Employees
36
Contractors
48,085
Total Hours (Quarter)
67
Avg Staff/Day
7.9
Avg Shift (hrs)
Nursing Staff Breakdown
Role Count Avg Shift (hrs) Uses Contractors?
Registered Nurse148.2 No
Licensed Practical Nurse298.6 No
Certified Nursing Assistant637.7 No
Staff by Category
Administration
2 staff
7.7hs shift avg
Nursing Staff
108 staff
8hs shift avg
Physicians & Practitioners
5 staff
8hs shift avg
Therapy Services
29 staff
7.4hs shift avg
Activities & Recreation
0 staff
0hs shift avg
Social Services
6 staff
6.5hs shift avg
Dietary Services
3 staff
8hs shift avg
Other Services
2 staff
7.8hs shift avg
Contractor Analysis
15.3%
of total hours from contractors
7,367 contractor hours this quarter
Occupational Therapy Aide: 2 Physical Therapy Aide: 7 Qualified Social Worker: 6 Respiratory Therapy Technician: 8 Speech Language Pathologist: 5 Physical Therapy Assistant: 6 Occupational Therapy Assistant: 1 Medical Director: 1
Role Employees Contractors Total Staff Total Hours Days Worked % of Days Avg Shift (hrs)
Certified Nursing Assistant6306322,42491100%7.7
Licensed Practical Nurse2902910,41691100%8.6
Registered Nurse140142,64791100%8.2
Respiratory Therapy Technician0881,8987886%7.7
Physical Therapy Aide0771,6138695%7.8
Qualified Social Worker0661,3986571%6.5
Physical Therapy Assistant0661,2288189%6.4
RN Director of Nursing2021,0048593%8.4
Dietitian2029847785%8.1
Speech Language Pathologist0558966976%7.4
Clinical Nurse Specialist3037426774%8.1
Nurse Practitioner2025296673%7.9
Administrator1015136470%8
Dental Services Staff1015046571%7.8
Mental Health Service Worker1014856167%8
Other Dietary Services Staff1014716066%7.8
Occupational Therapy Aide0223064044%7.6
Occupational Therapy Assistant0112433%8
Medical Director011533%1.5

Facility Characteristics

Source: CMS Long-Term Care Facility Characteristics (Data as of Jan 2026)

Total census
114 residents
Residents by payment source
Medicare
25 residents (21.9%)
Medicaid
68 residents (59.6%)
Private pay or other
21 residents (18.4%)
Programs & Services
Residents' Group

Residents meet regularly to discuss policies, care quality, and activities

Active Resident Council

Organized group of residents that meets regularly to discuss facility policies, quality of life, and activities.

Quality of care over time

These measures show how residents usually do over time at this home, based on health outcomes and preventive care.

High-risk clinical events score Info A composite score based on pressure ulcers, falls with injury, weight loss, walking ability decline, and activities of daily living decline. 6.1
17% better than Florida average

Florida average: 7.4

Functional decline score Info A composite score based on activities of daily living decline, walking ability decline, and incontinence. 4.1
67% better than Florida average

Florida average: 12.4

Long-stay resident measures
Significantly above average Florida avg: 4.6 Info CMS star rating based on long-stay quality measure performance. 5 stars = significantly above average, 1 star = significantly below average.
Need for Help with Daily Activities Increased Info Percent of long-stay residents whose need for help with daily activities has increased 6.4%
39% better than Florida average

Florida average: 10.5%

Walking Ability Worsened Info Percent of long-stay residents whose ability to move independently worsened 3.9%
70% better than Florida average

Florida average: 12.9%

Low Risk Residents with Bowel/Bladder Incontinence Info Percent of low risk long-stay residents who lose control of their bowels or bladder 1.9%
86% better than Florida average

Florida average: 13.5%

Falls with Major Injury Info Percent of long-stay residents experiencing one or more falls with major injury 6.2%
134% worse than Florida average

Florida average: 2.6%

High Risk Residents with Pressure Ulcers Info Percent of long-stay high risk residents with pressure ulcers 7.1%
32% worse than Florida average

Florida average: 5.4%

Urinary Tract Infection Info Percent of long-stay residents with a urinary tract infection 0.0%
100% better than Florida average

Florida average: 0.9%

Lost Too Much Weight Info Percent of long-stay residents who lose too much weight 7.1%
19% worse than Florida average

Florida average: 6.0%

Depressive Symptoms Info Percent of long-stay residents who have depressive symptoms 0.0%
100% better than Florida average

Florida average: 3.3%

Antipsychotic Use Info Percent of long-stay residents who received an antipsychotic medication 5.2%
35% better than Florida average

Florida average: 8.0%

Pneumococcal Vaccine Info Percent of long-stay residents assessed and appropriately given the pneumococcal vaccine 97.9%
In line with Florida average

Florida average: 97.7%

Influenza Vaccine Info Percent of long-stay residents assessed and appropriately given the seasonal influenza vaccine 100.0%
In line with Florida average

Florida average: 99.2%

Hospitalizations per 1,000 days Info Number of hospitalizations per 1,000 long-stay resident days. 2.29
9% worse than Florida average

Florida average: 2.10

ED visits per 1,000 days Info Number of outpatient emergency department visits per 1,000 long-stay resident days. 0.58
51% better than Florida average

Florida average: 1.18

Short-stay resident measures
Significantly above average Florida avg: 2.9 Info CMS star rating based on short-stay quality measure performance. 5 stars = much above average, 1 star = much below average.
Pneumococcal Vaccine Info Percent of short-stay residents assessed and appropriately given the pneumococcal vaccine 91.9%
In line with Florida average

Florida average: 94.0%

Antipsychotic medication increase Info Percent of short-stay residents who newly received an antipsychotic medication 0.5%
67% better than Florida average

Florida average: 1.5%

Influenza Vaccine Info Percent of short-stay residents assessed and appropriately given the seasonal influenza vaccine 96.2%
In line with Florida average

Florida average: 94.7%

Re-hospitalized after SNF stay Info Percentage of short-stay residents who were re-hospitalized after their nursing home admission. 28.1%
7% worse than Florida average

Florida average: 26.2%

Emergency department visits Info Percentage of short-stay residents who had an outpatient emergency department visit. 5.4%
42% better than Florida average

Florida average: 9.3%

Falls with major injury Info Percentage of SNF residents who experience falls with major injury during their stay. 0.0%
100% better than Florida average

Florida average: 0.8%

Ability to care for self at discharge Info Percentage of residents at or above expected ability to care for themselves at discharge. 66.9%
25% better than Florida average

Florida average: 53.7%

Successful return to home or community Info Rate of successful return to home or community from a skilled nursing facility. 56.1%
11% better than Florida average

Florida average: 50.6%

Penalties and fines

Federal penalties imposed by CMS for regulatory violations, including civil money penalties (fines) and denials of payment for new Medicare/Medicaid admissions.

Source: CMS Penalties Database (Data as of Jan 2026)

Total fines amount $75K
In line with Florida average

Florida average: $72K

Number of fines 1
62% fewer fines than Florida average

Florida average: 2.6

Payment Denials Info Serious action where Medicare and/or Medicaid temporarily stops payments for new residents until issues are fixed. 0
100% fewer payment denials than Florida average

Florida average: 0.1

Fines amount comparison
This facility $75K
Florida average $72K
Penalty History

Penalties are imposed by CMS for violations of federal nursing home regulations.

Civil Money Penalty Info Fines imposed for noncompliance, which can be assessed per day or per instance of violation. May 17, 2025
$75K

Last updated: Jan 2026

Guides for Better Senior Living

Care Cost Calculator: See Prices in Your Area

Nursing Home Data Explorer

Don’t Wait Too Long: 7 Red Flag Signs Your Parent Needs Assisted Living Now

The True Cost of Assisted Living in 2025 – And How Families Are Paying For It

Understanding Senior Living Costs: Pricing Models, Discounts & Financial Assistance

Financial Aid for Florida Seniors

Get financial aid guidance

Long-Term Care Waiver

Florida Medicaid LTC Waiver

Age 65+ or 21+ disabled, Florida resident, Medicaid- eligible, nursing home-level care need.

~$2,829/month (300% FBR, individual).

$2,000 (individual), $3,000 (couple).

High demand; waitlists common.

Community Care for the Elderly (CCE)

Florida CCE

Age 60+, Florida resident, at risk of nursing home.

~$2,000/month (varies).

$5,000 (individual).

Limited funding; regional variation.

Home Care for the Elderly (HCE)

Florida Home Care for the Elderly

Age 60+, Florida resident, at risk of nursing home placement; caregiver must be approved.

~$2,829/month (individual, aligned with Medicaid thresholds).

~$2,000 (individual); varies by case manager discretion.

Limited funding (~3,500 served annually); prioritizes low-income frail seniors.

Program of All-Inclusive Care for the Elderly (PACE)

Florida Medicaid PACE

Age 55+, Florida resident, nursing home-level care need, safe with PACE support.

~$2,829/month (300% FBR).

$2,000 (individual), $3,000 (couple).

Limited to specific counties (e.g., Hillsborough, Miami-Dade); ~10 sites statewide.

Optional State Supplementation (OSS)

Florida Optional State Supplementation

Age 65+ or disabled, Florida resident, living in approved facility, receiving SSI or low-income.

~$1,004/month (individual, including SSI).

$2,000 (individual), $3,000 (couple).

Limited to specific facility types; ~$78.40/month max supplement.

Senior Community Service Employment Program (SCSEP)

Florida SCSEP (federally funded, state-administered)

Age 55+, unemployed, low-income, Florida resident.

~$1,983/month (125% FPL, individual).

Not specified; income-focused.

Priority for veterans, rural residents; ~1,000 slots/year.