Nursing Home

Lake Village Nursing & Rehabilitation Center

Nursing Home

Lake Village Nursing & Rehabilitation Center

169 Lake Park Rd, Lewisville, TX 75057 View map
Overview of Lake Village Nursing & Rehabilitation Center

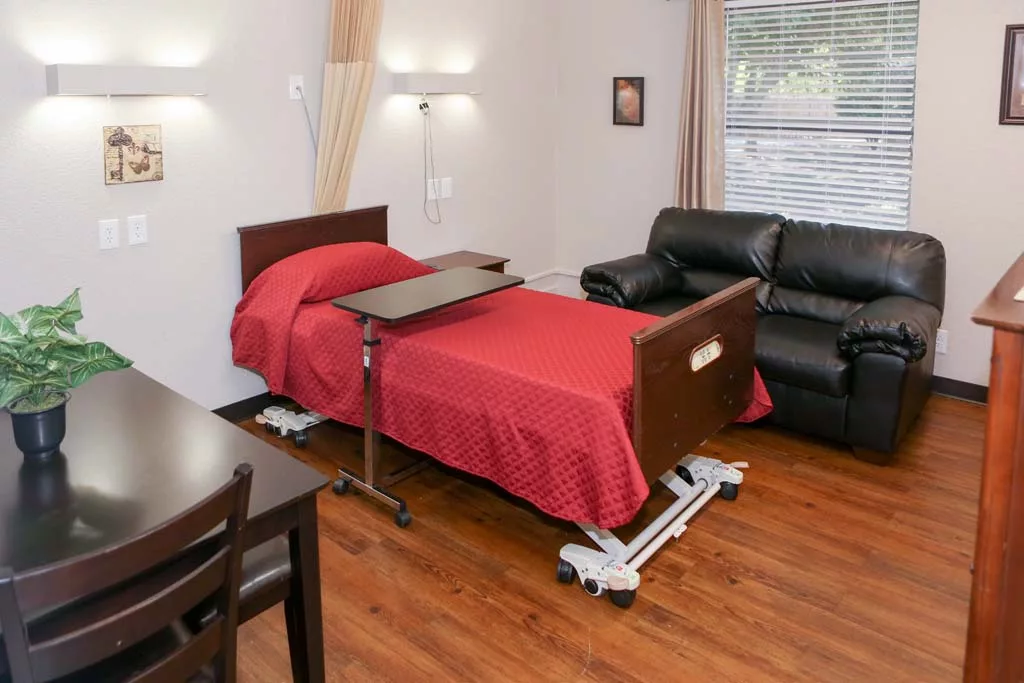
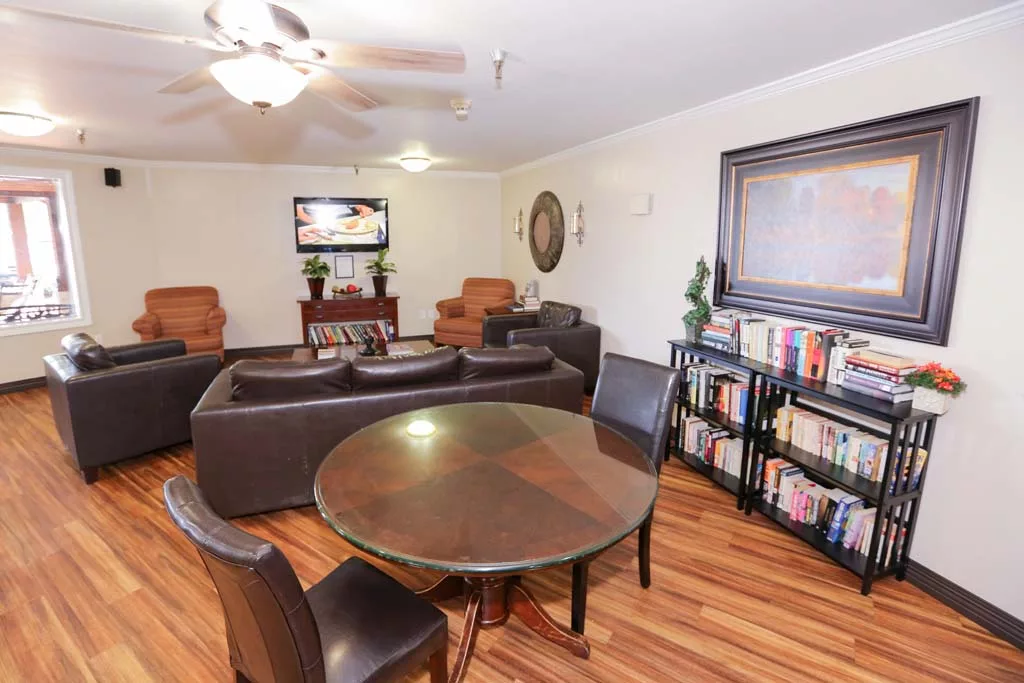
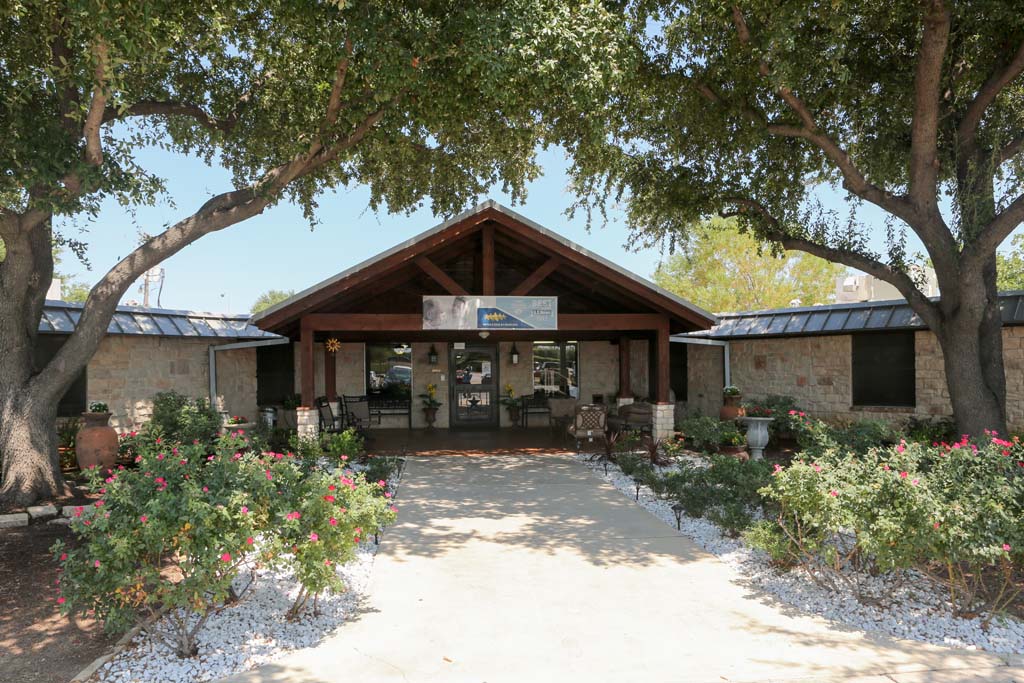
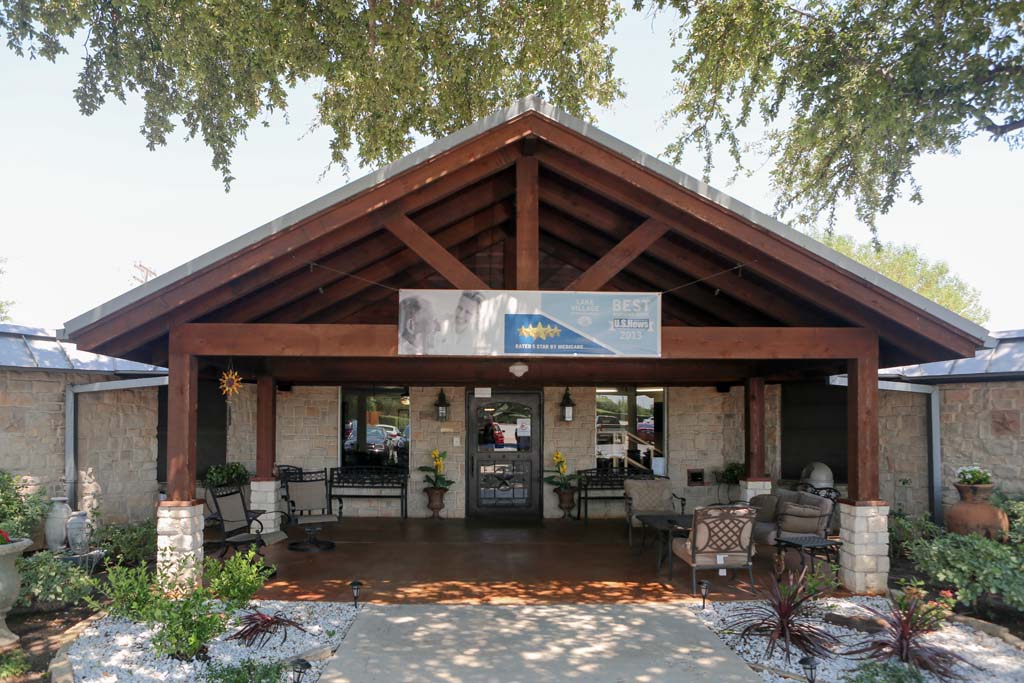
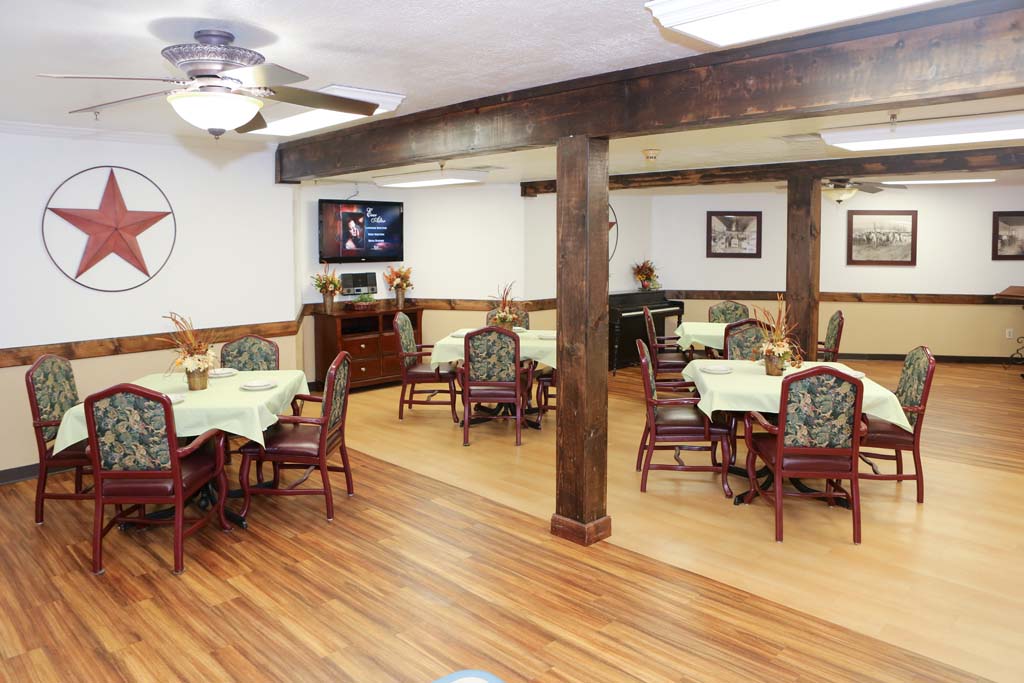
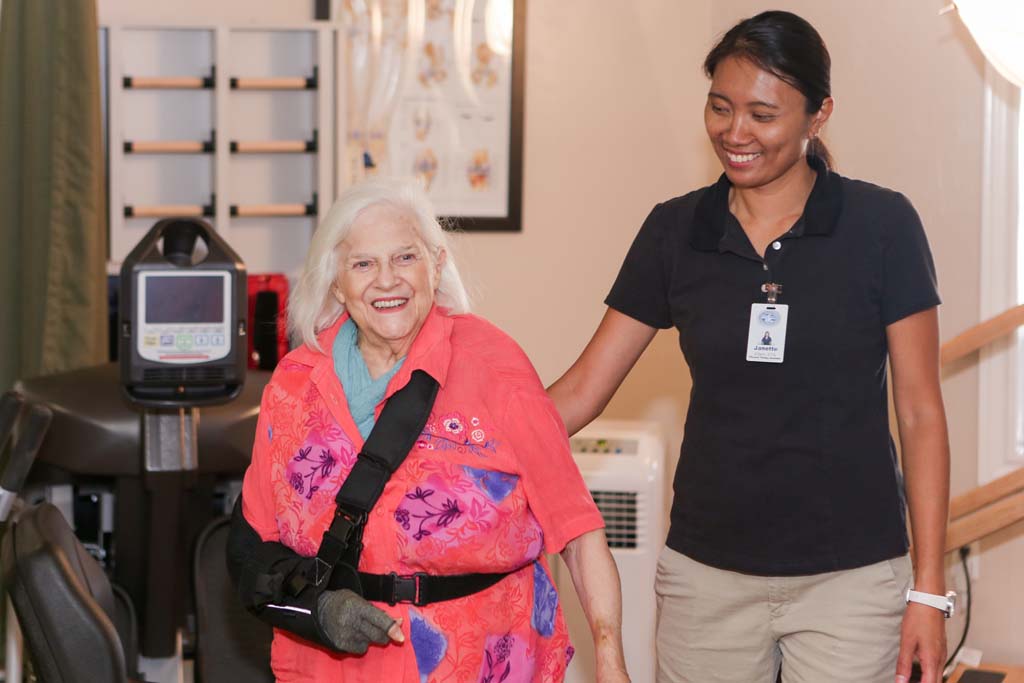
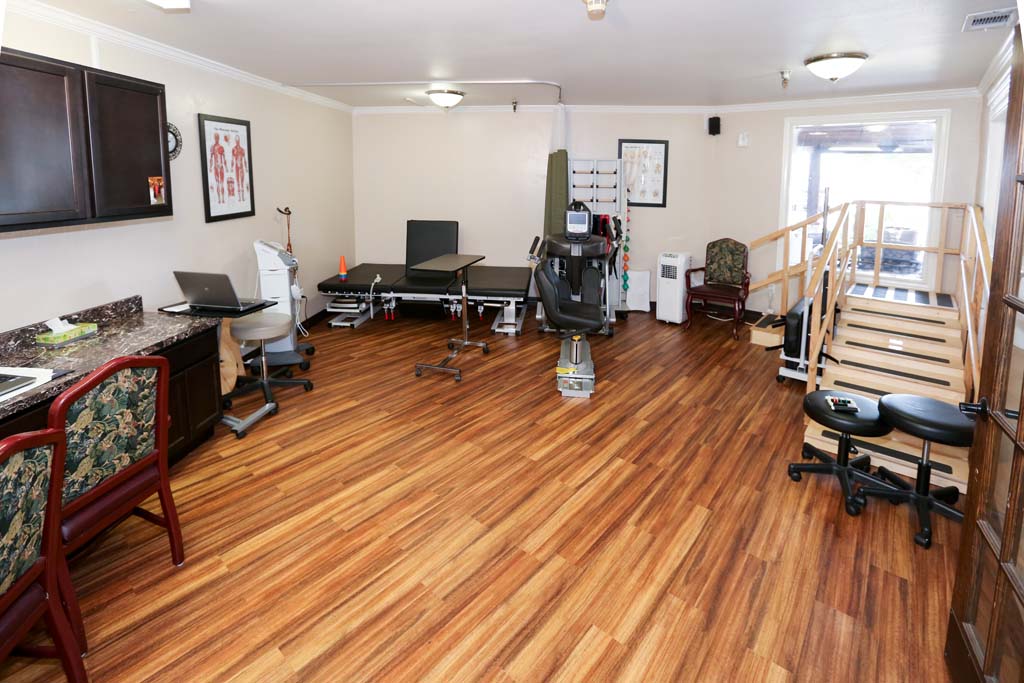
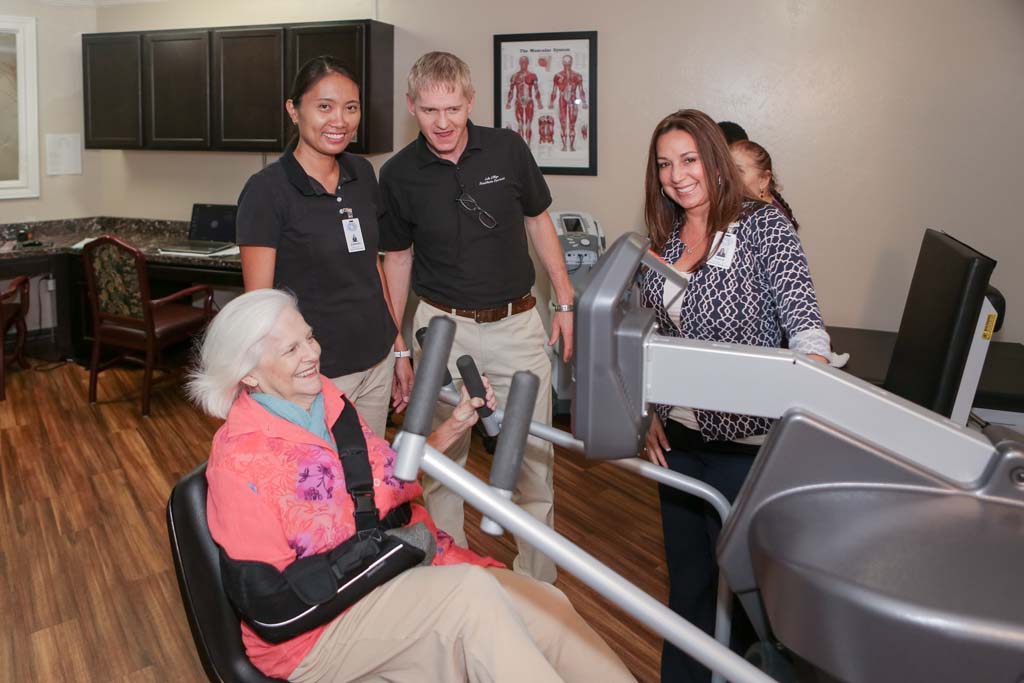
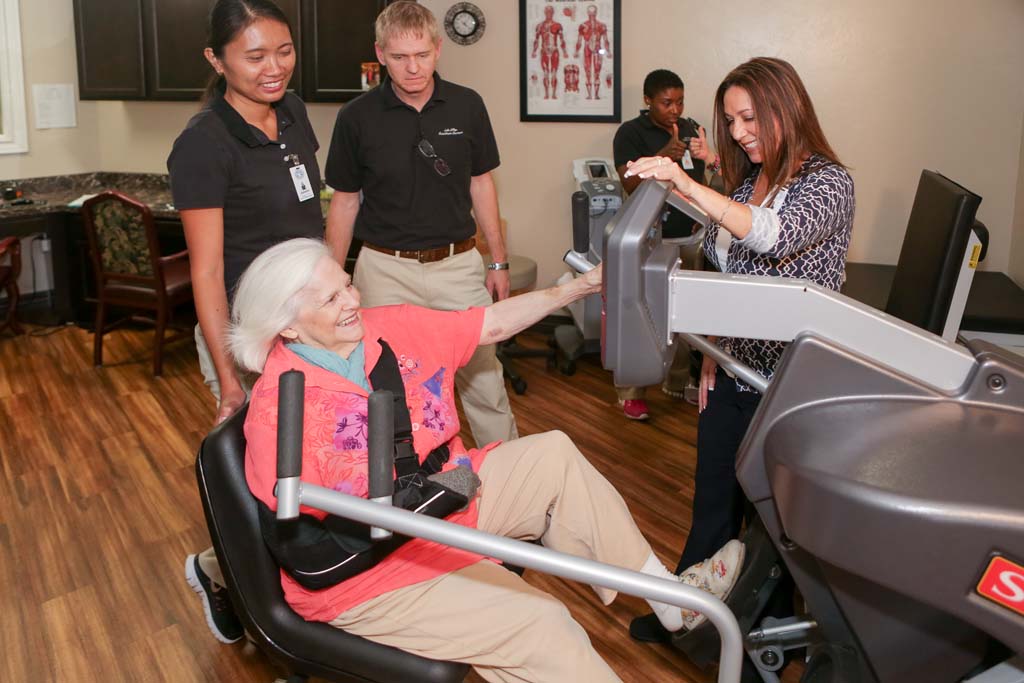
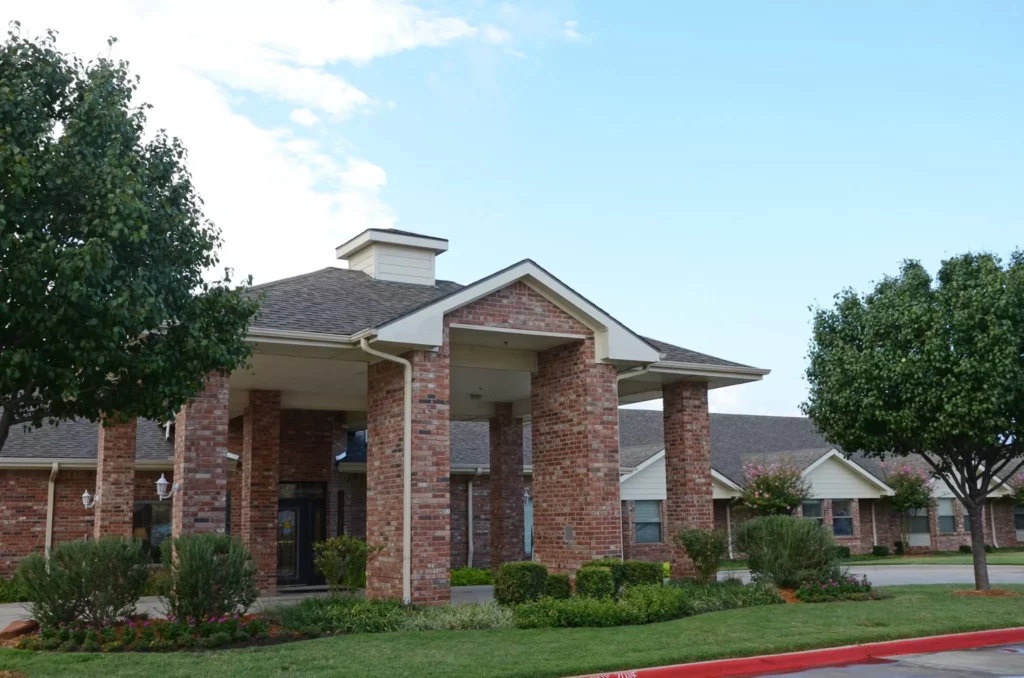
Lake Village Nursing and Rehabilitation Center is a senior living community providing long-term skilled nursing services, respite care, and skilled rehabilitation. Located in Lewisville, TX, this long-term care facility is committed to provide the best care for their residents, creating individualized care plans from admission to discharge. As part of their services, their residents receive 24/7 nursing assistance, medication management, and assistance with daily living activities.

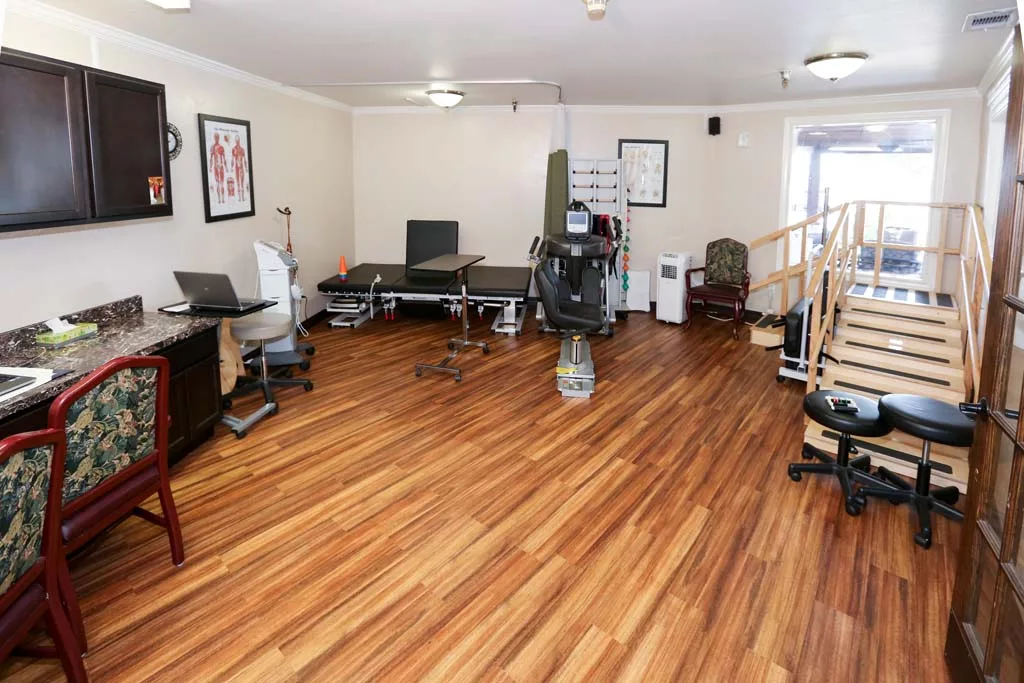
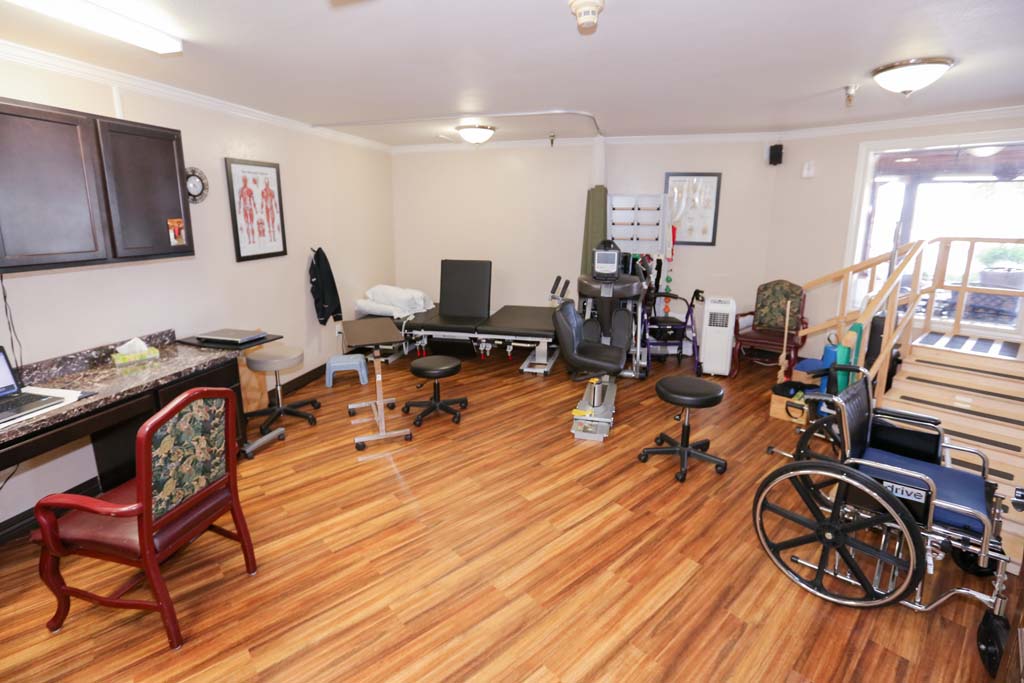
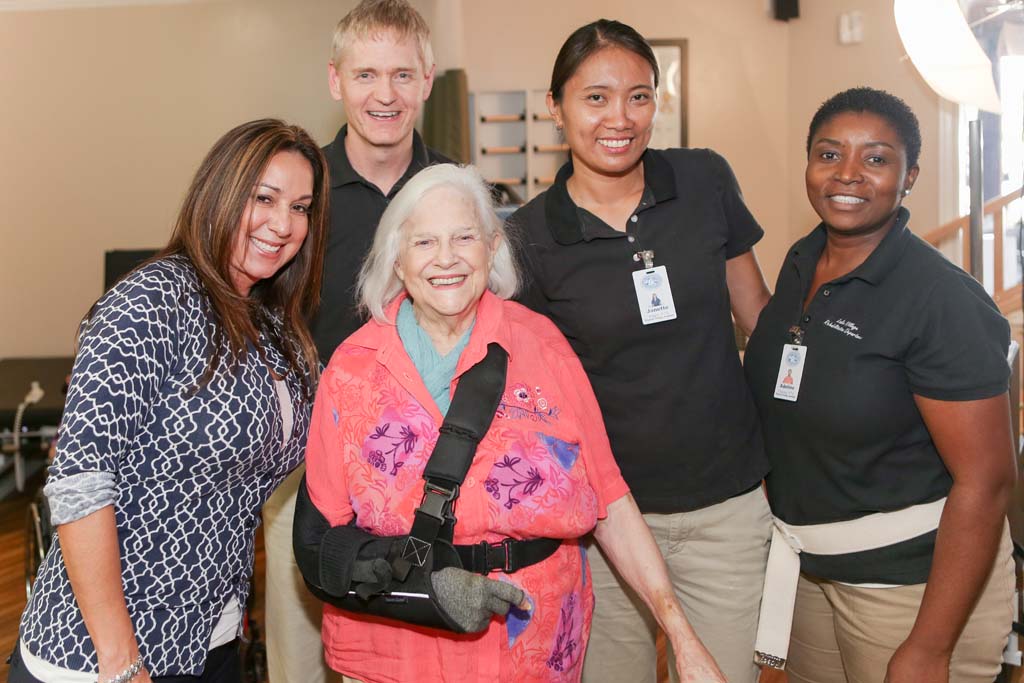
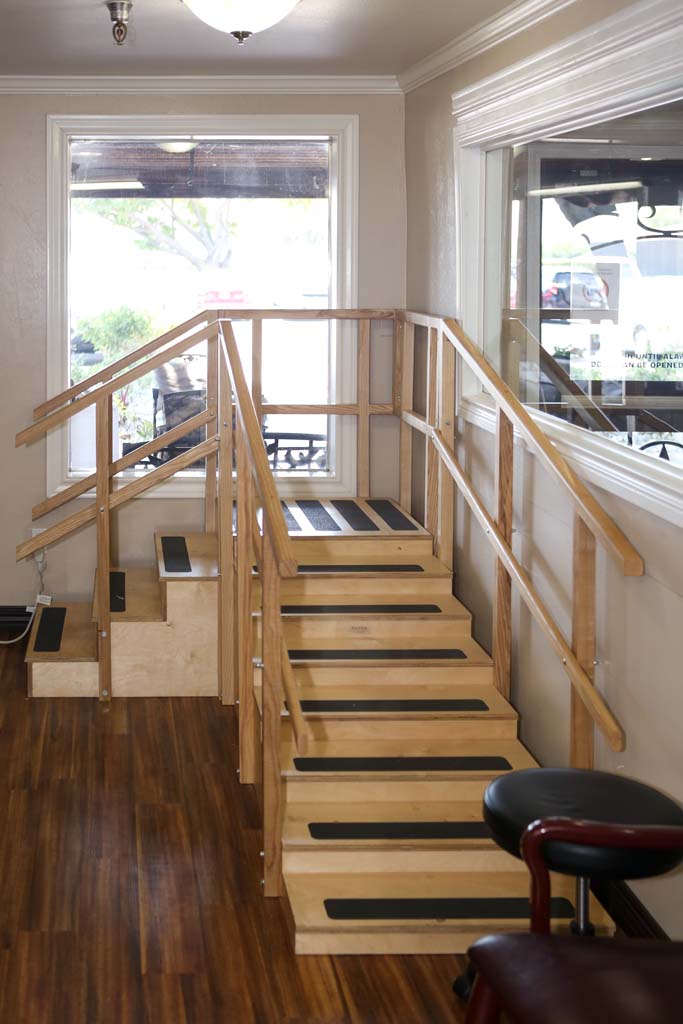
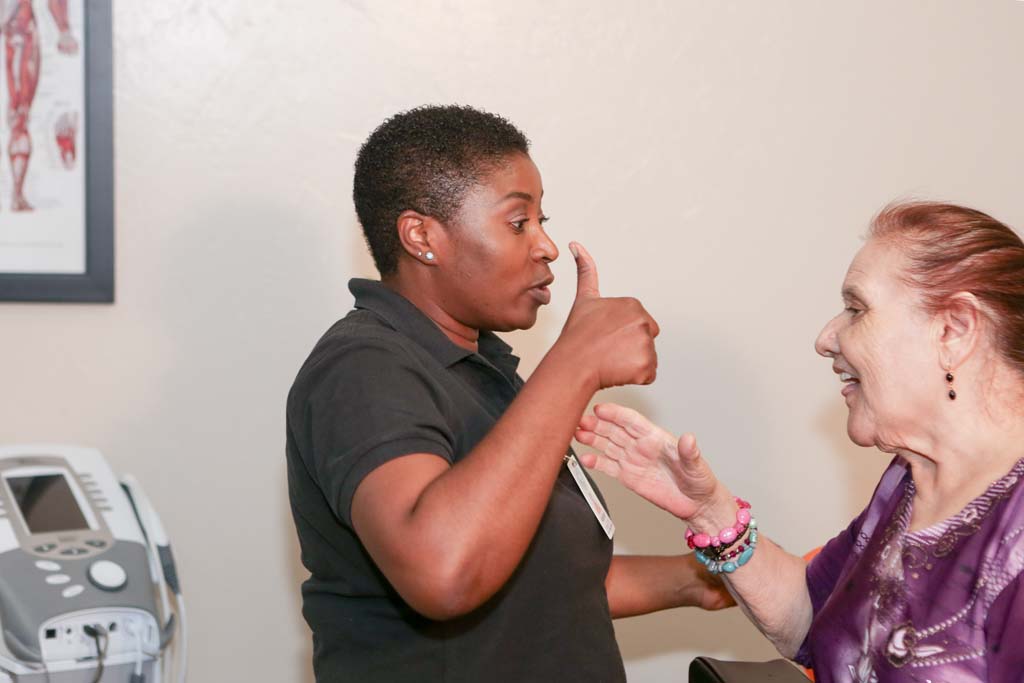
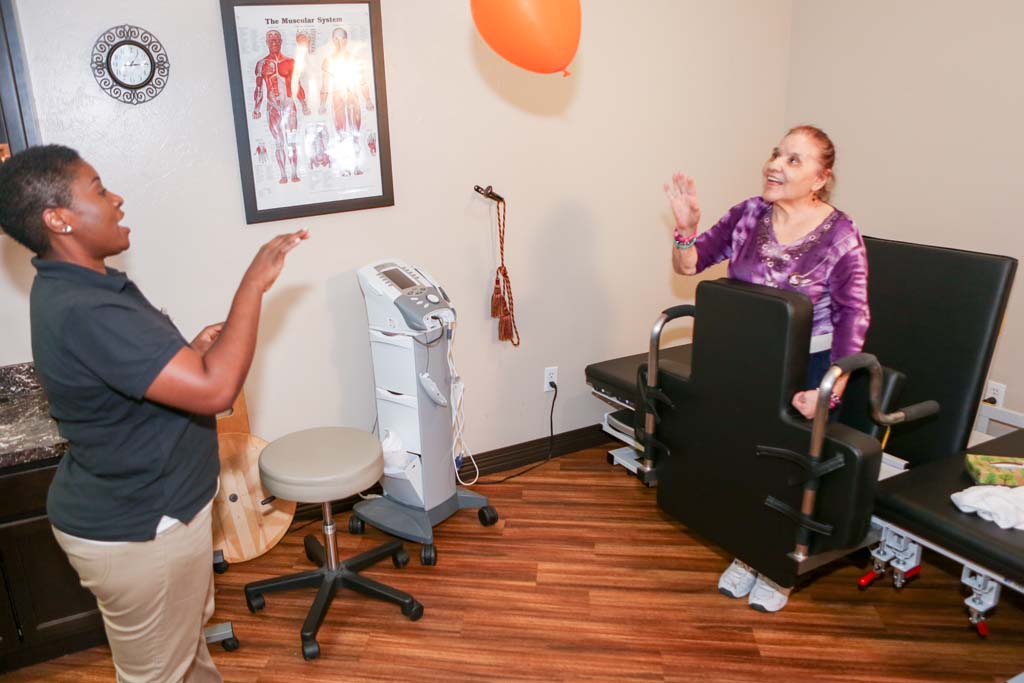
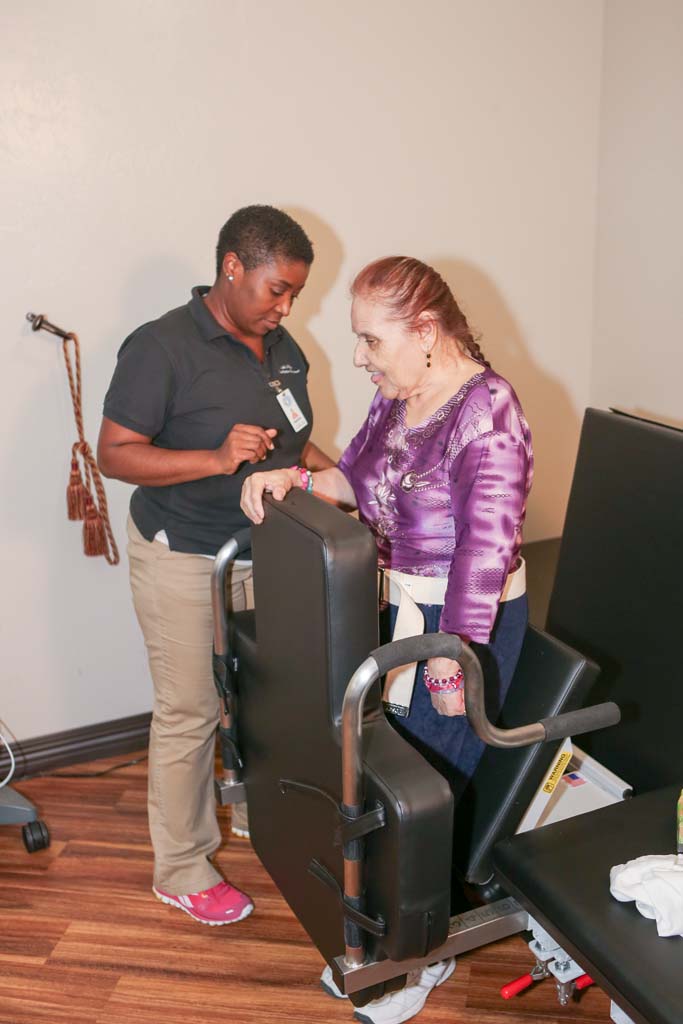
Lake Village Nursing and Rehabilitation Center also offers customizable therapy programs to care for their full-time, in-house therapy team. In addition, they also offer wound care, electrical stimulation, pulmonary programs, and speech-language therapy services.

Quality ratings

Measured by Centers for Medicare & Medicaid Services (CMS)

Overall rating Info Official CMS rating based on health inspections, staffing and quality measures.
2/5
Texas average: 3.0/5
Health Inspection Info Official CMS rating based on deficiencies found during state health inspections.
3/5
Texas average: 2.9/5
Staffing Info Official CMS rating based on nurse staffing hours per resident per day.
1/5
Texas average: 2.4/5
Quality Measures Info Official CMS rating based on clinical outcomes for residents.
4/5
Texas average: 4.0/5

Nursing care per resident

Info Average daily nursing hours per resident (adjusted for acuity). Higher values indicate more nursing time per resident.
3h 11m per day

This home provides 15% less nursing time per resident than the Texas average.

Texas average: 3h 46m per day

Staffing hours breakdown

Info Hours of care per resident per day, broken down by staff type. Data from CMS Medicare.
Staff type Facility State avg National avg
Registered Nurse (RN) Info Registered nurse hours per resident per day. 8m per day 21m per day 29m per day

Capacity and availability

Medium-capacity home

Offers a balance of services and community atmosphere.

Total beds 120

This home usually has availability

Lower occupancy suggests more openings may be available.

Lower demand than the Texas average
Occupancy rate 66.5%
Residents per day (avg) 71
Occupancy rate
66.5%
Residents per day (avg)
71

Who this home usually serves

TYPE OF STAY

Primarily short stays

Residents typically stay for brief periods, with frequent admissions and discharges throughout the year.

Might be optimal for
Post-acute recovery Temporary care Transitional stays

Breakdown by payment type

Medicare

29% of new residents, usually for short-term rehab.

Typical stay 28 days

Private pay

61% of new residents, often for short stays.

Typical stay 1 - 2 months

Medicaid

9% of new residents, often for long-term daily care.

Typical stay 1 - 2 years

Finances and operations

Governmental community
Operated by state authorities.
Home revenue
$15.0M
Surplus of revenue
$2.0M
Governmental community Operated by state authorities.
Home revenue
$14,964,523.00
Surplus of revenue
$2,029,502.00
Payroll costs Info The portion of the home's budget spent on staff, including nurses, caregivers, and other employees who support care and operations.
$4.8M
32.4% of revenue
Other operating costs Info All remaining costs needed to run the home, such as food, utilities, building maintenance, supplies and administrative expenses.
$8.1M
Total costs $12.9M
Bed community size
120-bed community
A larger shared setting that may offer more common spaces and organized community services.
Years in operation
49 years in operation
A longer operating history, which may indicate experience navigating regulations and delivering ongoing care.
Walk Score
Walk Score: 38 / 100
Somewhat walkable. A few nearby services may be reachable on foot, but most trips require transportation.

Services

Medicare/medicaid

About this community

License details

Facility type
Nursing
Issuance January 4, 2023
Expiration January 4, 2026
County: DENTON

Additional licensing details

License number: 147564
Year opened: 10/20/1976

Ownership & operating entity

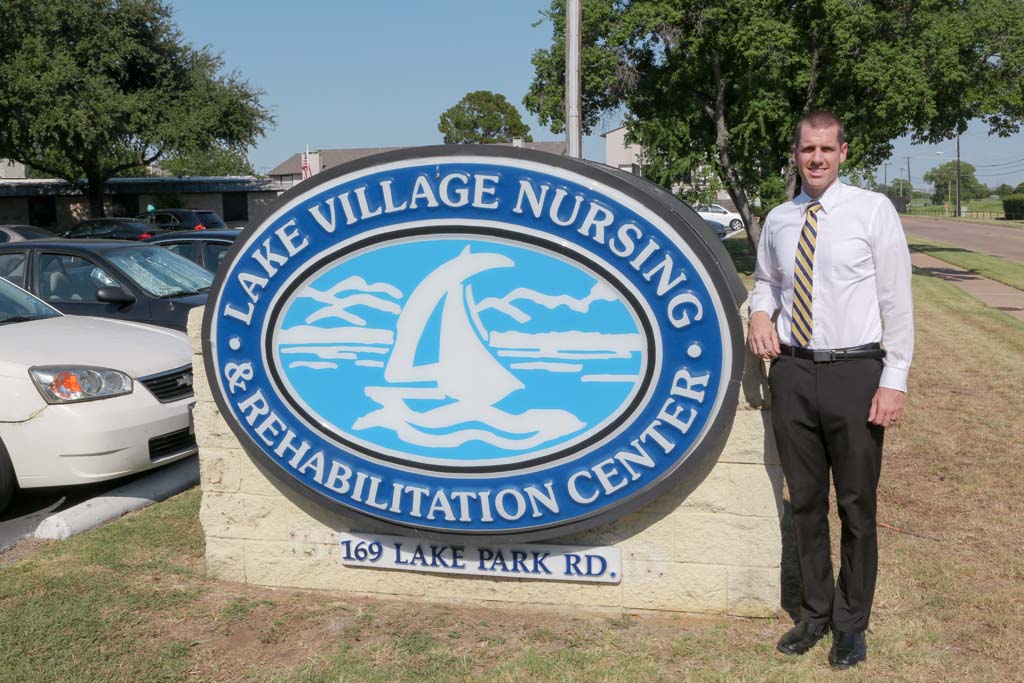
Lake Village Nursing & Rehabilitation Center is administrated by ALLEN MALL.

Management company: GRAND VILLA PHX, INC
Owner: EASTLAND MEMORIAL HOSPITAL DISTRICT
Ownership type: HOSPITAL DISTRICT/AUTHORITY

Type Of Units

Medicare
10 units
Medicaid and Medicare
102 units
Total beds
120 units

Staffing

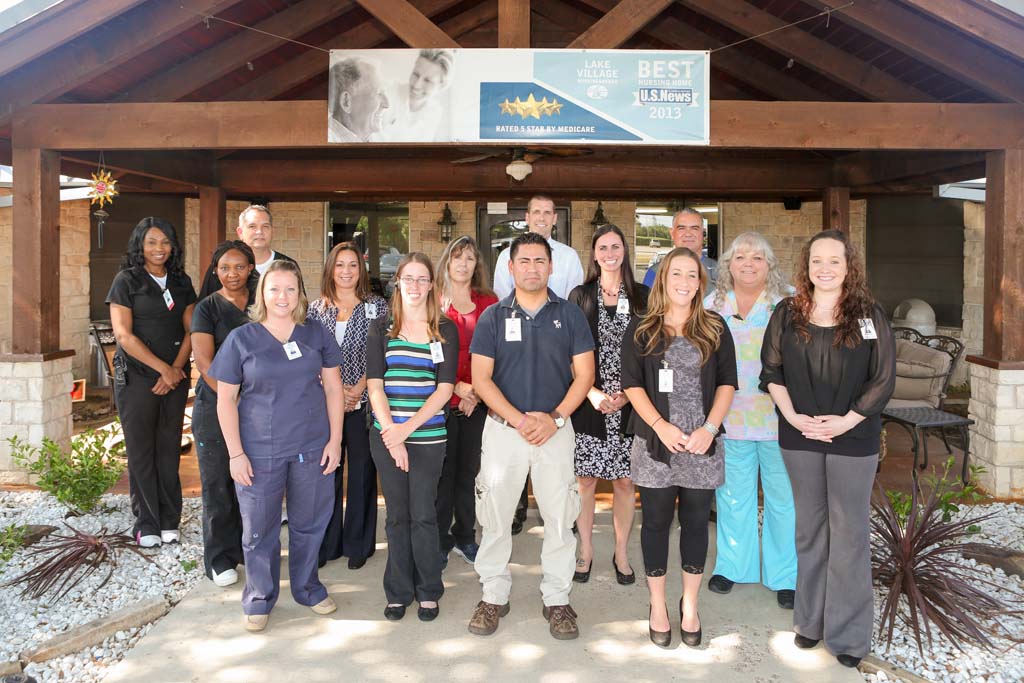
Key information about the people who lead and staff this community.

Leadership

Administrator email: [email protected]

Care Services

Nursing Services
Rehabilitation Services
Skilled Nursing
Licensed Nurses/CNAs
24-Hour Staffing

All Levels of Care

Skilled Nursing
Rehabilitation

Types of Care at Lake Village Nursing & Rehabilitation Center

Skilled Nursing
Contact Lake Village Nursing & Rehabilitation Center

Health Inspection History

Inspections
Total health inspections 5

Texas average 7.4


Last Health inspection on Sep 2025

Total health citations 24
Citations per inspection
4.8

Health citations are formal notices following inspections when they fail to comply with safety and care standards.

3 of 24 citations resulted from standard inspections; 4 of 24 resulted from complaint investigations; and 17 of 24 came from combined inspections (standard and complaint).

Breakdown of citation severity (last 3 years)
Critical Health citations More info 1
50% better than Texas average

Texas average: 2


Serious Health citations More info 0
100% better than Texas average

Texas average: 0.4

1 critical citation More info Texas average: 2

0 serious citations More info Texas average: 0.4

23 moderate citations More info Texas average: 23

0 minor citations More info Texas average: 0.4
Citations history (last 3 years)
Infection Control moderate citation Sep 16, 2025

Care Planning moderate citation Sep 16, 2025

Infection Control moderate citation Mar 06, 2025
Corrected

Pharmacy moderate citation Mar 06, 2025
Corrected

Compare Nursing Homes around Lewisville

The information below is reported by the Texas Health and Human Services Commission.
Lake Village Nursing & Rehabilitation Center
AL

Assisted Living For seniors needing help with daily tasks but not full-time nursing.

SNF

Nursing Homes 24/7 care needed

Lewisville
112
38
GRAND VILLA PHX, INC.
66.5%
$14,954,417.00
$4,848,518.00
32.4%
71.40
2/5
3.1899
3/5
1/5
4/5
2
24
1
-51%
-12%
+5%
Vista Ridge Nursing and Rehabilitation
AL

Assisted Living For seniors needing help with daily tasks but not full-time nursing.

SNF

Nursing Homes 24/7 care needed

Lewisville
132
52
PATEL, MANOJ
70.9%
$13,825,432.00
$4,668,490.00
33.8%
88.50
1/5
3.1005
2/5
1/5
4/5
1
18
1
-24%
-15%
+12%

Places of interest near Lake Village Nursing & Rehabilitation Center

Address 2.2 miles from city center — 1.89 miles to nearest hospital (Medical City Lewisville)

Address 169 Lake Park Rd, Lewisville, TX 75057

Calculate Travel Distance to Lake Village Nursing & Rehabilitation Center

Add your location

Address

Staffing Data

Source: CMS Payroll-Based Journal (Q2 2025)

164
Total Staff
120
Employees
44
Contractors
33,780
Total Hours (Quarter)
43
Avg Staff/Day
8.6
Avg Shift (hrs)
Nursing Staff Breakdown
Role Count Avg Shift (hrs) Uses Contractors?
Registered Nurse 6 10.4 Yes
Licensed Practical Nurse 27 9.8 Yes
Certified Nursing Assistant 61 8.7 Yes
Staff by Category
Administration
2 staff
5.9hs shift avg
Nursing Staff
107 staff
9.1hs shift avg
Physicians & Practitioners
6 staff
8.4hs shift avg
Therapy Services
36 staff
8.4hs shift avg
Activities & Recreation
0 staff
0hs shift avg
Social Services
8 staff
8.2hs shift avg
Dietary Services
1 staff
8.1hs shift avg
Other Services
4 staff
8hs shift avg
Contractor Analysis
1.8%
of total hours from contractors
605 contractor hours this quarter
Licensed Practical Nurse: 7 Certified Nursing Assistant: 29 Registered Nurse: 1 Medication Aide/Technician: 5 Medical Director: 1 Occupational Therapy Assistant: 1
Role Employees Contractors Total Staff Total Hours Days Worked % of Days Avg Shift (hrs)
Certified Nursing Assistant 32 29 61 9,800 91 100% 8.7
Licensed Practical Nurse 20 7 27 4,538 91 100% 9.8
Speech Language Pathologist 8 0 8 3,147 89 98% 9
Physical Therapy Aide 14 0 14 2,830 91 100% 7.9
Qualified Social Worker 8 0 8 2,397 86 95% 8.2
Respiratory Therapy Technician 6 0 6 2,062 78 86% 8.7
Registered Nurse 5 1 6 1,766 89 98% 10.4
Physical Therapy Assistant 7 0 7 1,756 78 86% 8.2
Dental Services Staff 4 0 4 1,288 65 71% 8
Medication Aide/Technician 5 5 10 1,075 78 86% 7.7
RN Director of Nursing 3 0 3 916 61 67% 8.6
Nurse Practitioner 1 0 1 585 65 71% 9
Dietitian 1 0 1 533 66 73% 8.1
Administrator 1 0 1 520 65 71% 8
Clinical Nurse Specialist 5 0 5 510 43 47% 7.8
Medical Director 0 1 1 30 29 32% 1
Occupational Therapy Assistant 0 1 1 27 6 7% 4.5

Facility Characteristics

Source: CMS Long-Term Care Facility Characteristics (Data as of Jan 2026)

Total census
72 residents
Residents by payment source
Medicare
3 residents (4.2%)
Medicaid
44 residents (61.1%)
Private pay or other
25 residents (34.7%)
Programs & Services
Residents' Group

Residents meet regularly to discuss policies, care quality, and activities

Active Resident Council

Organized group of residents that meets regularly to discuss facility policies, quality of life, and activities.

Quality of care over time

These measures show how residents usually do over time at this home, based on health outcomes and preventive care.

High-risk clinical events score Info A composite score based on pressure ulcers, falls with injury, weight loss, walking ability decline, and activities of daily living decline. 13.4
55% worse than Texas average

Texas average: 8.6

Functional decline score Info A composite score based on activities of daily living decline, walking ability decline, and incontinence. 26.6
66% worse than Texas average

Texas average: 16.0

Long-stay resident measures
Above average Texas avg: 4.2 Info CMS star rating based on long-stay quality measure performance. 5 stars = significantly above average, 1 star = significantly below average.
Need for Help with Daily Activities Increased Info Percent of long-stay residents whose need for help with daily activities has increased 39.7%
146% worse than Texas average

Texas average: 16.2%

Walking Ability Worsened Info Percent of long-stay residents whose ability to move independently worsened 22.5%
39% worse than Texas average

Texas average: 16.2%

Low Risk Residents with Bowel/Bladder Incontinence Info Percent of low risk long-stay residents who lose control of their bowels or bladder 17.6%
13% worse than Texas average

Texas average: 15.7%

Falls with Major Injury Info Percent of long-stay residents experiencing one or more falls with major injury 1.2%
63% better than Texas average

Texas average: 3.2%

High Risk Residents with Pressure Ulcers Info Percent of long-stay high risk residents with pressure ulcers 2.0%
55% better than Texas average

Texas average: 4.4%

Urinary Tract Infection Info Percent of long-stay residents with a urinary tract infection 0.0%
100% better than Texas average

Texas average: 0.8%

Lost Too Much Weight Info Percent of long-stay residents who lose too much weight 1.4%
59% better than Texas average

Texas average: 3.5%

Depressive Symptoms Info Percent of long-stay residents who have depressive symptoms 0.9%
69% better than Texas average

Texas average: 2.9%

Antipsychotic Use Info Percent of long-stay residents who received an antipsychotic medication 8.3%
5% worse than Texas average

Texas average: 7.9%

Pneumococcal Vaccine Info Percent of long-stay residents assessed and appropriately given the pneumococcal vaccine 100.0%
In line with Texas average

Texas average: 97.3%

Influenza Vaccine Info Percent of long-stay residents assessed and appropriately given the seasonal influenza vaccine 100.0%
In line with Texas average

Texas average: 97.9%

Hospitalizations per 1,000 days Info Number of hospitalizations per 1,000 long-stay resident days. 2.38
12% worse than Texas average

Texas average: 2.13

ED visits per 1,000 days Info Number of outpatient emergency department visits per 1,000 long-stay resident days. 1.45
30% better than Texas average

Texas average: 2.07

Short-stay resident measures
Above average Texas avg: 2.9 Info CMS star rating based on short-stay quality measure performance. 5 stars = much above average, 1 star = much below average.
Pneumococcal Vaccine Info Percent of short-stay residents assessed and appropriately given the pneumococcal vaccine 100.0%
11% better than Texas average

Texas average: 90.4%

Antipsychotic medication increase Info Percent of short-stay residents who newly received an antipsychotic medication 0.0%
100% better than Texas average

Texas average: 1.4%

Influenza Vaccine Info Percent of short-stay residents assessed and appropriately given the seasonal influenza vaccine 95.1%
8% better than Texas average

Texas average: 88.0%

Re-hospitalized after SNF stay Info Percentage of short-stay residents who were re-hospitalized after their nursing home admission. 22.3%
14% better than Texas average

Texas average: 25.9%

Emergency department visits Info Percentage of short-stay residents who had an outpatient emergency department visit. 4.8%
60% better than Texas average

Texas average: 12.0%

Falls with major injury Info Percentage of SNF residents who experience falls with major injury during their stay. 1.6%
109% worse than Texas average

Texas average: 0.8%

Ability to care for self at discharge Info Percentage of residents at or above expected ability to care for themselves at discharge. 42.1%
22% worse than Texas average

Texas average: 53.7%

Successful return to home or community Info Rate of successful return to home or community from a skilled nursing facility. 43.6%
14% worse than Texas average

Texas average: 50.6%

Penalties and fines

Federal penalties imposed by CMS for regulatory violations, including civil money penalties (fines) and denials of payment for new Medicare/Medicaid admissions.

Source: CMS Penalties Database (Data as of Jan 2026)

Total fines amount $25K
69% lower than Texas average

Texas average: $80K

Number of fines 1
60% fewer fines than Texas average

Texas average: 2.5

Payment Denials Info Serious action where Medicare and/or Medicaid temporarily stops payments for new residents until issues are fixed. 1
354% more payment denials than Texas average

Texas average: 0.2

Fines amount comparison
This facility $25K
Texas average $80K
Penalty History

Penalties are imposed by CMS for violations of federal nursing home regulations.

Civil Money Penalty Info Fines imposed for noncompliance, which can be assessed per day or per instance of violation. Jan 26, 2024
$25K
Payment Denial Info Serious action where Medicare and/or Medicaid temporarily stops payments for new residents until issues are fixed. Jan 26, 2024
8 days

Last updated: Jan 2026

Guides for Better Senior Living

Care Cost Calculator: See Prices in Your Area

Nursing Home Data Explorer

Don’t Wait Too Long: 7 Red Flag Signs Your Parent Needs Assisted Living Now

The True Cost of Assisted Living in 2025 – And How Families Are Paying For It

Understanding Senior Living Costs: Pricing Models, Discounts & Financial Assistance

Financial Aid for Texas Seniors

Get financial aid guidance

Community Care for the Aged and Disabled (CCAD)

TX Medicaid CCAD

Age 65+ or disabled, Texas resident, Medicaid-eligible, care need (not always nursing home level).

~$2,829/month (300% FBR, individual).

$2,000 (individual), $3,000 (couple).

Large state; rural access challenges.

Texas Community Care Services

TX CCS

Age 60+, Texas resident, at risk of decline.

~$2,000/month (individual, varies).

$5,000 (individual).

Limited funding; high demand in urban areas.

Area Agency on Aging (AAA) Services

Texas AAA Services

Age 60+, TX resident; no income/asset limits.

None; donations encouraged.

Not assessed.

28 AAAs; includes Meals on Wheels in some areas.

Medicare Savings Program (MSP)

Texas Medicare Savings Program

Age 65+ or disabled, TX resident, Medicare Part A/B.

~$2,510/month (QMB), ~$3,380/month (SLMB), ~$3,598/month (QI)—individual.

$9,430 (individual), $14,130 (couple).

Includes Extra Help for Part D; no waitlist.

Low-Income Home Energy Assistance Program (LIHEAP)

Texas Comprehensive Energy Assistance Program (CEAP)

Age 60+ prioritized, TX resident, low-income.

~$3,970/month (185% FPL).

Not assessed.

Priority for elderly/disabled; covers gas, electric, propane.

Family Caregiver Support Program (FCSP)

Texas Family Caregiver Support Program

Caregivers of 60+ needing care or 55+ caregivers of others; TX resident; 2+ ADLs.

No strict cap; prioritizes low-income (~$24,980/year).

Not assessed.

High rural demand; includes grandparent caregivers.

Senior Community Service Employment Program (SCSEP)

Texas SCSEP

Age 55+, unemployed, low-income, TX resident.

~$1,983/month (125% FPL).

Not specified.

Priority for veterans, rural residents; AARP partnership.

VA Aid and Attendance (A&A) and Housebound Benefits

Texas VA Aid and Attendance/Housebound

Age 65+ or disabled veteran/spouse, TX resident, wartime service, ADL help (A&A) or homebound.

Net income < ~$1,984/month (veteran with dependent, A&A); pension offsets income.

~$155,356 (net worth).

High veteran population; supports rural/urban needs.

Property Tax Exemption for Seniors

Texas Senior Property Tax Exemption

Age 65+, TX resident, homeowner (homestead).

None; tax-based eligibility.

Not assessed.

$25,000+ exemption; optional freeze in some counties; saves ~$500-$1,000/year.

Senior Farmers’ Market Nutrition Program (SFMNP)

Texas SFMNP

Age 60+, TX resident, low-income.

~$2,322/month (185% FPL).

Not assessed.

Vouchers (~$50/season); serves ~20,000 via 28 AAAs.