Legend Oaks Rehabilitation and Healthcare – Kyle

Nursing Home

Legend Oaks Rehabilitation and Healthcare – Kyle

1640 Fairway, Kyle, TX 78640 View Map
Nursing Home
icon
Care Cost Calculator: See Prices in Your Area Care Cost Calculator: See Prices in Your Area icon
Overview of Legend Oaks Rehabilitation and Healthcare – Kyle

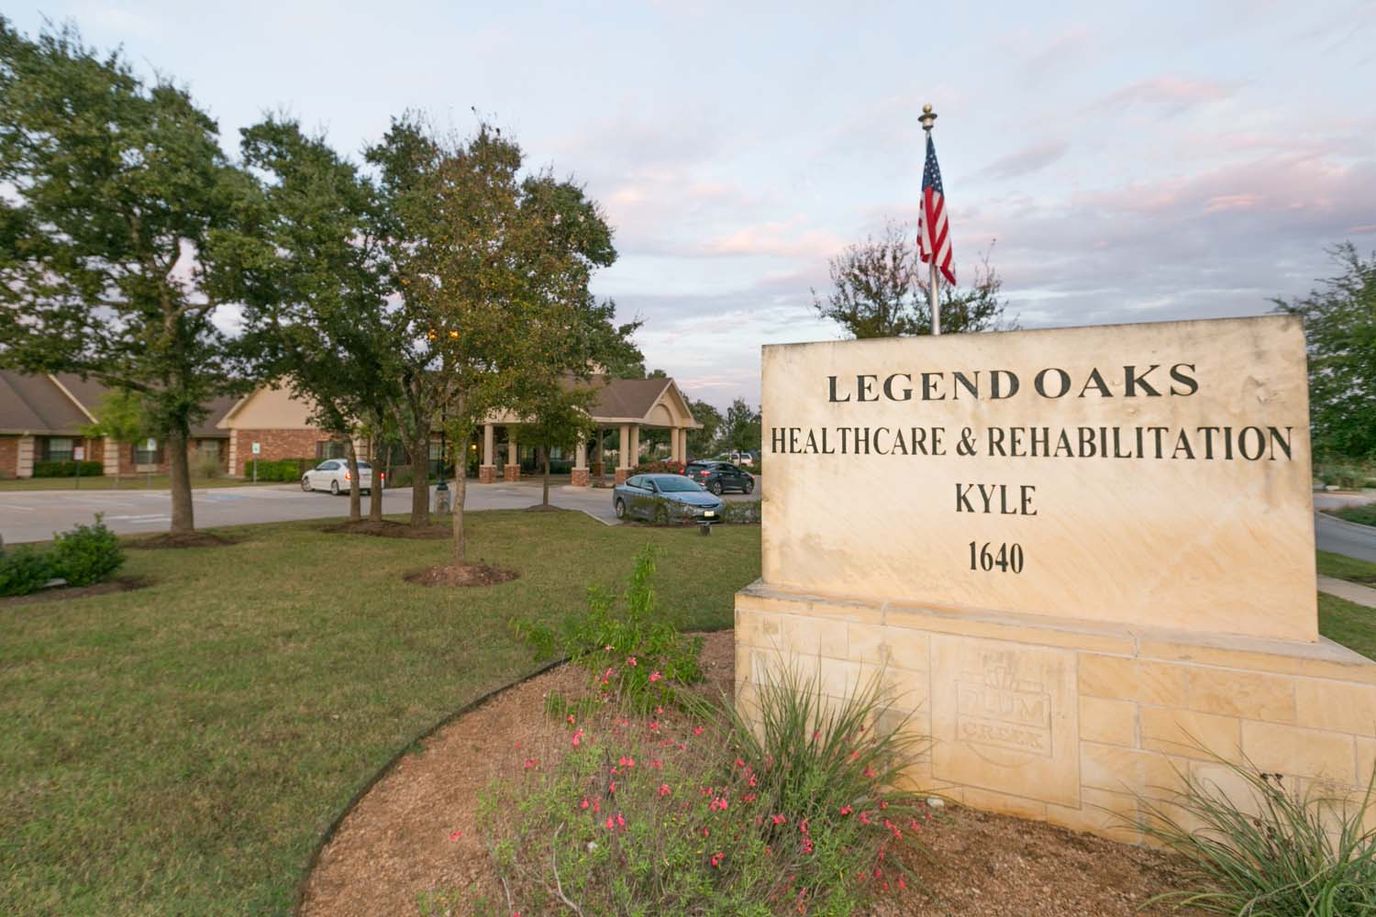
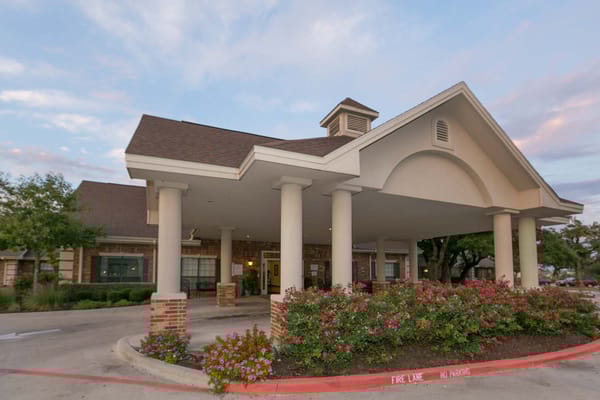
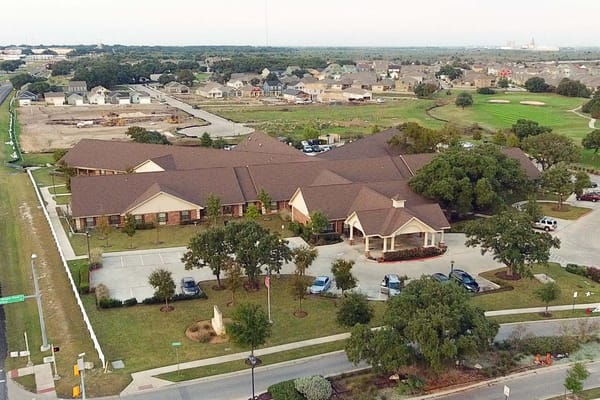
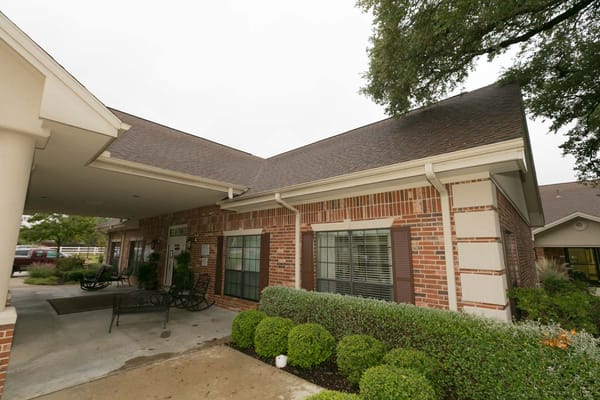
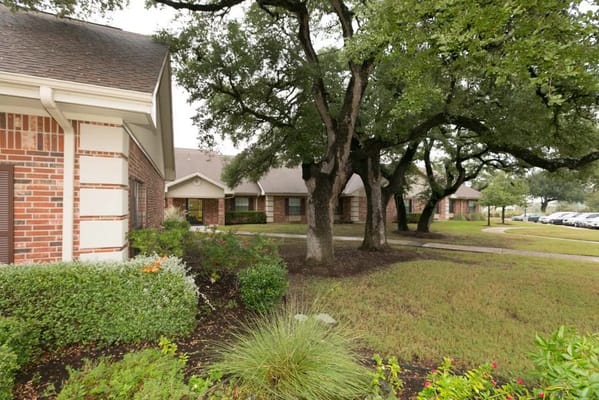
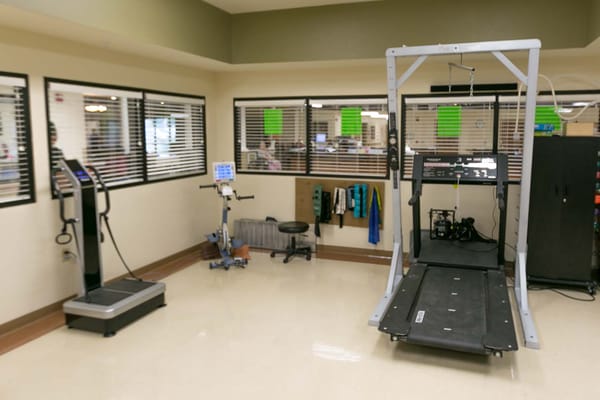
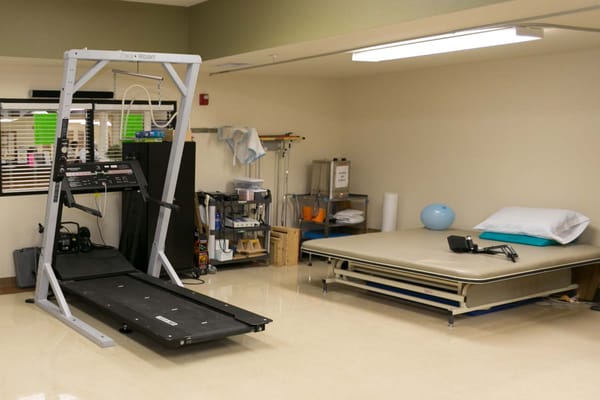
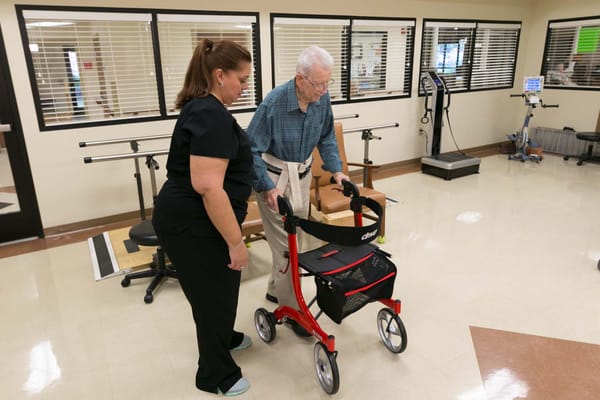
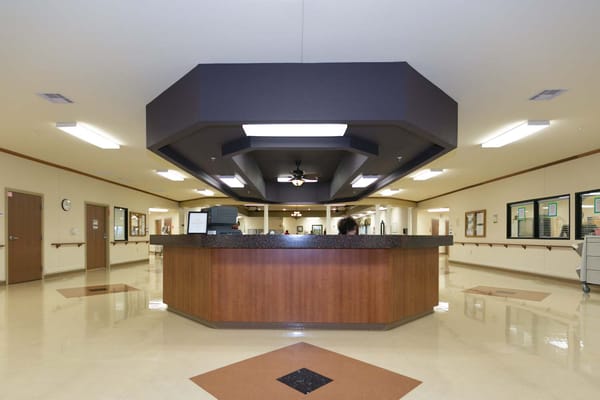
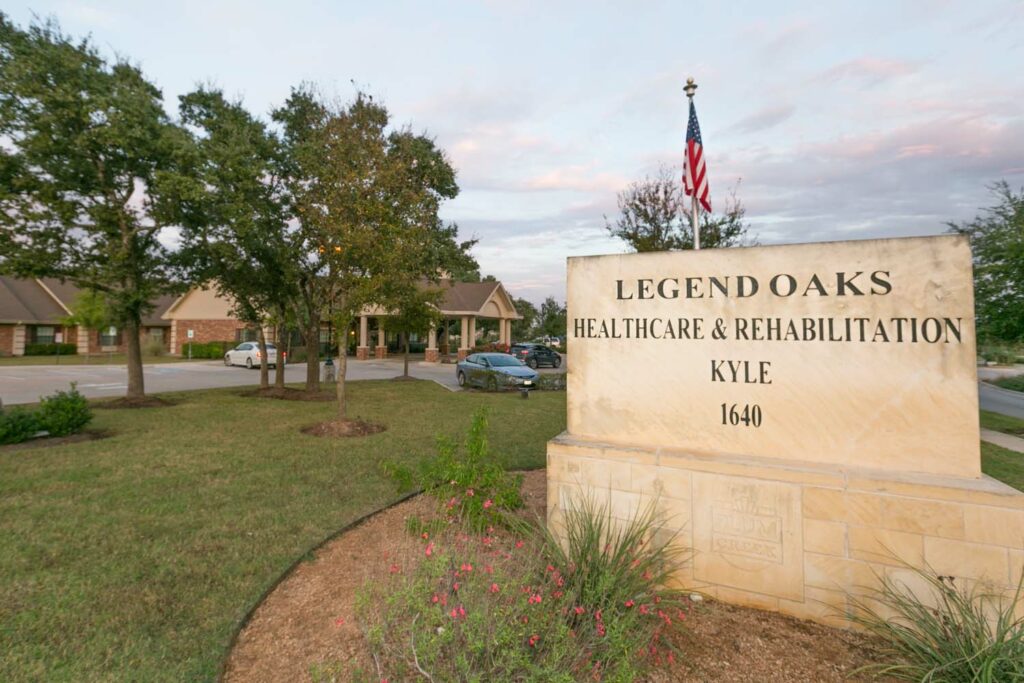
In the heart of Kyle, Texas, sits Legend Oaks Rehabilitation and Healthcare – Kyle, a for-profit nursing home dedicated to providing exceptional care and services. Certified by Medicaid and Medicare, this facility stands equipped to offer both short-term rehabilitation and long-term care services, boasting a capacity of 126 beds inclusive of private and semi-private rooms. It’s not just a facility; it’s a place where residents rediscover their strength and mobility, forging a new home filled with care and support.
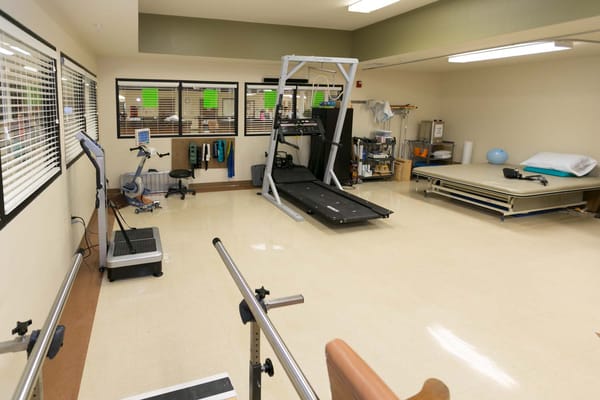
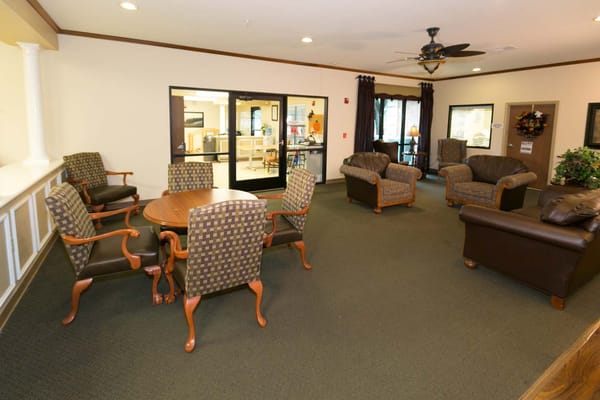
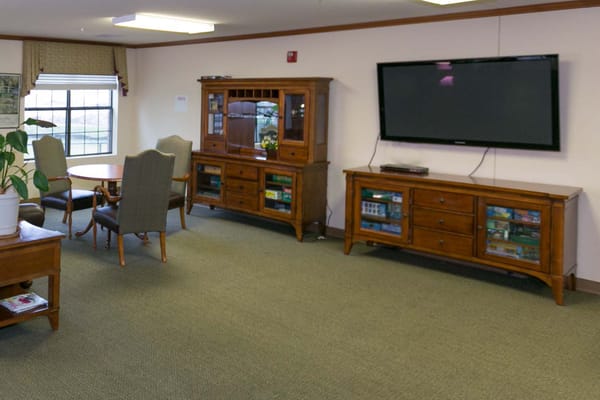
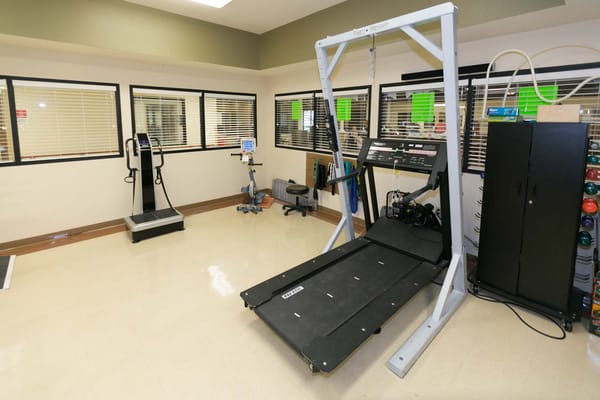
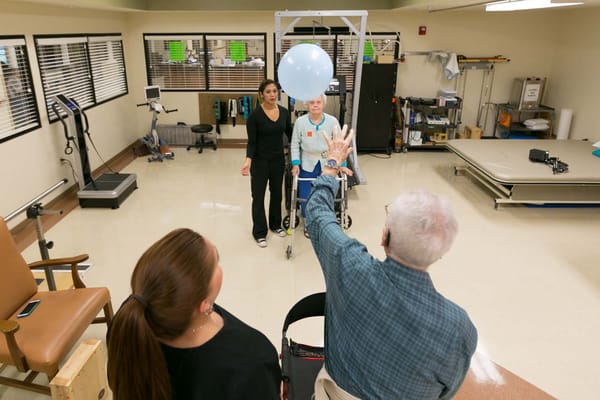
At Legend Oaks, a talented and devoted staff collaborates closely with residents, their families, and healthcare providers to craft comprehensive care and treatment plans. The facility’s in-house therapy team blends cutting-edge techniques with hands-on approaches, ensuring a tailored and effective approach to rehabilitation and care. Beyond the exceptional care, Legend Oaks fosters an environment brimming with diverse activities curated to suit individual preferences, promoting an active lifestyle for residents. 

Quality ratings

Measured by Centers for Medicare & Medicaid Services (CMS)

Overall rating Info Official CMS rating based on health inspections, staffing and quality measures.
3/5
Texas average: 2.8/5
Health Inspection Info Official CMS rating based on deficiencies found during state health inspections.
3/5
Texas average: 2.8/5
Staffing Info Official CMS rating based on nurse staffing hours per resident per day.
2/5
Texas average: 2.1/5
Quality Measures Info Official CMS rating based on clinical outcomes for residents.
4/5
Texas average: 3.8/5

Nursing care per resident

Info Average daily nursing hours per resident (adjusted for acuity). Higher values indicate more nursing time per resident.
3h 25m per day

This home provides 6% less nursing time per resident than the state average.

Texas average: 3h 38m per day

Staffing hours breakdown

Info Hours of care per resident per day, broken down by staff type. Data from CMS Medicare.
Staff type Facility State avg National avg
Registered Nurse (RN) Info Registered nurse hours per resident per day. 18m per day 26m per day 41m per day
LPN / LVN Info Licensed Practical Nurse / Licensed Vocational Nurse hours per resident per day. 58m per day 57m per day 52m per day
Nurse Aide Info Nurse aide hours per resident per day. 1h 59m per day 2h 1m per day 2h 21m per day
Total Nursing (Weekend) Info Total number of nurse staff hours per resident per day on weekends. 2h 47m per day 2h 59m per day 3h 26m per day
Physical Therapist Info Physical therapist staff hours per resident per day. 13m per day 4m per day 4m per day
RN (Weekend) Info Registered nurse hours per resident per day on weekends. 10m per day 21m per day 29m per day

Capacity and availability

Medium-capacity home

Offers a balance of services and community atmosphere.

Total beds 126

This home usually has limited availability

Occupancy is moderate, suggesting balanced demand.

Similar demand to the Texas average
Occupancy rate 86.1%
Residents per day (avg) 113
Occupancy rate
86.1%
Residents per day (avg)
113

Who this home usually serves

TYPE OF STAY

Primarily short stays

Residents typically stay for brief periods, with frequent admissions and discharges throughout the year.

Might be optimal for
Post-acute recovery Temporary care Transitional stays

Breakdown by payment type

Medicare

29% of new residents, usually for short-term rehab.

Typical stay 24 days

Private pay

69% of new residents, often for short stays.

Typical stay 1 months

Medicaid

2% of new residents, often for long-term daily care.

Typical stay 5 years

Finances and operations

Governmental home
Facility District
Home revenue
$16.1M
Surplus of revenue
$1.2M
Governmental home Facility District
Home revenue
$16,057,092.00
Surplus of revenue
$1,219,163.00
Payroll costs Info The portion of the home's budget spent on staff, including nurses, caregivers, and other employees who support care and operations.
$7.0M
43.3% of revenue
Other operating costs Info All remaining costs needed to run the home, such as food, utilities, building maintenance, supplies and administrative expenses.
$7.9M
Total costs $14.8M
Bed community size
126-bed community
A larger shared setting that may offer more common spaces and organized community services.
Years in operation
15 years in operation
A community with a solid operating history and experience delivering ongoing care.
Walk Score
Walk Score: 26 / 100
Somewhat walkable. A few nearby services may be reachable on foot, but most trips require transportation.

Services

MEDICARE/MEDICAID

About this community

Facility Type
Nursing
License Date
January 4, 2023
License Expiration
January 4, 2026

Additional licensing details

License number: 147275
Year opened: 2/8/2011
County: HAYS

Ownership & operating entity

Legend Oaks Rehabilitation and Healthcare – Kyle is administrated by GABRIEL BARRAZA.

Management company: TREATY HEALTHCARE INC
Owner: GUADALUPE COUNTY HOSPITAL BOARD
Ownership type: HOSPITAL DISTRICT/AUTHORITY

Type Of Units

Medicaid and Medicare
126 units
Total beds
126 units

Staffing

Key information about the people who lead and staff this community.

Leadership

Administrator email: [email protected]

Care Services

Accepts Medicaid
Accepts Medicare
Nursing Services
Rehabilitation Services
Skilled Nursing
Licensed Nurses/CNAs

Programs & Activities

Specific Programs
In-house Therapy, Skilled Nursing, Stay Active, Activities & Excursions, Church Services
Religious Services
Yes

Types of Care at Legend Oaks Rehabilitation and Healthcare – Kyle

Memory Care Nursing Home
Contact Legend Oaks Rehabilitation and Healthcare – Kyle

Access & Eligibility

Ways to qualify for care at this community, including accepted programs and payment options.

Medicaid Accepted

This facility is certified for eligible Medicaid services.

Medicare Accepted

This facility is certified for eligible Medicare services.

Payment & Funding Options

Medicaid Medicare

Compare Nursing Homes around Kyle

The information below is reported by the Texas Health and Human Services Commission.
Legend Oaks Rehabilitation and Healthcare – Kyle
SNF

Nursing Home 24/7 care needed

AL

Assisted Living For seniors needing help with daily tasks but not full-time nursing.

Kyle
126
No
26
TREATY HEALTHCARE, INC
86.1%
$16,055,694.00
$6,951,299.00
43.3%
113.40
3/5
3.4208
3/5
2/5
4/5
25
-37%
-6%
+36%

Places of interest near Legend Oaks Rehabilitation and Healthcare – Kyle

Address 2.7 miles from city center — 2.34 miles to nearest hospital (Ascension Seton Hays)

Address 1640 Fairway, Kyle, TX 78640

Calculate Travel Distance to Legend Oaks Rehabilitation and Healthcare – Kyle

Add your location

Address

Staffing Data

Source: CMS Payroll-Based Journal (Q2 2025)

170
Total Staff
167
Employees
3
Contractors
45,135
Total Hours (Quarter)
62
Avg Staff/Day
8
Avg Shift (hrs)
Nursing Staff Breakdown
Role Count Avg Shift (hrs) Uses Contractors?
Registered Nurse89.4 No
Licensed Practical Nurse239.8 No
Certified Nursing Assistant747.6 No
Staff by Category
Administration
2 staff
8.4hs shift avg
Nursing Staff
119 staff
8.4hs shift avg
Physicians & Practitioners
6 staff
8.7hs shift avg
Therapy Services
29 staff
6.9hs shift avg
Activities & Recreation
1 staff
6hs shift avg
Social Services
8 staff
7hs shift avg
Dietary Services
3 staff
7.3hs shift avg
Other Services
2 staff
7hs shift avg
Contractor Analysis
0.5%
of total hours from contractors
228 contractor hours this quarter
Medical Director: 1 Occupational Therapy Assistant: 1 Occupational Therapy Aide: 1
Role Employees Contractors Total Staff Total Hours Days Worked % of Days Avg Shift (hrs)
Certified Nursing Assistant7407417,02791100%7.6
Licensed Practical Nurse230237,95291100%9.8
Medication Aide/Technician100102,91291100%9
Physical Therapy Aide7072,18591100%7.4
Respiratory Therapy Technician7072,0748492%6.5
Physical Therapy Assistant8081,9008897%6.5
Speech Language Pathologist5051,8327077%7.2
Registered Nurse8081,7938695%9.4
Qualified Social Worker8081,7557684%7
RN Director of Nursing4041,6826571%9
Clinical Nurse Specialist4041,2586673%8.6
Dental Services Staff2026476470%7
Nurse Practitioner2025946571%9
Administrator1015206571%8
Dietitian2025046369%8
Other Dietary Services Staff1011853134%6
Medical Director0111101011%11
Therapeutic Recreation Specialist101901516%6
Occupational Therapy Assistant0118889%11
Occupational Therapy Aide0113133%10.2

Health Inspection History

Inspections
Total health inspections 7

Texas average 7.4


Last Health inspection on Nov 2024

Total health citations 25
Citations per inspection
3.57

Health citations are formal notices following inspections when they fail to comply with safety and care standards.

15 of 25 citations resulted from standard inspections; and 10 of 25 resulted from complaint investigations.

Breakdown of citation severity (last 3 years)
Critical Health citations More info 0
100% better than Texas average

Texas average: 2


Serious Health citations More info 0
100% better than Texas average

Texas average: 0.4

0 critical citations More info Texas average: 2

0 serious citations More info Texas average: 0.4

25 moderate citations More info Texas average: 23

0 minor citations More info Texas average: 0.4
Citations history (last 3 years)
Abuse/Neglect moderate citation Nov 20, 2024
Corrected

Infection Control moderate citation Nov 20, 2024
Corrected

Environmental moderate citation Sep 05, 2024
Corrected

Nutrition moderate citation Sep 05, 2024
Corrected

Facility Characteristics

Source: CMS Long-Term Care Facility Characteristics (Data as of Jan 2026)

Ownership: For-Profit Corporation
Part of: Ensign Group
Resident Census by Payment Source
107 Total Residents
Medicare 10 (9.3%)
Medicaid 57 (53.3%)
Private Pay/Other 40 (37.4%)
Programs & Services
Residents' Group
Family Engagement

Active councils help families stay involved in care decisions and facility operations.

Quality of care over time

These measures show how residents usually do over time at this home, based on health outcomes and preventive care.

High-risk clinical events score Info A composite score based on pressure ulcers, falls with injury, weight loss, walking ability decline, and activities of daily living decline. 14.9
73% worse than Texas average

Texas average: 8.6

Functional decline score Info A composite score based on activities of daily living decline, walking ability decline, and incontinence. 28.5
77% worse than Texas average

Texas average: 16.0

Long-stay resident measures
Need for Help with Daily Activities Increased Info Percent of long-stay residents whose need for help with daily activities has increased 33.0%
104% worse than Texas average

Texas average: 16.2%

Walking Ability Worsened Info Percent of long-stay residents whose ability to move independently worsened 35.3%
118% worse than Texas average

Texas average: 16.2%

Low Risk Residents with Bowel/Bladder Incontinence Info Percent of low risk long-stay residents who lose control of their bowels or bladder 17.0%
9% worse than Texas average

Texas average: 15.7%

Falls with Major Injury Info Percent of long-stay residents experiencing one or more falls with major injury 2.1%
35% better than Texas average

Texas average: 3.2%

High Risk Residents with Pressure Ulcers Info Percent of long-stay high risk residents with pressure ulcers 3.6%
20% better than Texas average

Texas average: 4.4%

Urinary Tract Infection Info Percent of long-stay residents with a urinary tract infection 0.9%
15% worse than Texas average

Texas average: 0.8%

Lost Too Much Weight Info Percent of long-stay residents who lose too much weight 0.3%
90% better than Texas average

Texas average: 3.5%

Depressive Symptoms Info Percent of long-stay residents who have depressive symptoms 1.0%
65% better than Texas average

Texas average: 2.9%

Antipsychotic Use Info Percent of long-stay residents who received an antipsychotic medication 3.1%
61% better than Texas average

Texas average: 7.9%

Pneumococcal Vaccine Info Percent of long-stay residents assessed and appropriately given the pneumococcal vaccine 97.0%
In line with Texas average

Texas average: 97.3%

Influenza Vaccine Info Percent of long-stay residents assessed and appropriately given the seasonal influenza vaccine 87.6%
11% worse than Texas average

Texas average: 97.9%

Hospitalizations per 1,000 days Info Number of hospitalizations per 1,000 long-stay resident days. 1.67
22% better than Texas average

Texas average: 2.13

ED visits per 1,000 days Info Number of outpatient emergency department visits per 1,000 long-stay resident days. 1.11
46% better than Texas average

Texas average: 2.07

Short-stay resident measures
Pneumococcal Vaccine Info Percent of short-stay residents assessed and appropriately given the pneumococcal vaccine 93.5%
In line with Texas average

Texas average: 90.4%

Antipsychotic medication increase Info Percent of short-stay residents who newly received an antipsychotic medication 0.0%
100% better than Texas average

Texas average: 1.4%

Influenza Vaccine Info Percent of short-stay residents assessed and appropriately given the seasonal influenza vaccine 94.9%
8% better than Texas average

Texas average: 88.0%

Re-hospitalized after SNF stay Info Percentage of short-stay residents who were re-hospitalized after their nursing home admission. 18.5%
29% better than Texas average

Texas average: 25.9%

Emergency department visits Info Percentage of short-stay residents who had an outpatient emergency department visit. 9.7%
19% better than Texas average

Texas average: 12.0%

Falls with major injury Info Percentage of SNF residents who experience falls with major injury during their stay. 0.8%
In line with Texas average

Texas average: 0.8%

Ability to care for self at discharge Info Percentage of residents at or above expected ability to care for themselves at discharge. 56.6%
5% better than Texas average

Texas average: 53.7%

Successful return to home or community Info Rate of successful return to home or community from a skilled nursing facility. 60.6%
20% better than Texas average

Texas average: 50.6%

Guides for Better Senior Living

Care Cost Calculator: See Prices in Your Area

Nursing Home Data Explorer

Don’t Wait Too Long: 7 Red Flag Signs Your Parent Needs Assisted Living Now

The True Cost of Assisted Living in 2025 – And How Families Are Paying For It

Understanding Senior Living Costs: Pricing Models, Discounts & Financial Assistance

Financial Aid for Texas Seniors

Get financial aid guidance

Community Care for the Aged and Disabled (CCAD)

TX Medicaid CCAD

Age 65+ or disabled, Texas resident, Medicaid-eligible, care need (not always nursing home level).

~$2,829/month (300% FBR, individual).

$2,000 (individual), $3,000 (couple).

Large state; rural access challenges.

Texas Community Care Services

TX CCS

Age 60+, Texas resident, at risk of decline.

~$2,000/month (individual, varies).

$5,000 (individual).

Limited funding; high demand in urban areas.

Area Agency on Aging (AAA) Services

Texas AAA Services

Age 60+, TX resident; no income/asset limits.

None; donations encouraged.

Not assessed.

28 AAAs; includes Meals on Wheels in some areas.

Medicare Savings Program (MSP)

Texas Medicare Savings Program

Age 65+ or disabled, TX resident, Medicare Part A/B.

~$2,510/month (QMB), ~$3,380/month (SLMB), ~$3,598/month (QI)—individual.

$9,430 (individual), $14,130 (couple).

Includes Extra Help for Part D; no waitlist.

Low-Income Home Energy Assistance Program (LIHEAP)

Texas Comprehensive Energy Assistance Program (CEAP)

Age 60+ prioritized, TX resident, low-income.

~$3,970/month (185% FPL).

Not assessed.

Priority for elderly/disabled; covers gas, electric, propane.

Family Caregiver Support Program (FCSP)

Texas Family Caregiver Support Program

Caregivers of 60+ needing care or 55+ caregivers of others; TX resident; 2+ ADLs.

No strict cap; prioritizes low-income (~$24,980/year).

Not assessed.

High rural demand; includes grandparent caregivers.

Senior Community Service Employment Program (SCSEP)

Texas SCSEP

Age 55+, unemployed, low-income, TX resident.

~$1,983/month (125% FPL).

Not specified.

Priority for veterans, rural residents; AARP partnership.

VA Aid and Attendance (A&A) and Housebound Benefits

Texas VA Aid and Attendance/Housebound

Age 65+ or disabled veteran/spouse, TX resident, wartime service, ADL help (A&A) or homebound.

Net income < ~$1,984/month (veteran with dependent, A&A); pension offsets income.

~$155,356 (net worth).

High veteran population; supports rural/urban needs.

Property Tax Exemption for Seniors

Texas Senior Property Tax Exemption

Age 65+, TX resident, homeowner (homestead).

None; tax-based eligibility.

Not assessed.

$25,000+ exemption; optional freeze in some counties; saves ~$500-$1,000/year.

Senior Farmers’ Market Nutrition Program (SFMNP)

Texas SFMNP

Age 60+, TX resident, low-income.

~$2,322/month (185% FPL).

Not assessed.

Vouchers (~$50/season); serves ~20,000 via 28 AAAs.

Who we are

Your Senior Care Partner, Every Step of the Way

We help families find affordable senior communities and unlock same day discounts, Medicaid, and Medicare options tailored to your needs.

Contact us Today