Explore Open Rooms

1 Contact details
2 What type of senior care service are you looking for?
3 What budget do you have in mind for senior care?
4 How soon do you need to find care?
5 Additional details

Thank you for your interest!

Our team will be in touch shortly to help with next steps.

Nursing Home in Middlesex County

CMS overall rating Info The Overall CMS Rating combines results from health inspections, staffing levels and quality measures. Health inspections carry the most weight. Staffing and quality scores can increase or decrease the final rating based on performance compared to state and national standards.

Life Care Center of Acton

1 Great Road, Acton, MA 01720 View map
Overview of Life Care Center of Acton

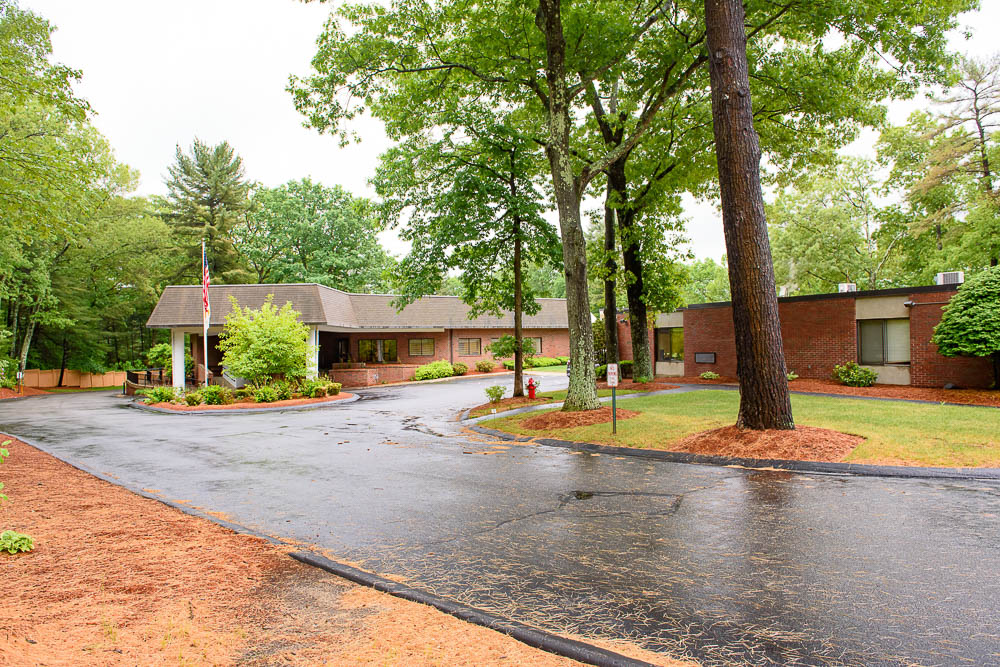
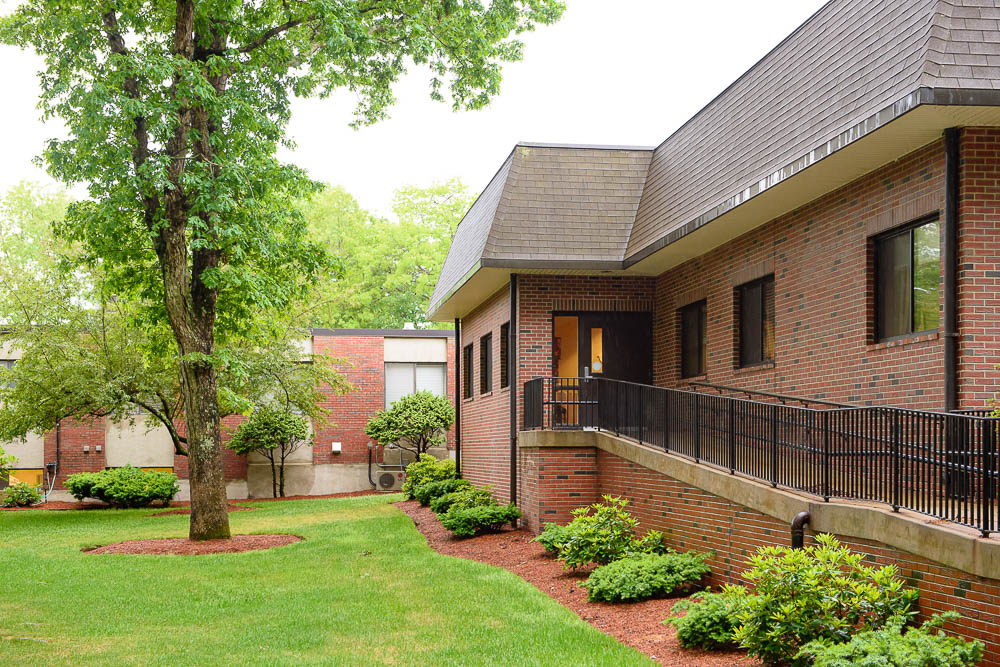
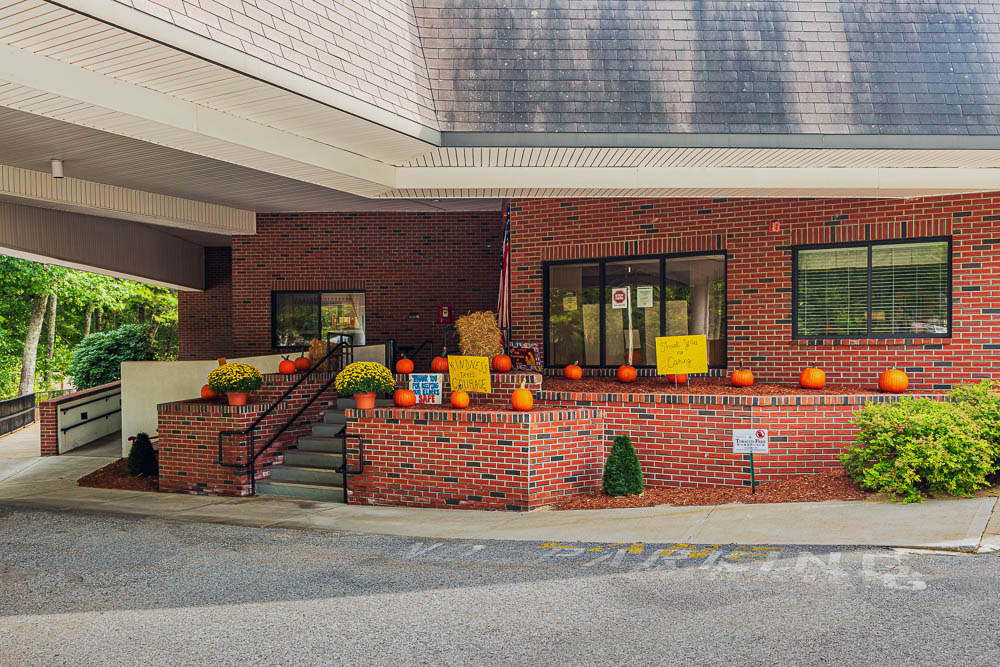
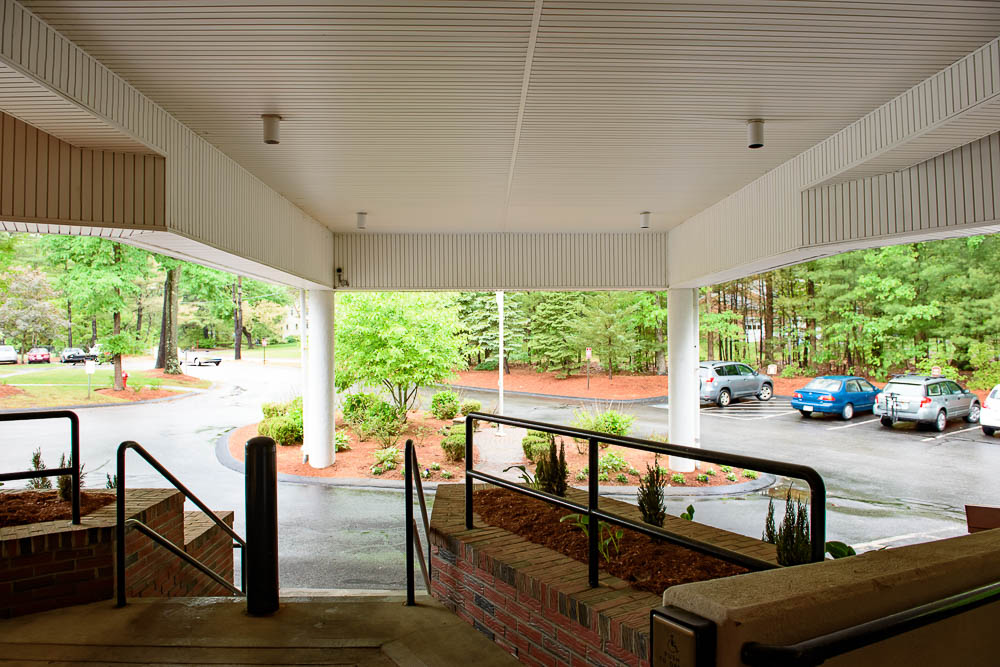
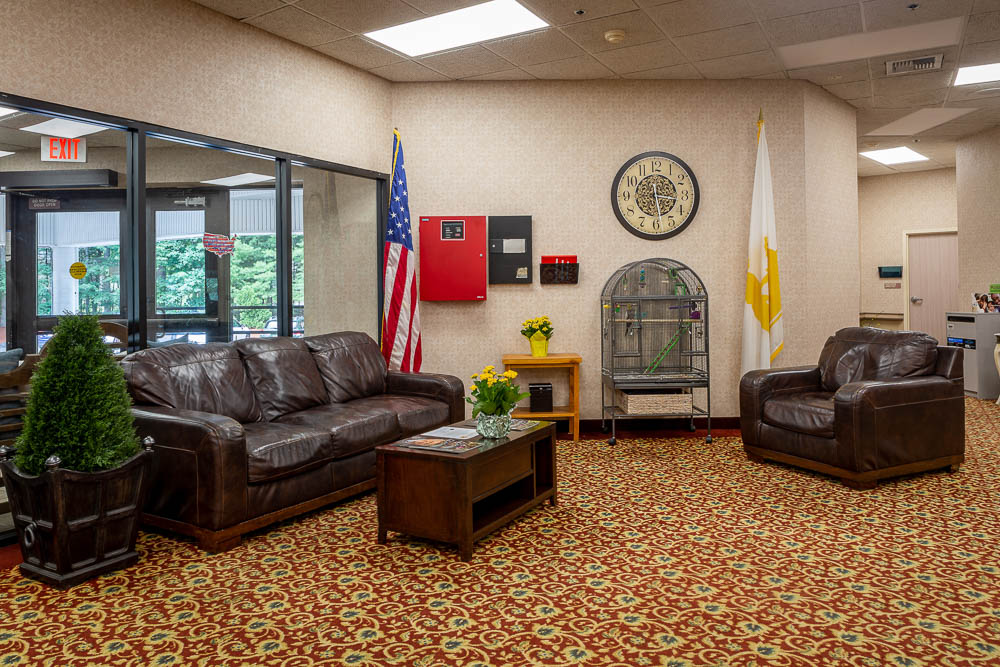
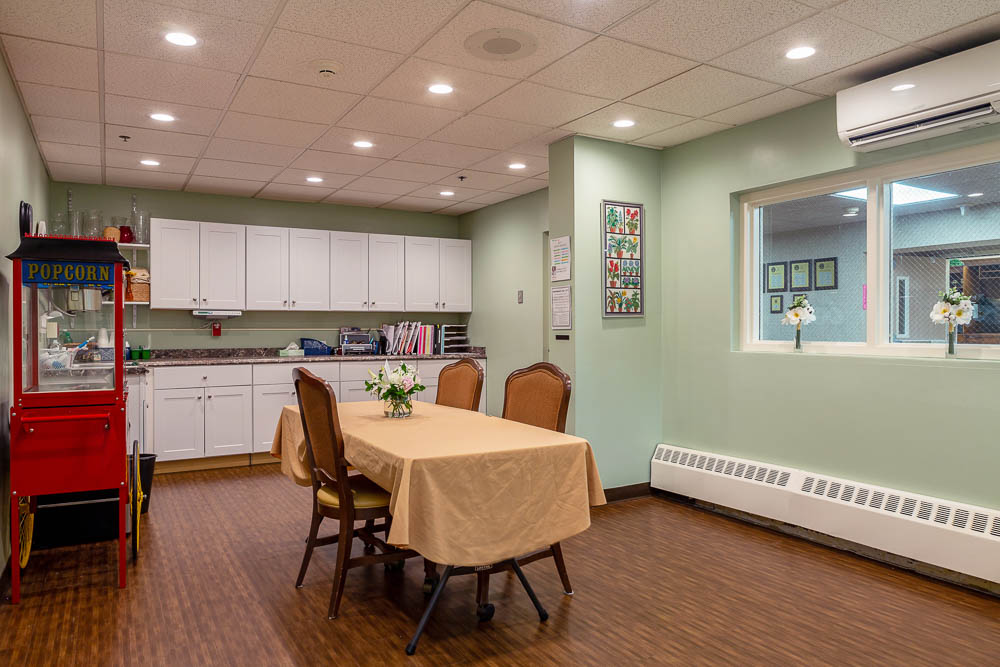
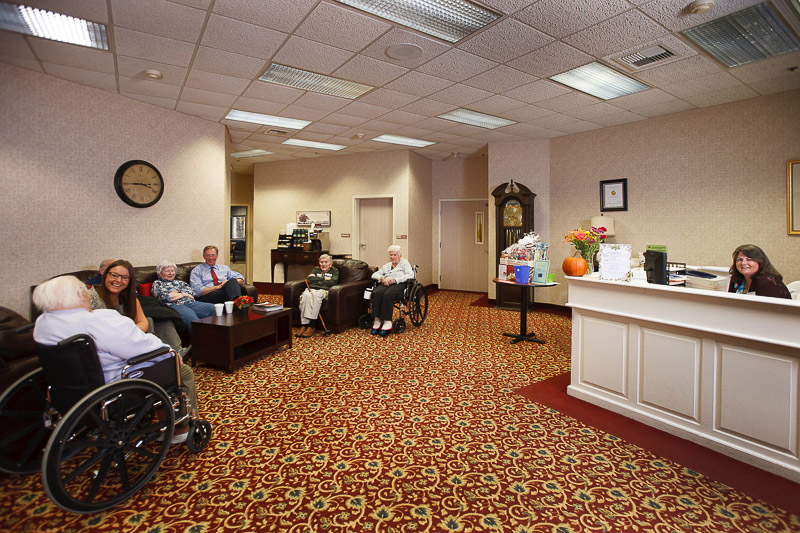
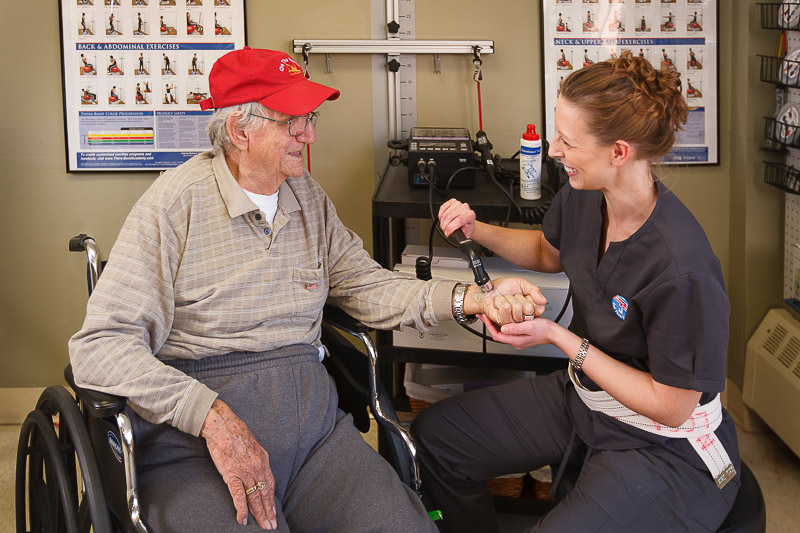
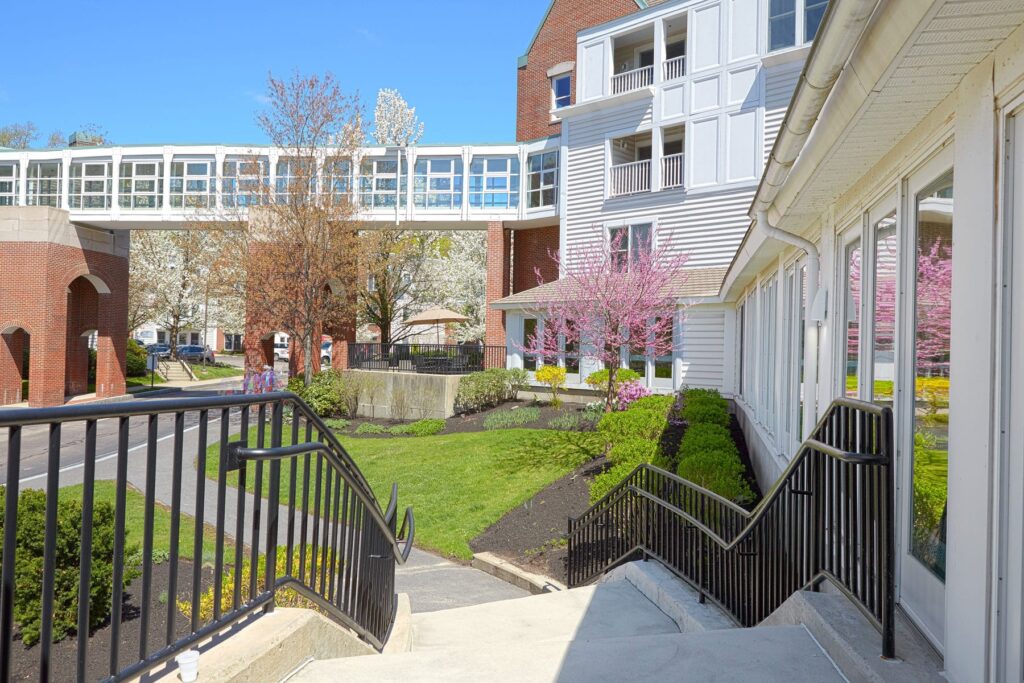
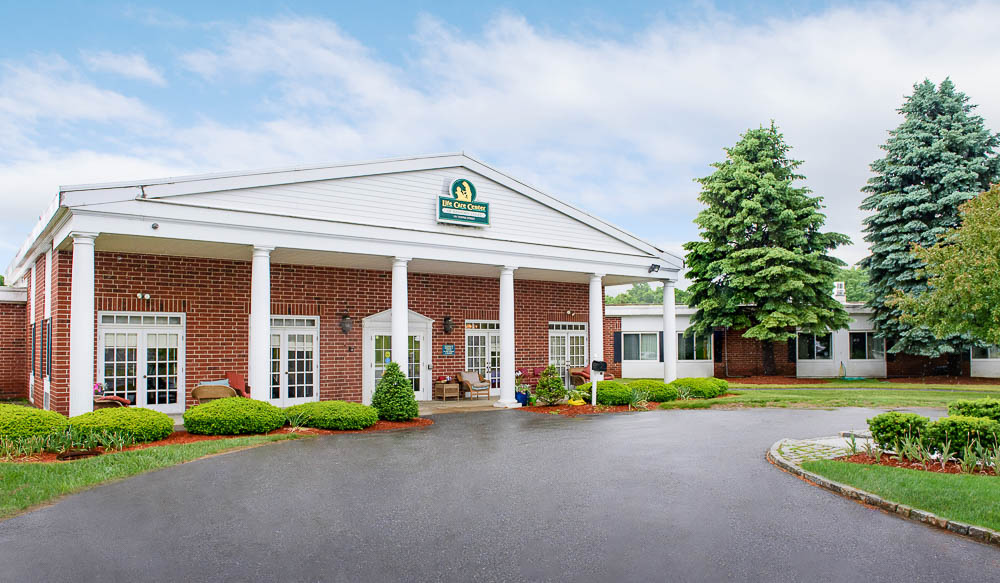
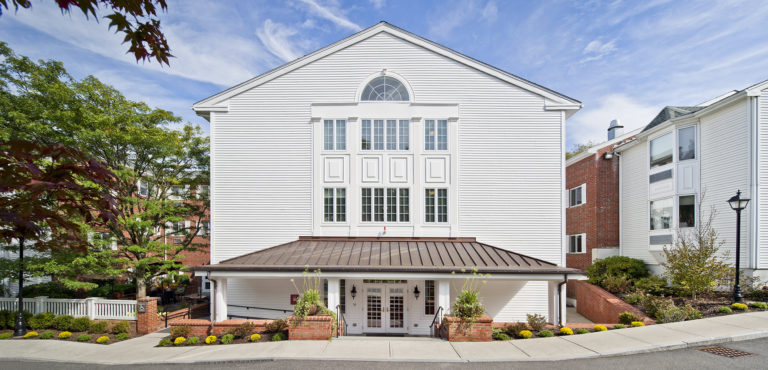
Beautifully set in the tree-lined neighborhood of Great Road, Acton, MA, Life Care of Acton is an idyllic retreat that offers nursing care and rehabilitation. The community strives to meet residents’ healthcare needs, providing top-tier care and assistance 24/7 while respecting their independence. With purposely designed amenities and welcoming spaces, residents will surely feel at ease.

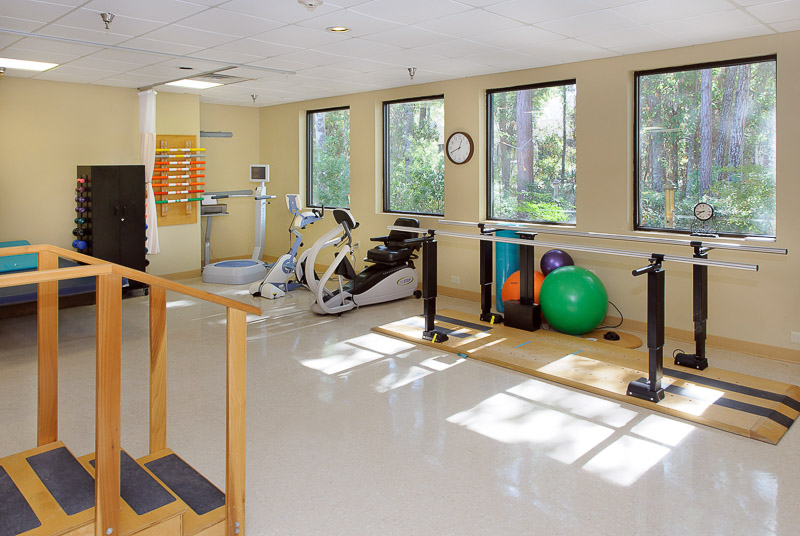
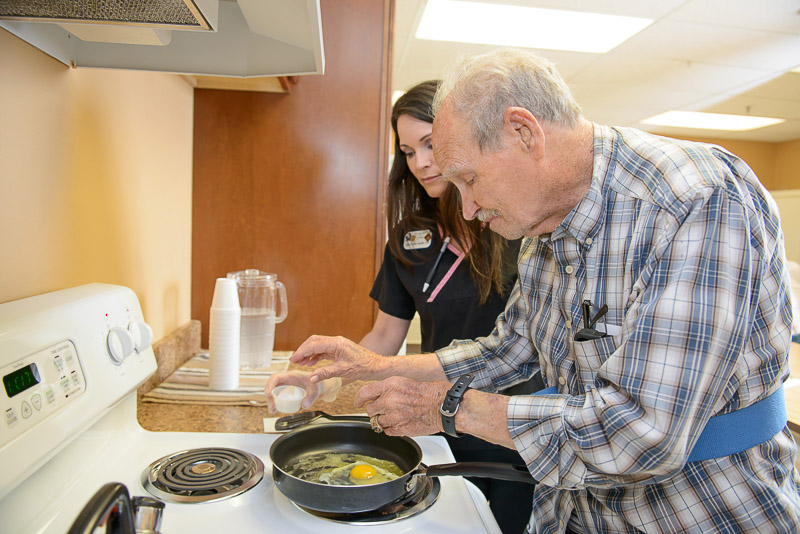
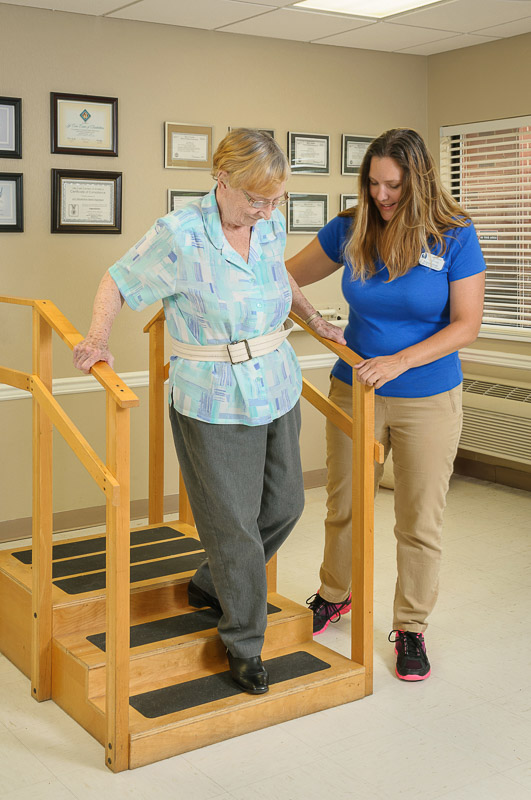
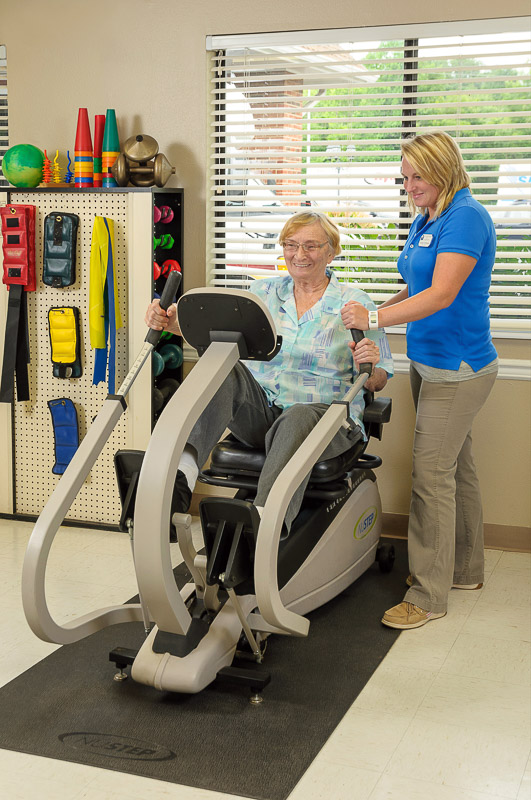
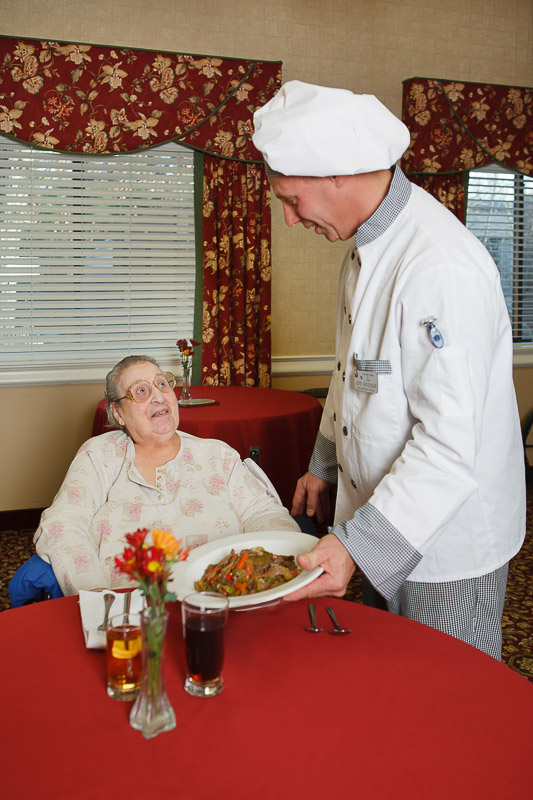
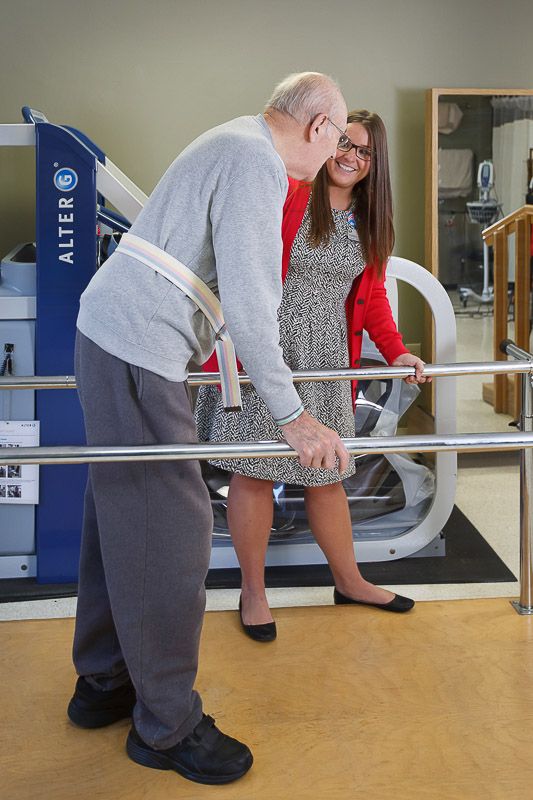
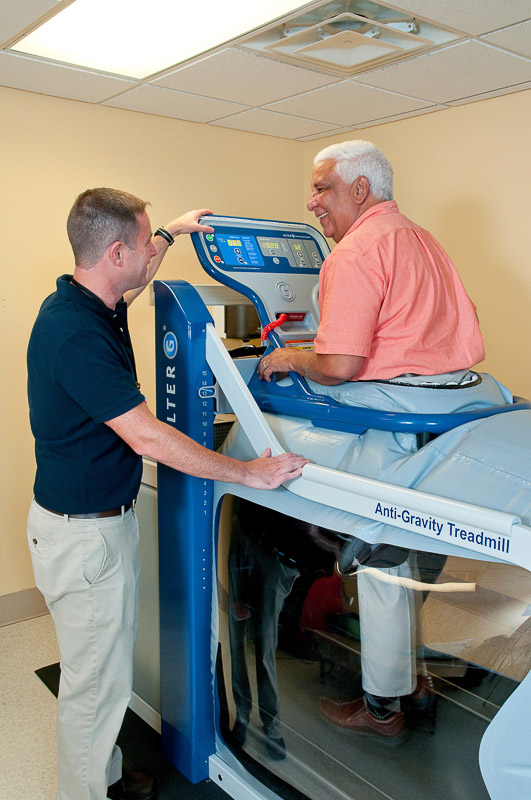
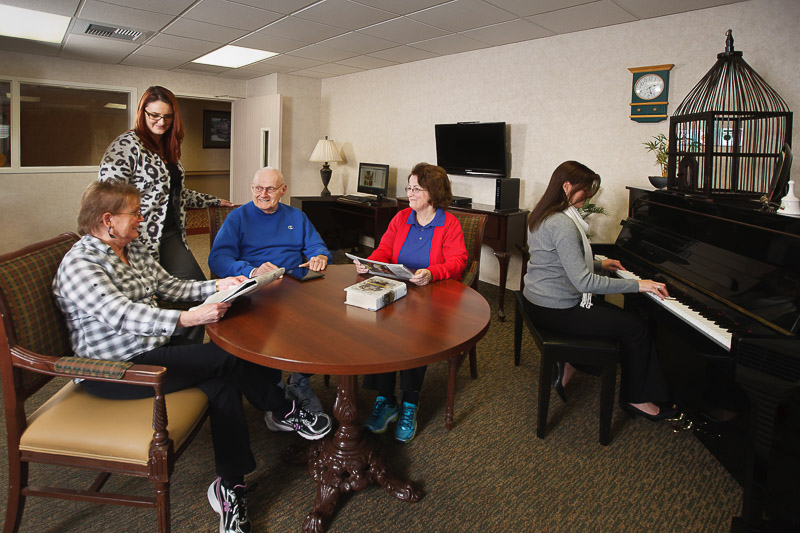
Fun activities and engaging programs are also conducted to keep residents active and socially connected. Fall prevention, medication management, wound care, post-surgical care, and therapy services are also available, ensuring residents find the care they need. Here, residents have delightful and healthy meals that cater to their dietary needs, ensuring the finest dining experience. Amenities include a library, fire safety systems, beautifully manicured grounds, and spacious courtyards.

(978) 263-9101

Quality ratings

Measured by Centers for Medicare & Medicaid Services (CMS)

Overall rating Info The Overall CMS Rating combines results from health inspections, staffing levels and quality measures. Health inspections carry the most weight. Staffing and quality scores can increase or decrease the final rating based on performance compared to state and national standards.
4/5
Massachusetts average: 2.9/5
Health Inspection Info Based on the results of the facility's three most recent standard inspections and any complaint investigations. CMS reviews the number, scope, and severity of deficiencies, with more recent findings weighted more heavily.
4/5
Massachusetts average: 2.8/5
Staffing Info Measures average nursing staff hours per resident per day, including Registered Nurses (RNs) and total nursing staff. Ratings are adjusted based on the level of care residents require and are compared to state and national benchmarks.
3/5
Massachusetts average: 3.0/5
Quality Measures Info Based on clinical and physical health indicators reported to CMS, such as hospital readmissions, falls, pressure ulcers, and improvements in mobility. These measures reflect how well residents' health needs are being managed.
4/5
Massachusetts average: 3.2/5

Nursing care per resident

Info This shows how many total hours of nursing staff time are available per resident each day. Higher numbers usually mean more staff support.
3h 44m per day

This home provides 5% less nursing time per resident than the Massachusetts average.

Massachusetts average: 3h 56m per day

Staffing hours breakdown

Info Hours of care per resident per day, broken down by staff type. Data from CMS Medicare.
Staff type Facility State avg National avg
Registered Nurse (RN) Info Registered nurse hours per resident per day. 30m per day 39m per day 41m per day
Nurse Aide Info Nurse aide hours per resident per day. 2h 14m per day 2h 16m per day 2h 21m per day
Total Nursing (Weekend) Info Total number of nurse staff hours per resident per day on weekends. 3h 17m per day 3h 27m per day 3h 26m per day
Physical Therapist Info Physical therapist staff hours per resident per day. 5m per day 4m per day 4m per day
RN (Weekend) Info Registered nurse hours per resident per day on weekends. 22m per day 28m per day 29m per day

Capacity and availability

Medium-capacity home

Offers a balance of services and community atmosphere.

Total beds 143

This home usually has availability

Lower occupancy suggests more openings may be available.

Lower demand than the Massachusetts average
Occupancy rate 74.2%
Residents per day (avg) 119
Occupancy rate
74.2%
Residents per day (avg)
119

Who this home usually serves

TYPE OF STAY

Mix of rehab and long-term care

This home supports both short-term rehab and long-term care, with residents staying for a wide range of durations.

Breakdown by payment type

Medicare

33% of new residents, usually for short-term rehab.

Typical stay 17 days

Private pay

38% of new residents, often for short stays.

Typical stay 1 - 2 months

Medicaid

30% of new residents, often for long-term daily care.

Typical stay 5 - 6 months

Finances and operations

Privately-owned community
Operated by a business corporation.
Home revenue
$21.6M
Operating loss
-$1.8M
Privately-owned community Operated by a business corporation.
Home revenue
$21,553,822.00
Operating loss
$-1,796,394.00
Payroll costs Info The portion of the home's budget spent on staff, including nurses, caregivers, and other employees who support care and operations.
$7.8M
36% of revenue
Other operating costs Info All remaining costs needed to run the home, such as food, utilities, building maintenance, supplies and administrative expenses.
$15.6M
Total costs $23.4M
Walk Score
Walk Score: 39 / 100
Somewhat walkable. A few nearby services may be reachable on foot, but most trips require transportation.

About this community

Therapy & Rehabilitation

1 service
Rehabilitation Services

Staffing & Medical

3 services
Doctor on Staff
Skilled Nursing
24-Hour Staffing

Additional Services

1 service
Rehabilitation

Amenities & Lifestyle

25 amenities
24-Hour Security And Fire Safety Systems
Beauty Salon And Barber Shop
Bedside And Bathroom Call Lights
Certified Dietitian
Community Re-Entry Program
Complimentary Wireless Internet
Daily Activity Schedule
Family/Resident Councils
Fine Dining Program
Flat-Screen Tvs
Flexible Visiting Hours
Full-Time
Certified Activity Director
Homelike Setting
Housekeeping And Laundry Services
Landscaped Grounds And Courtyards
Library
Non-Smoking Facility
Pet Visitors Allowed
Private And Semiprivate Rooms
Private Bathrooms
Religious Services
Patient/Family Education Program
Telephone And Cable Television Hookups
Transportation Services
Specific ProgramsSkilled Nursing, Rehabilitation, Alzheimer's & Dementia Care, Independent & Assisted Living
Religious ServicesYes

What does this home offer?

Accepts Medicaid icon

Accept Medicaid: Yes

Pets allowed icon
Pets allowed icon

Pets Allowed: Yes, Pets Allowed

Housing options icon

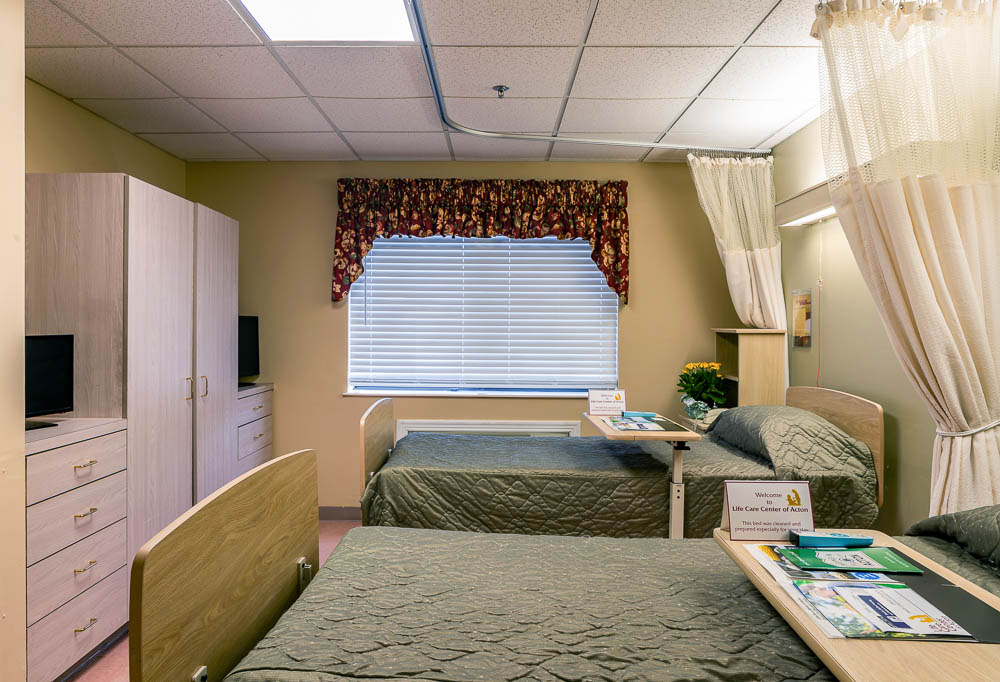
Housing Options: Private / Semi-Private Rooms

Building type icon
Building type icon

Building Type: Single-story

Dining services icon

Dining Services

Beauty services icon

Beauty Services

Transportation services icon

Transportation Services

Housekeeping icon
Housekeeping icon

Housekeeping Services

Recreational activities icon

Recreational Activities

Exercise program icon

Exercise Programs

Types of Care at Life Care Center of Acton

Nursing Home
Contact Life Care Center of Acton

Health Inspection History

Inspections
Total health inspections 3

Massachusetts average 4.5


Last Health inspection on Jul 2025

Total health citations 16

Massachusetts average 32.7

Citations per inspection
5.33

Massachusetts average 7.24


Health citations are formal notices following inspections when they fail to comply with safety and care standards.

All 16 citations resulted from standard inspections.

Breakdown of citation severity (last 3 years)
Critical Health citations More info 0
100% better than Massachusetts average

Massachusetts average: 0.3


Serious Health citations More info 1
33% better than Massachusetts average

Massachusetts average: 1.5

0 critical citations More info Massachusetts average: 0.3

1 serious citation More info Massachusetts average: 1.5

14 moderate citations More info Massachusetts average: 29.7

1 minor citation More info Massachusetts average: 1.3
Citations history (last 3 years)
Infection Control moderate citation Info Issues related to preventing and controlling infections, including hygiene practices and safety protocols. Jul 21, 2025
Corrected

Quality of Care moderate citation Info Issues related to how well residents receive appropriate treatment and support for their medical and daily care needs. Jul 21, 2025
Corrected

Infection Control moderate citation Info Issues related to preventing and controlling infections, including hygiene practices and safety protocols. May 28, 2024
Corrected

Quality of Care moderate citation Info Issues related to how well residents receive appropriate treatment and support for their medical and daily care needs. May 28, 2024
Corrected

Compare Nursing Homes around Middlesex County The information below is reported by the Massachusetts Executive Office of Elder Affairs and Department of Public Health.

5 facilities compared · CMS & MA Dept. of Health data · Updated Apr 2026

Filter by care type
Lasell Village
NH

Nursing Home Licensed facility providing 24/7 skilled nursing care for residents with complex, ongoing medical needs. Staffed by RNs, LPNs, and CNAs. Inspected and star-rated annually by CMS. Accepts Medicare (short-term rehab) and Medicaid (long-term care).

Newton (Auburndale)
38
63.3%
-23%
6.86
+65%
+74%
0
6
3.0
0
22
-
52
Vianello, Alessandro
$5.7M
$8.7M
153.4%
225755
1 Bed / 2 Bed
Life Care Center of Nashoba Valley
NH

Nursing Home Licensed facility providing 24/7 skilled nursing care for residents with complex, ongoing medical needs. Staffed by RNs, LPNs, and CNAs. Inspected and star-rated annually by CMS. Accepts Medicare (short-term rehab) and Medicaid (long-term care).

Littleton
120
85.4%
+4%
4.16
+137%
+6%
0
15
5.0
0
111
-
5
Laroche, Shari
$25.6M
$8.8M
34.2%
225569
Private / Semi-Private Rooms
Life Care Center of Acton
NH

Nursing Home Licensed facility providing 24/7 skilled nursing care for residents with complex, ongoing medical needs. Staffed by RNs, LPNs, and CNAs. Inspected and star-rated annually by CMS. Accepts Medicare (short-term rehab) and Medicaid (long-term care).

Acton
143
74.2%
-9%
3.73
-28%
-5%
1
16
5.3
1
119
-
39
Foye, Christopher
$21.5M
$7.8M
36.1%
225191
Private / Semi-Private Rooms
Belmont Manor Nursing & Rehabilitation Center
MC

Memory Care Secured, specialized care for people living with Alzheimer's or dementia. Staff trained in cognitive impairment, with higher staff-to-resident ratios and an environment designed to reduce confusion and wandering risk.

NH

Nursing Home Licensed facility providing 24/7 skilled nursing care for residents with complex, ongoing medical needs. Staffed by RNs, LPNs, and CNAs. Inspected and star-rated annually by CMS. Accepts Medicare (short-term rehab) and Medicaid (long-term care).

Belmont
135
95.3%
+16%
4.72
+43%
+20%
2
28
7.0
1
124
A+
79
Karger, Stewart
$21.5M
$12.6M
58.9%
225419
Private / 2 Bed Rooms
Life Care Center of Merrimack Valley
NH

Nursing Home Licensed facility providing 24/7 skilled nursing care for residents with complex, ongoing medical needs. Staffed by RNs, LPNs, and CNAs. Inspected and star-rated annually by CMS. Accepts Medicare (short-term rehab) and Medicaid (long-term care).

Billerica (North Billerica)
124
85.8%
+5%
4.24
+13%
+8%
1
31
7.8
0
103
-
40
Babb, Karen
$22.5M
$8.1M
36%
225546
Private / Semi-Private Rooms

Places of interest near Life Care Center of Acton

Address 1.8 miles from city center
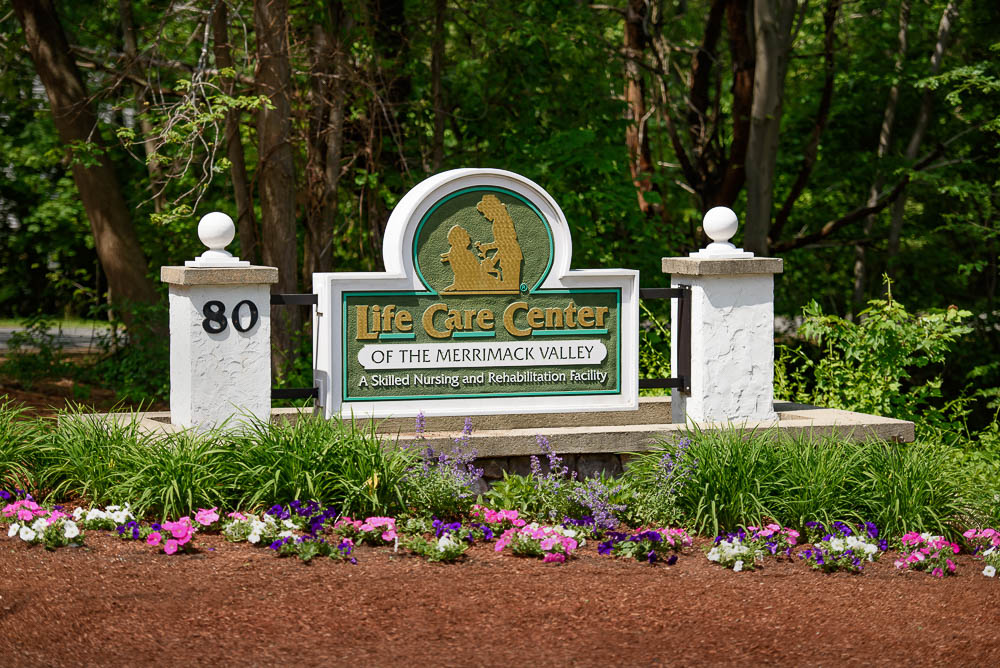
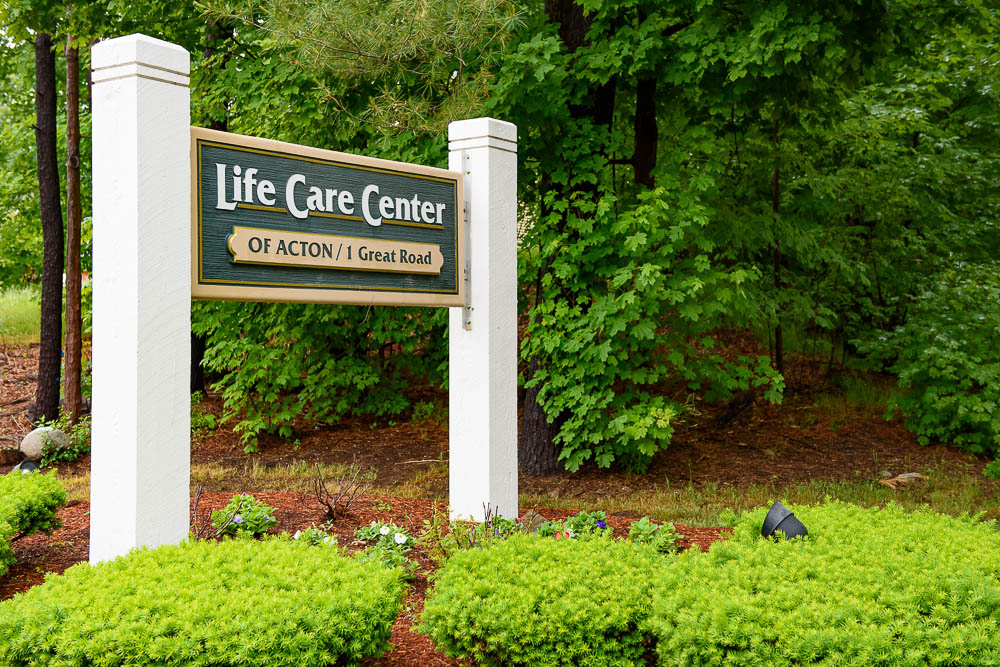
Address 1 Great Road, Acton, MA 01720

Calculate Travel Distance to Life Care Center of Acton

Add your location

Address

Staffing Data (Q2 2025)

This data corresponds to Q2 2025 and is based on CMS Payroll-Based Journal.

Total staff 162
Employees 137
Contractors 25
Staff to resident ratio 1.35:1
21% worse than Massachusetts average

Massachusetts average ratio: 1.70:1

Avg staff/day 66
Average shift 8 hours
0% compared with Massachusetts average

Massachusetts average: 7.9 hours

Total staff hours (quarter) 47,988
Nursing staff breakdown
Registered Nurse

Manages medical care and health needs.

Total count 15
Average shift length Info Average shift length. Calculated as total hours divided by days worked and average staff per day. 8.5 hours

This role is partially covered by contractors.

Licensed Practical Nurse

Assists with medical care and medications.

Total count 37
Average shift length Info Average shift length. Calculated as total hours divided by days worked and average staff per day. 8.7 hours

This role is partially covered by contractors.

Certified Nursing Assistant

Helps with daily care and mobility.

Total count 66
Average shift length Info Average shift length. Calculated as total hours divided by days worked and average staff per day. 7.9 hours

No contractors work on this role.

Contractor staffing

Total hours from contractors

6.1%

2,923 contractor hours this quarter

Licensed Practical Nurse: 12 Registered Nurse: 7 Occupational Therapy Assistant: 5 Medical Director: 1
Staff by category
Certified Nursing Assistant6606622,59091100%7.9
Licensed Practical Nurse25123710,97991100%8.7
Registered Nurse87153,43891100%8.5
Other Dietary Services Staff8082,6539099%7.4
Clinical Nurse Specialist3031,2806774%8
RN Director of Nursing5051,1356875%7.9
Respiratory Therapy Technician3039106875%7.6
Speech Language Pathologist3038278088%6.5
Physical Therapy Assistant6067067178%6.4
Nurse Aide in Training1015616571%8.6
Mental Health Service Worker1014996369%7.9
Nurse Practitioner1014886167%8
Dietitian1014685965%7.9
Occupational Therapy Aide1014545055%9.1
Physical Therapy Aide2024426268%6.4
Qualified Social Worker2022486369%3.9
Dental Services Staff1012242831%8
Occupational Therapy Assistant0555367%4.4
Medical Director0113533%11.5
66 Certified Nursing Assistant
% of Days 100%
37 Licensed Practical Nurse
% of Days 100%
15 Registered Nurse
% of Days 100%
8 Other Dietary Services Staff
% of Days 99%
3 Clinical Nurse Specialist
% of Days 74%
5 RN Director of Nursing
% of Days 75%
3 Respiratory Therapy Technician
% of Days 75%
3 Speech Language Pathologist
% of Days 88%
6 Physical Therapy Assistant
% of Days 78%
1 Nurse Aide in Training
% of Days 71%
1 Mental Health Service Worker
% of Days 69%
1 Nurse Practitioner
% of Days 67%
1 Dietitian
% of Days 65%
1 Occupational Therapy Aide
% of Days 55%
2 Physical Therapy Aide
% of Days 68%
2 Qualified Social Worker
% of Days 69%
1 Dental Services Staff
% of Days 31%
5 Occupational Therapy Assistant
% of Days 7%
1 Medical Director
% of Days 3%

Facility Characteristics

Source: CMS Long-Term Care Facility Characteristics (Data as of Jan 2026)

Total census
120 residents
Residents by payment source
Medicare
8 residents (6.7%)
Medicaid
81 residents (67.5%)
Private pay or other
31 residents (25.8%)
Programs & Services
Residents' Group

Residents meet regularly to discuss policies, care quality, and activities

Active Resident Council

Organized group of residents that meets regularly to discuss facility policies, quality of life, and activities.

Quality of care over time

These measures show how residents usually do over time at this home, based on health outcomes and preventive care.

High-risk clinical events score Info A composite score based on pressure ulcers, falls with injury, weight loss, walking ability decline, and activities of daily living decline. 3.7
63% better than Massachusetts average

Massachusetts average: 10.2

Functional decline score Info A composite score based on activities of daily living decline, walking ability decline, and incontinence. 10.8
46% better than Massachusetts average

Massachusetts average: 20.0

Long-stay resident measures
Significantly above average Massachusetts avg: 3.5 Info CMS star rating based on long-stay quality measure performance. 5 stars = significantly above average, 1 star = significantly below average.
Need for Help with Daily Activities Increased Info Percent of long-stay residents whose need for help with daily activities has increased 3.3%
82% better than Massachusetts average

Massachusetts average: 18.7%

Walking Ability Worsened Info Percent of long-stay residents whose ability to move independently worsened 1.3%
93% better than Massachusetts average

Massachusetts average: 19.3%

Low Risk Residents with Bowel/Bladder Incontinence Info Percent of low risk long-stay residents who lose control of their bowels or bladder 27.8%
26% worse than Massachusetts average

Massachusetts average: 22.1%

Falls with Major Injury Info Percent of long-stay residents experiencing one or more falls with major injury 3.4%
6% better than Massachusetts average

Massachusetts average: 3.6%

High Risk Residents with Pressure Ulcers Info Percent of long-stay high risk residents with pressure ulcers 4.8%
In line with Massachusetts average

Massachusetts average: 4.7%

Urinary Tract Infection Info Percent of long-stay residents with a urinary tract infection 0.0%
100% better than Massachusetts average

Massachusetts average: 2.1%

Lost Too Much Weight Info Percent of long-stay residents who lose too much weight 6.0%
16% worse than Massachusetts average

Massachusetts average: 5.2%

Depressive Symptoms Info Percent of long-stay residents who have depressive symptoms 4.6%
57% better than Massachusetts average

Massachusetts average: 10.7%

Antipsychotic Use Info Percent of long-stay residents who received an antipsychotic medication 14.9%
26% better than Massachusetts average

Massachusetts average: 20.3%

Pneumococcal Vaccine Info Percent of long-stay residents assessed and appropriately given the pneumococcal vaccine 99.8%
9% better than Massachusetts average

Massachusetts average: 91.9%

Influenza Vaccine Info Percent of long-stay residents assessed and appropriately given the seasonal influenza vaccine 98.2%
In line with Massachusetts average

Massachusetts average: 94.8%

Hospitalizations per 1,000 days Info Number of hospitalizations per 1,000 long-stay resident days. 1.87
In line with Massachusetts average

Massachusetts average: 1.86

ED visits per 1,000 days Info Number of outpatient emergency department visits per 1,000 long-stay resident days. 1.99
29% worse than Massachusetts average

Massachusetts average: 1.54

Short-stay resident measures
Above average Massachusetts avg: 3.4 Info CMS star rating based on short-stay quality measure performance. 5 stars = much above average, 1 star = much below average.
Pneumococcal Vaccine Info Percent of short-stay residents assessed and appropriately given the pneumococcal vaccine 82.4%
7% better than Massachusetts average

Massachusetts average: 76.7%

Antipsychotic medication increase Info Percent of short-stay residents who newly received an antipsychotic medication 0.3%
80% better than Massachusetts average

Massachusetts average: 1.3%

Influenza Vaccine Info Percent of short-stay residents assessed and appropriately given the seasonal influenza vaccine 79.4%
In line with Massachusetts average

Massachusetts average: 77.7%

Re-hospitalized after SNF stay Info Percentage of short-stay residents who were re-hospitalized after their nursing home admission. 31.9%
24% worse than Massachusetts average

Massachusetts average: 25.8%

Emergency department visits Info Percentage of short-stay residents who had an outpatient emergency department visit. 15.6%
32% worse than Massachusetts average

Massachusetts average: 11.8%

Falls with major injury Info Percentage of SNF residents who experience falls with major injury during their stay. 0.0%
100% better than Massachusetts average

Massachusetts average: 0.8%

Ability to care for self at discharge Info Percentage of residents at or above expected ability to care for themselves at discharge. 69.9%
30% better than Massachusetts average

Massachusetts average: 53.7%

Successful return to home or community Info Rate of successful return to home or community from a skilled nursing facility. 51.9%
In line with Massachusetts average

Massachusetts average: 50.6%

Guides for Better Senior Living

Care Cost Calculator: See Prices in Your Area

Nursing Home Data Explorer

Don’t Wait Too Long: 7 Red Flag Signs Your Parent Needs Assisted Living Now

The True Cost of Assisted Living in 2025 – And How Families Are Paying For It

Understanding Senior Living Costs: Pricing Models, Discounts & Financial Assistance

Financial Aid for Massachusetts Seniors

Get financial aid guidance

Home Care Program

MassHealth Home Care

Age 60+, Massachusetts resident, at risk of nursing home placement.

~$1,500/month (individual, varies by region).

$2,000 (individual, excludes home, car).

Coordinated through Aging Services Access Points (ASAPs); high demand in urban areas.

Frail Elder Waiver

Massachusetts Medicaid FE Waiver

Age 65+, Massachusetts resident, Medicaid-eligible, nursing home-level care need.

~$2,829/month (300% FBR, individual).

$2,000 (individual), $3,000 (couple).

Requires clinical eligibility determination.

Senior Care Options (SCO)

Massachusetts Senior Care Options

Age 65+, Massachusetts resident, eligible for MassHealth (Medicare optional), nursing home-level care need.

~$2,829/month (300% FBR, individual); QIT allowed.

$2,000 (individual), $3,000 (couple) (excludes home up to $713,000, car).

Not available in Dukes/Nantucket Counties; multiple SCO providers (e.g., CCA, Tufts).

Medicare Savings Program (MSP)

Massachusetts Medicare Savings Program (MassHealth Buy-In)

Age 65+ or disabled, Massachusetts resident, Medicare Part A/B.

~$2,510/month (QMB), ~$3,380/month (SLMB), ~$3,598/month (QI)—individual.

$9,430 (individual), $14,130 (couple).

Three tiers; no waitlist; includes Extra Help for Part D.

National Family Caregiver Support Program (NFCSP) Respite

Massachusetts NFCSP Respite Care

Caregivers of 60+ needing care or 55+ caregivers of others; Massachusetts resident; functional needs (2+ ADLs).

Prioritizes ~$24,980/year (individual); no strict cap.

Not assessed; need-based.

27 ASAPs; prioritizes low-income, rural caregivers.

Prescription Advantage

Massachusetts Prescription Advantage

Age 65+ or disabled, Massachusetts resident, enrolled in Medicare Part D (or ineligible for Medicare).

No strict limit; copays vary by income (~$24,980-$75,000/year individual).

Not assessed.

Supplements Medicare Part D; no enrollment fee for low-income.

Senior Community Service Employment Program (SCSEP)

Massachusetts SCSEP

Age 55+, unemployed, low-income, Massachusetts resident.

~$1,983/month (125% FPL).

Not specified; income-focused.

Priority for veterans, rural residents; AARP partnership.

VA Aid and Attendance (A&A) and Housebound Benefits

Massachusetts VA Aid and Attendance/Housebound

Age 65+ or disabled veteran/spouse, Massachusetts resident, wartime service, need for ADL help (A&A) or homebound.

Net income < ~$1,984/month (veteran with dependent, A&A); pension offsets income.

~$155,356 (net worth limit).

High veteran demand statewide.

Tour Icon
Planning a tour? Check our touring checklist.
Chat Icon
Thinking of living here? We can help you speak to a current resident