Occupancy rate
75%

We arrange tours, appointments, and even moving support so you don’t have to
Thank you for your interest!
Our team will be in touch shortly to help with next steps.

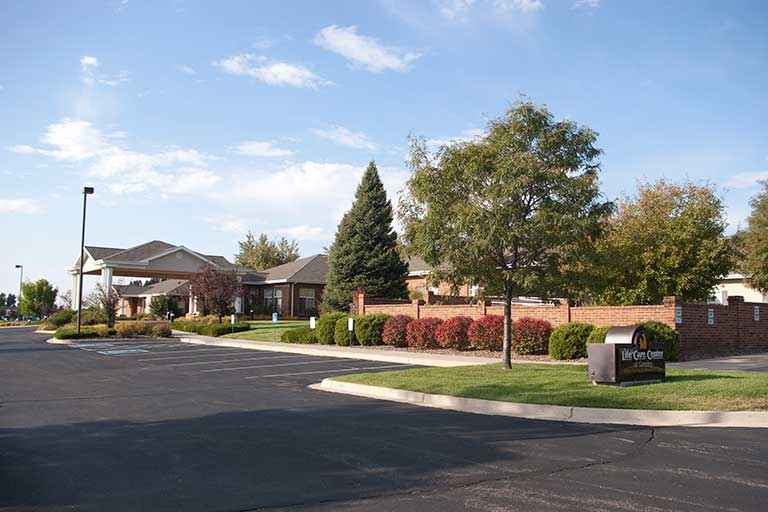
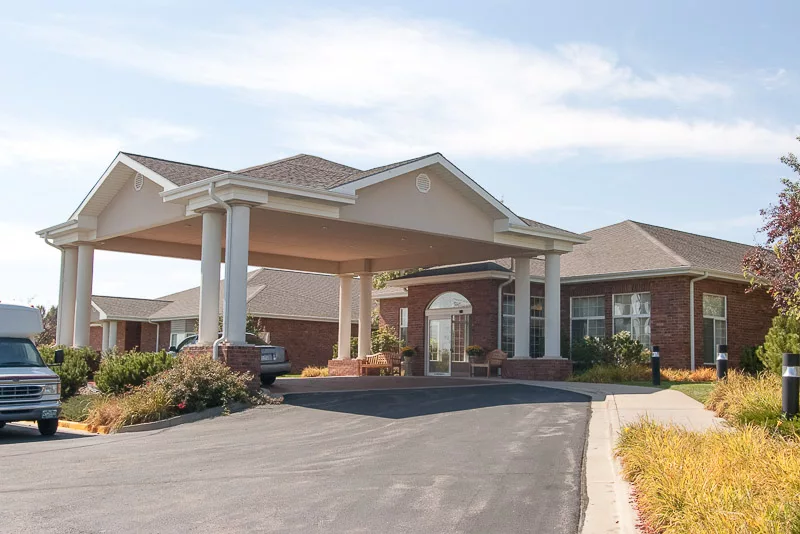
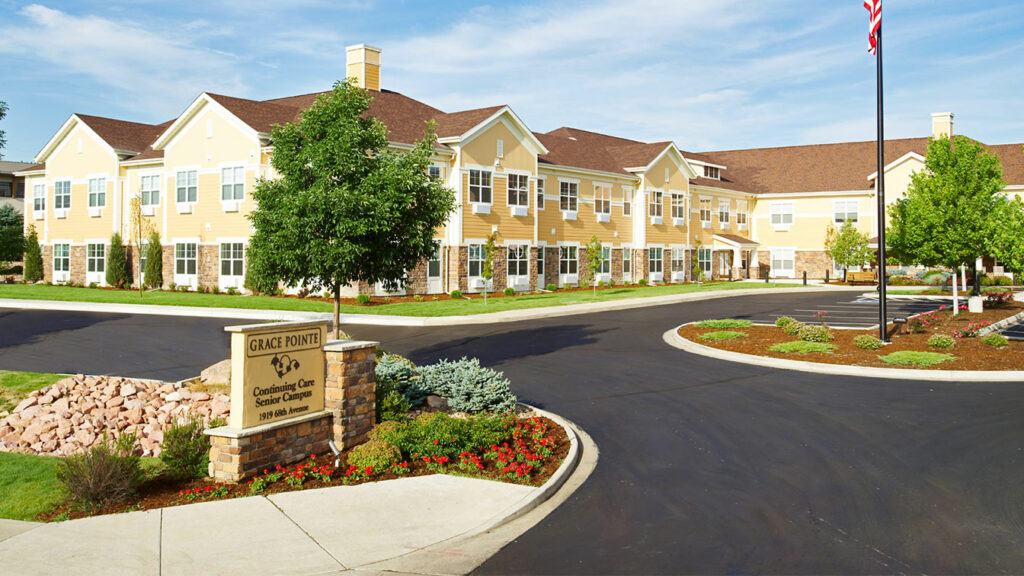
Life Care Center of Greeley, set in the picturesque Greeley, Colorado, specializes in skilled nursing and rehabilitation services. Their commitment to aiding individuals in need, be it for short-term rehab, long-term care, or post-operative recovery, shines through their round-the-clock availability and a dedicated team equipped with state-of-the-art technology and extensive expertise. Here, quality care and personalized treatments are not just words but a guarantee, reflecting their unwavering dedication to individual well-being.
Their comprehensive services encompass a range of specialized treatments, including post-surgical care, social services, wound care, IV therapy, fall prevention, and expert discharge planning. What sets them apart is their 24-hour skilled nursing care, providing a level of expertise and attention that ensures residents receive top-notch medical attention. With a medical director overseeing their operations, Life Care Center of Greeley stands as a paragon of excellence in nursing home qualifications.
Offers a balance of services and community atmosphere.
Lower occupancy suggests more openings may be available.
Residents typically stay for brief periods, with frequent admissions and discharges throughout the year.
30% of new residents, usually for short-term rehab.
61% of new residents, often for short stays.
10% of new residents, often for long-term daily care.
Life Care Center of Greeley is administrated by Peterson, Melissa.
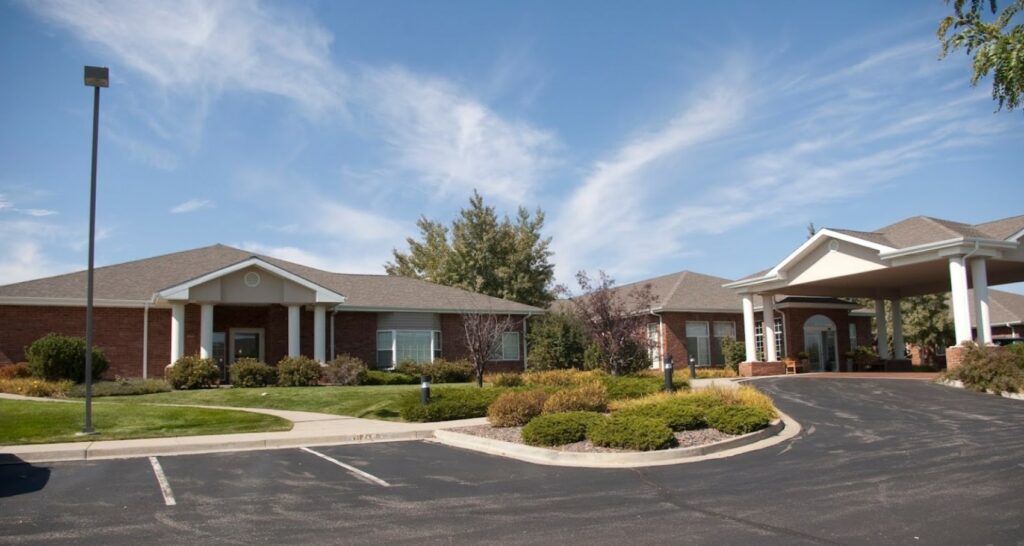
Housing Options: Private Rooms
Building Type: Single-story
Transportation Services
Fitness and Recreation
Ways to qualify for care at this community, including accepted programs and payment options.
This facility is certified for eligible Medicaid services.
This facility is certified for eligible Medicare services.
In Colorado, the Department of Public Health and Environment, Health Facilities Division is the regulatory body that performs unannounced surveys and publishes facility inspection findings.
Colorado average 4.8
Last Health inspection on Jul 2024
Colorado average 24.8
Colorado average 5.2
Health citations are formal notices following inspections when they fail to comply with safety and care standards.
All 6 citations resulted from standard inspections.
Colorado average: 0.4
Colorado average: 2.1
Data sourced from CMS Health Deficiencies reports. Citation severity codes range from A (least serious) to L (most serious). Immediate Jeopardy (J-L) citations indicate situations where the facility's noncompliance has placed residents at risk of death or serious harm.
Assisted Living A licensed, long-term care setting for seniors or individuals with disabilities who need help with daily activities — like bathing, dressing, and medication management — but not 24-hour skilled nursing. Offers housing, meals, and around-the-clock support while aiming to maximize resident independence.
Independent Living Lifestyle-focused communities for older adults offering dining, activities, and transportation with minimal personal care. Best for active, independent seniors who want community without medical support.
Memory Care Secured, specialized care for people living with Alzheimer's or dementia. Staff trained in cognitive impairment, with higher staff-to-resident ratios and an environment designed to reduce confusion and wandering risk.
Nursing Home Licensed facility providing 24/7 skilled nursing care for residents with complex, ongoing medical needs. Staffed by RNs, LPNs, and CNAs. Inspected and star-rated annually by CMS. Accepts Medicare (short-term rehab) and Medicaid (long-term care).
Home Care Professional care delivered in the person's own home — from companionship and errands to skilled nursing and therapy. Allows seniors to age in place. Medicare covers skilled home health when medically necessary.
Nursing Home Licensed facility providing 24/7 skilled nursing care for residents with complex, ongoing medical needs. Staffed by RNs, LPNs, and CNAs. Inspected and star-rated annually by CMS. Accepts Medicare (short-term rehab) and Medicaid (long-term care).
Respite Care Short-term temporary care — days to weeks — to give family caregivers a break. Full care provided during the stay. Often used after hospitalization or to trial a facility before a permanent placement decision.
Nursing Home Licensed facility providing 24/7 skilled nursing care for residents with complex, ongoing medical needs. Staffed by RNs, LPNs, and CNAs. Inspected and star-rated annually by CMS. Accepts Medicare (short-term rehab) and Medicaid (long-term care).
![]() 4.3 miles from city center — 1.81 miles to nearest hospital (NextCare Urgent Care Greeley)
4.3 miles from city center — 1.81 miles to nearest hospital (NextCare Urgent Care Greeley)
![]() 4800 25th St, Greeley, CO 80634
4800 25th St, Greeley, CO 80634
Add your location
This data corresponds to Q2 2025 and is based on CMS Payroll-Based Journal.
Colorado average ratio: 1.91:1
Colorado average: 8.3 hours
Manages medical care and health needs.
No contractors work on this role.
Assists with medical care and medications.
No contractors work on this role.
Helps with daily care and mobility.
No contractors work on this role.
Total hours from contractors
86 contractor hours this quarter
| Certified Nursing Assistant | 44 | 0 | 44 | 11,462 | 91 | 100% | 7.6 |
| Licensed Practical Nurse | 18 | 0 | 18 | 7,299 | 91 | 100% | 8.8 |
| Registered Nurse | 10 | 0 | 10 | 2,604 | 91 | 100% | 7.4 |
| Physical Therapy Assistant | 3 | 0 | 3 | 1,011 | 76 | 84% | 7.5 |
| Clinical Nurse Specialist | 2 | 0 | 2 | 940 | 73 | 80% | 7.2 |
| Other Dietary Services Staff | 3 | 0 | 3 | 894 | 85 | 93% | 6.6 |
| Speech Language Pathologist | 3 | 0 | 3 | 785 | 65 | 71% | 6 |
| Nurse Aide in Training | 7 | 0 | 7 | 738 | 53 | 58% | 6.9 |
| RN Director of Nursing | 1 | 0 | 1 | 546 | 62 | 68% | 8.8 |
| Administrator | 1 | 0 | 1 | 520 | 65 | 71% | 8 |
| Other Social Services Staff | 1 | 0 | 1 | 499 | 69 | 76% | 7.2 |
| Mental Health Service Worker | 1 | 0 | 1 | 445 | 60 | 66% | 7.4 |
| Physical Therapy Aide | 1 | 0 | 1 | 442 | 60 | 66% | 7.4 |
| Dental Services Staff | 1 | 0 | 1 | 435 | 57 | 63% | 7.6 |
| Nurse Practitioner | 1 | 0 | 1 | 422 | 53 | 58% | 8 |
| Qualified Social Worker | 1 | 0 | 1 | 422 | 57 | 63% | 7.4 |
| Occupational Therapy Aide | 1 | 0 | 1 | 389 | 57 | 63% | 6.8 |
| Respiratory Therapy Technician | 2 | 0 | 2 | 369 | 53 | 58% | 7 |
| Medication Aide/Technician | 1 | 0 | 1 | 96 | 12 | 13% | 8 |
| Other Physician | 0 | 1 | 1 | 44 | 3 | 3% | 14.5 |
| Occupational Therapy Assistant | 0 | 1 | 1 | 43 | 3 | 3% | 14.2 |
Source: CMS Long-Term Care Facility Characteristics (Data as of Jan 2026)
Residents meet regularly to discuss policies, care quality, and activities
State-approved Nurse Aide Training and Competency Evaluation Program on-site
Organized group of residents that meets regularly to discuss facility policies, quality of life, and activities.
Data sourced from CMS Long-Term Care Facility Characteristics quarterly report. Payer mix reflects the current resident census by primary payment source.
These measures show how residents usually do over time at this home, based on health outcomes and preventive care.
Colorado average: 9.0
Colorado average: 18.8
Colorado average: 16.0%
Colorado average: 17.0%
Colorado average: 23.2%
Colorado average: 3.3%
Colorado average: 3.9%
Colorado average: 1.4%
Colorado average: 5.2%
Colorado average: 7.2%
Colorado average: 18.8%
Colorado average: 93.3%
Colorado average: 94.7%
Colorado average: 1.30
Colorado average: 1.67
Colorado average: 76.6%
Colorado average: 1.4%
Colorado average: 75.6%
Colorado average: 20.3%
Colorado average: 12.8%
Colorado average: 0.8%
Colorado average: 53.7%
Colorado average: 50.6%
Quality measures are calculated from Minimum Data Set (MDS) assessments. For most measures, lower percentages indicate better care quality.
Federal penalties imposed by CMS for regulatory violations, including civil money penalties (fines) and denials of payment for new Medicare/Medicaid admissions.
Source: CMS Penalties Database (Data as of Jan 2026)
Colorado average: $40K
Colorado average: 2.2
Colorado average: 0.3
Penalties are imposed by CMS for violations of federal nursing home regulations.
Last updated: Jan 2026
Historical financial and operational data for Life Care Center of Greeley based on CMS SNF Cost Reports.
Loading trend charts...
Care Cost Calculator: See Prices in Your Area
Nursing Home Data Explorer
Don’t Wait Too Long: 7 Red Flag Signs Your Parent Needs Assisted Living Now
The True Cost of Assisted Living in 2025 – And How Families Are Paying For It
Understanding Senior Living Costs: Pricing Models, Discounts & Financial Assistance

Touring a community? Use this expert-backed checklist to stay organized, ask the right questions, and find the perfect fit.
We'll send you a PDF version of the touring checklist.