Explore Open Rooms
1 Contact details
2 What type of senior care service are you looking for?
3 What budget do you have in mind for senior care?
4 How soon do you need to find care?
5 Additional details

Thank you for your interest!

Our team will be in touch shortly to help with next steps.

Nursing Home in Palm Bay

CMS overall rating Info The Overall CMS Rating combines results from health inspections, staffing levels and quality measures. Health inspections carry the most weight. Staffing and quality scores can increase or decrease the final rating based on performance compared to state and national standards.

Life Care Center of Palm Bay

Overview of Life Care Center of Palm Bay

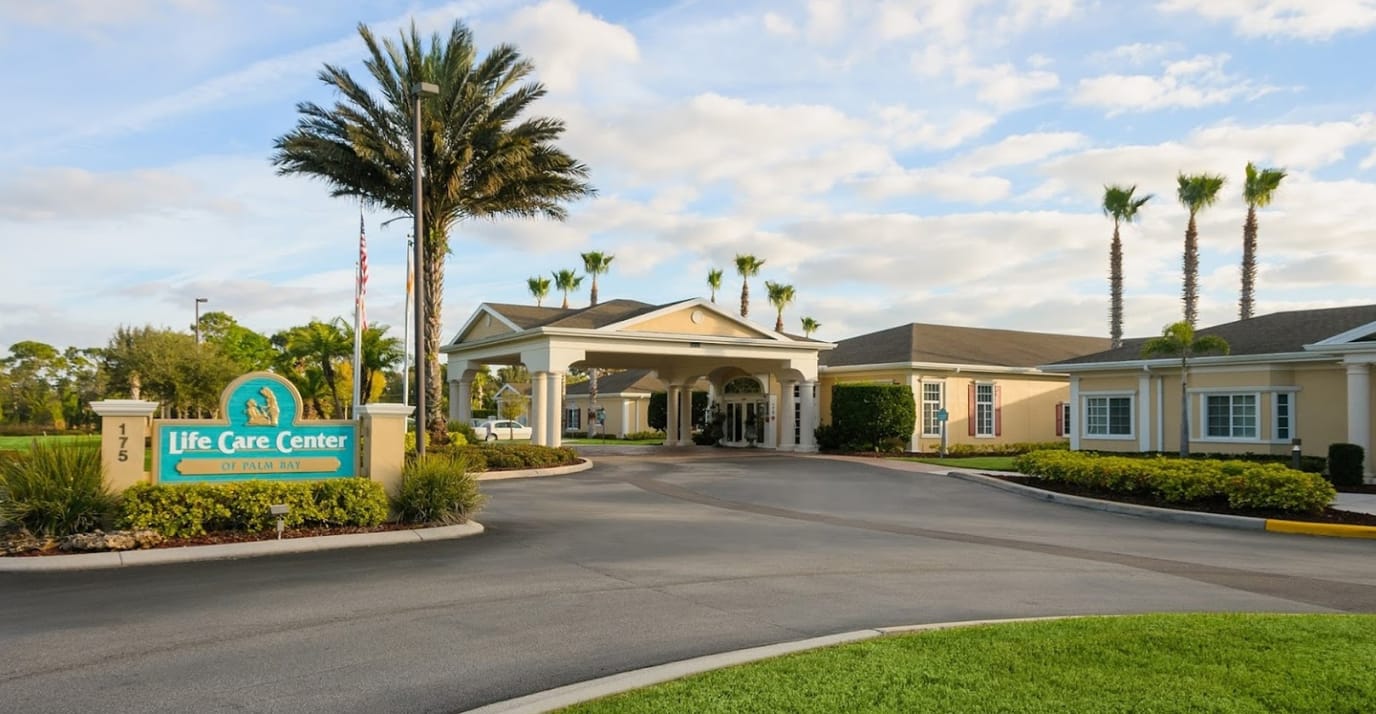
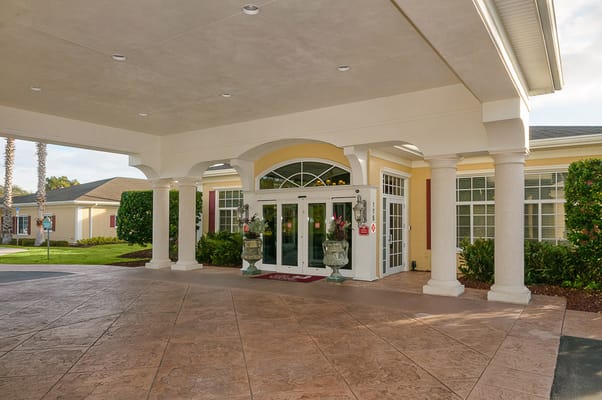
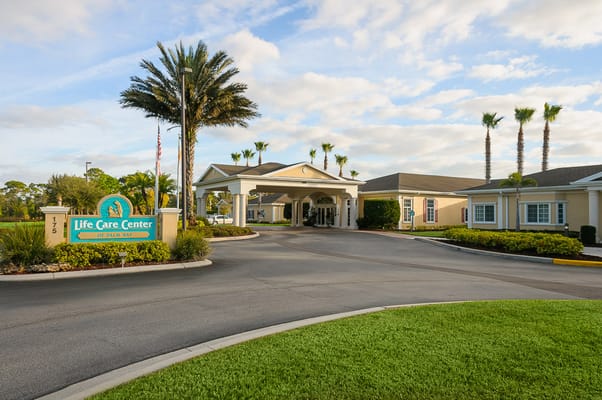
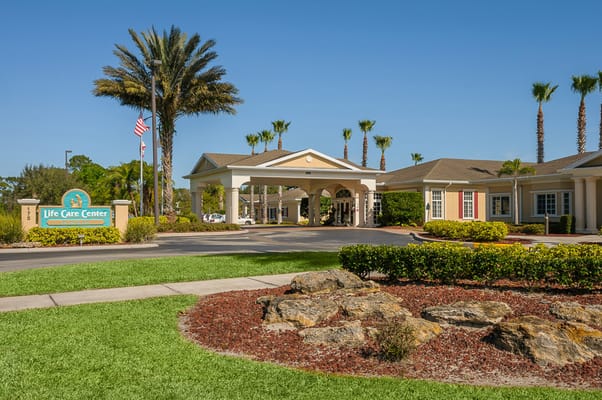
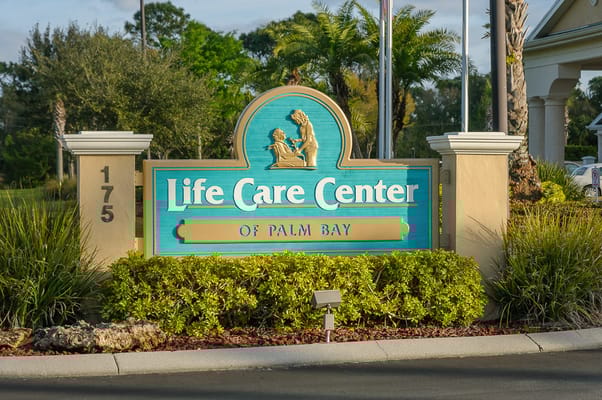
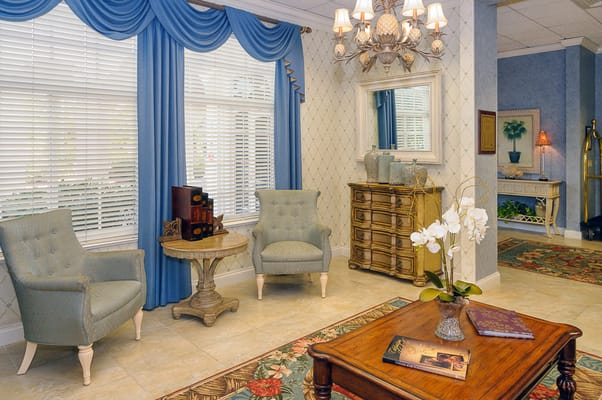
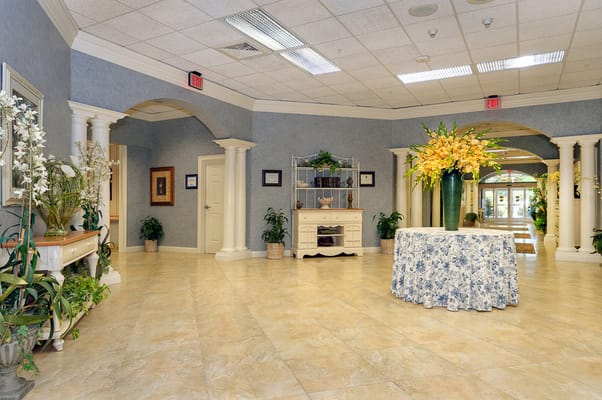
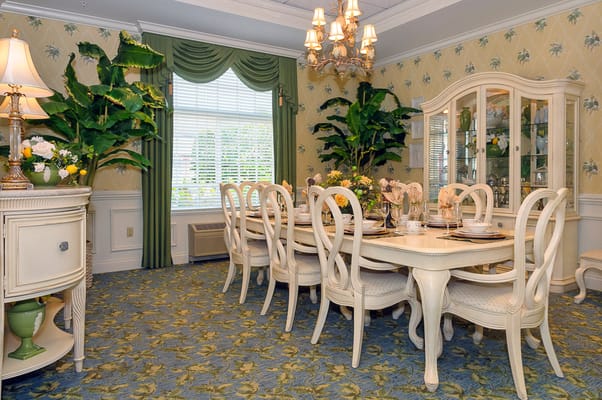
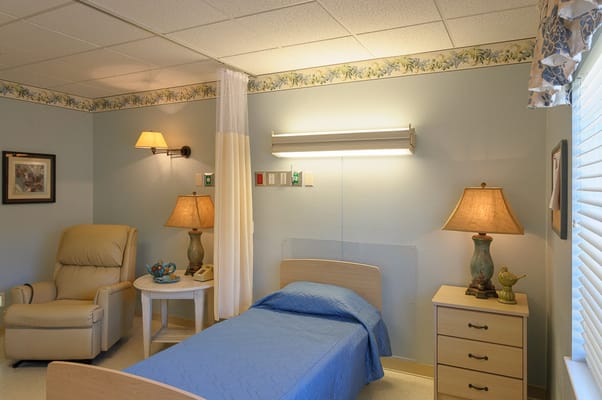
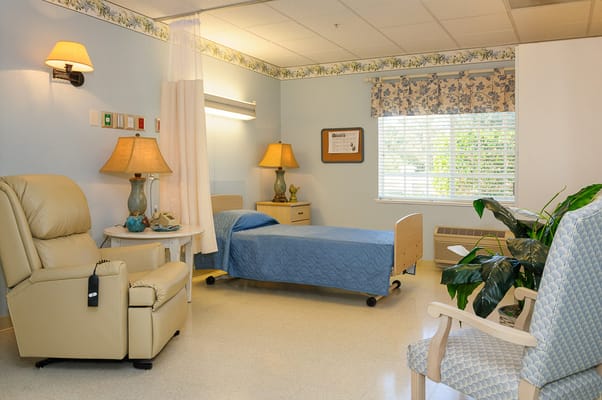
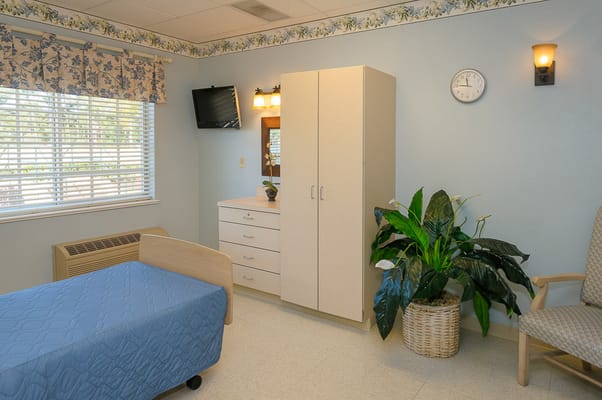
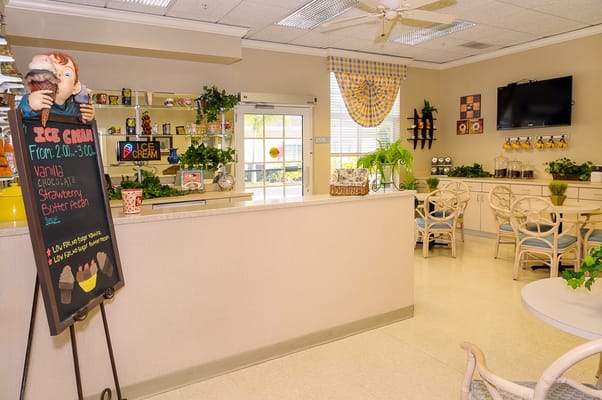
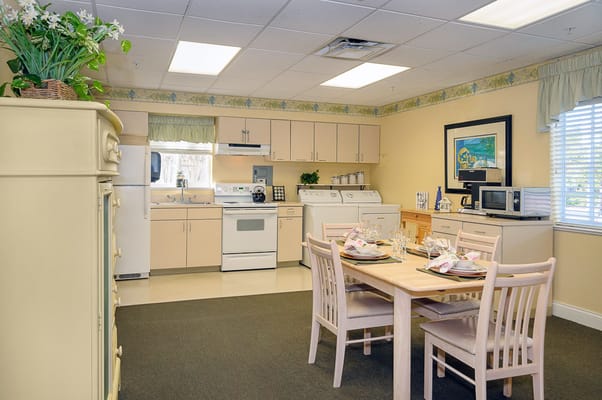
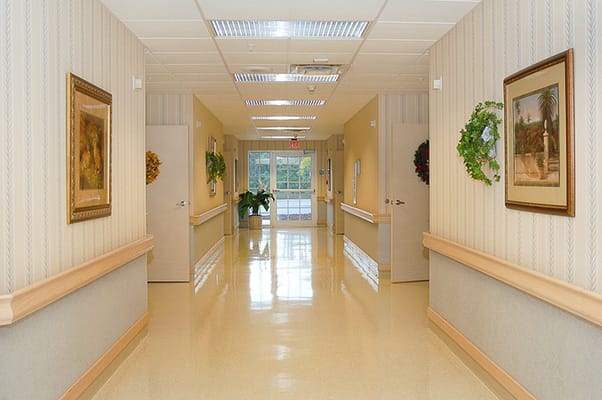
Life Care Center of Palm Bay is a skilled nursing and rehabilitation facility located in Palm Bay, FL. This long-term care facility provides 24 hour skilled nursing care and security to its patients and residents, as well as medication management, post surgical care, wound care, IV therapy and infection management.

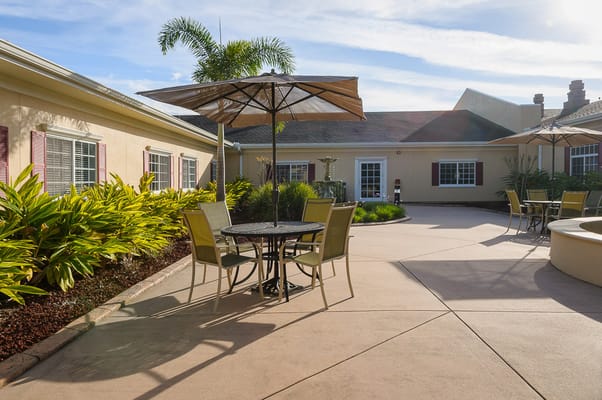
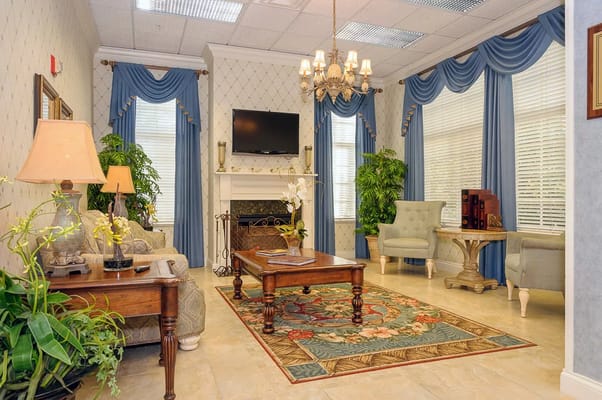
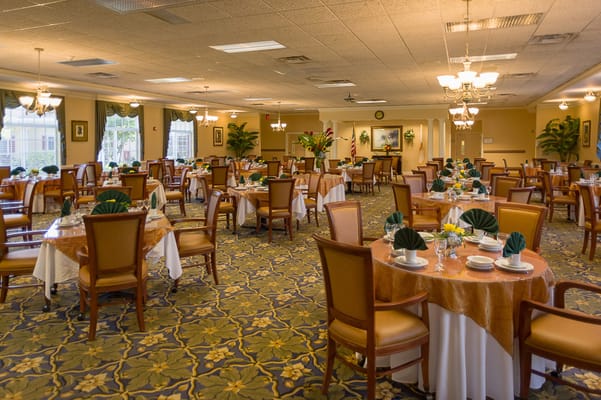
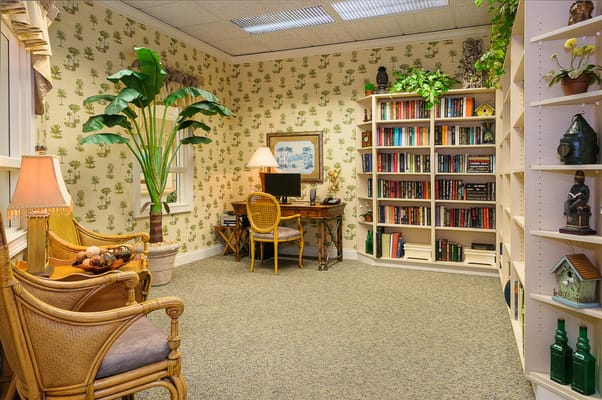
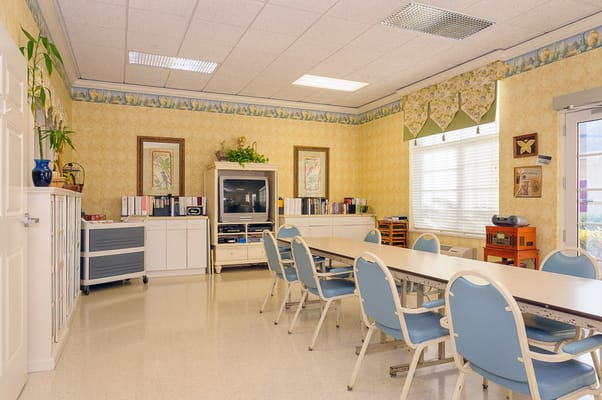
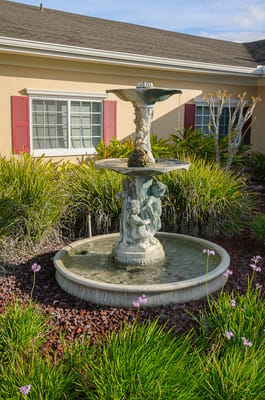
The long-term residents of this care facility are confident that their care is in good hands, with the meal services prepared by  certified dieticians, housekeeping and laundry services, and access to library and landscaped grounds. The whole facility itself is also smoke free and pet friendly, providing opportunities for patients and residents alike to breathe fresh air and bond with furry companions.

(321) 952-1818

Quality ratings

Measured by Centers for Medicare & Medicaid Services (CMS)

Overall rating Info The Overall CMS Rating combines results from health inspections, staffing levels and quality measures. Health inspections carry the most weight. Staffing and quality scores can increase or decrease the final rating based on performance compared to state and national standards.
5/5
Florida average: 3.2/5
Health Inspection Info Based on the results of the facility's three most recent standard inspections and any complaint investigations. CMS reviews the number, scope, and severity of deficiencies, with more recent findings weighted more heavily.
4/5
Florida average: 2.8/5
Staffing Info Measures average nursing staff hours per resident per day, including Registered Nurses (RNs) and total nursing staff. Ratings are adjusted based on the level of care residents require and are compared to state and national benchmarks.
4/5
Florida average: 3.4/5
Quality Measures Info Based on clinical and physical health indicators reported to CMS, such as hospital readmissions, falls, pressure ulcers, and improvements in mobility. These measures reflect how well residents' health needs are being managed.
5/5
Florida average: 4.1/5

Nursing care per resident

Info This shows how many total hours of nursing staff time are available per resident each day. Higher numbers usually mean more staff support.
4h 4m per day

This home provides 1% more nursing time per resident than the Florida average.

Florida average: 4h 2m per day

Staffing hours breakdown

Info Hours of care per resident per day, broken down by staff type. Data from CMS Medicare.
Staff type Facility State avg National avg
Registered Nurse (RN) Info Registered nurse hours per resident per day. 59m per day 44m per day 41m per day
Nurse Aide Info Nurse aide hours per resident per day. 2h 18m per day 2h 20m per day 2h 21m per day
Total Nursing (Weekend) Info Total number of nurse staff hours per resident per day on weekends. 3h 24m per day 3h 31m per day 3h 26m per day
Physical Therapist Info Physical therapist staff hours per resident per day. 7m per day 5m per day 4m per day
RN (Weekend) Info Registered nurse hours per resident per day on weekends. 49m per day 32m per day 29m per day

Capacity and availability

Medium-capacity home

Offers a balance of services and community atmosphere.

Total beds 141

This home usually has limited availability

Occupancy is moderate, suggesting balanced demand.

Similar demand to the Florida average
Occupancy rate 94%
Residents per day (avg) 135
Occupancy rate
94%
Residents per day (avg)
135

Who this home usually serves

TYPE OF STAY

Mostly short-term rehab stays

Most residents typically stay for a few weeks or months before returning home or moving on.

Might be optimal for
Short stays Recovery Medicare-covered care

Breakdown by payment type

Medicare

46% of new residents, usually for short-term rehab.

Typical stay 22 days

Private pay

39% of new residents, often for short stays.

Typical stay 1 - 2 months

Medicaid

15% of new residents, often for long-term daily care.

Typical stay 9 - 10 months

Finances and operations

Privately-owned community
Home revenue
$25.8M
Profit
$1.7M
Privately-owned community
Home revenue
$25.8M
Profit
$1.7M
Payroll costs Info The portion of the home's budget spent on staff, including nurses, caregivers, and other employees who support care and operations.
$8.0M
30.9% of revenue
Other operating costs Info All remaining costs needed to run the home, such as food, utilities, building maintenance, supplies and administrative expenses.
$16.1M
Total costs $24.1M
Walk Score
Walk Score: 32 / 100
Somewhat walkable. A few nearby services may be reachable on foot, but most trips require transportation.

About this community

Additional Licensing Details

AwardsBest Nursing Home - U.S. News & World Report 2026

Safety & Compliance

Safety Features24-hour security and fire safety systems

Therapy & Rehabilitation

1 service
Rehabilitation Services

Staffing & Medical

2 services
Skilled Nursing
24-Hour Staffing

Additional Services

1 service
Rehabilitation

Amenities & Lifestyle

25 amenities
24-Hour Security And Fire Safety Systems
Beauty Salon And Barber Shop
Bedside And Bathroom Call Lights
Certified Dietitian
Community Re-Entry Program
Complimentary Wireless Internet
Daily Activity Schedule
Family/Resident Councils
Fine Dining Program
Flat-Screen Tvs
Flexible Visiting Hours
Full-Time
Certified Activity Director
Homelike Setting
Housekeeping And Laundry Services
Landscaped Grounds And Courtyards
Library
Non-Smoking Facility
Pet Visitors Allowed
Private And Semiprivate Rooms
Private Bathrooms
Religious Services
Patient/Family Education Program
Telephone And Cable Television Hookups
Transportation Services
ActivitiesDaily activity schedule available.
Specific ProgramsSkilled Nursing, Rehabilitation, Alzheimer's & Dementia Care, Independent & Assisted Living
Religious ServicesYes

Dining & Nutrition

Food DescriptionLife Care Center of Palm Bay offers fine dining programs and has an in-house ice cream parlor.

Types of Care at Life Care Center of Palm Bay

Skilled Nursing

Contact Life Care Center of Palm Bay

Health Inspection History

Inspections
Total health inspections 3

Florida average 4.3


Last Health inspection on Jan 2025

Total health citations 8

Florida average 19.7

Citations per inspection
2.67

Florida average 4.48


Health citations are formal notices following inspections when they fail to comply with safety and care standards.

All 8 citations resulted from standard inspections.

Breakdown of citation severity (last 3 years)
Critical Health citations More info 0
100% better than Florida average

Florida average: 0.8


Serious Health citations More info 2
400% worse than Florida average

Florida average: 0.4

0 critical citations More info Florida average: 0.8

2 serious citations More info Florida average: 0.4

6 moderate citations More info Florida average: 18.4

0 minor citations More info Florida average: 0.2
Citations history (last 3 years)
Quality of Care moderate citation Info Issues related to how well residents receive appropriate treatment and support for their medical and daily care needs. Jan 09, 2025
Corrected

Care Planning moderate citation Info Issues related to creating and updating personalized care plans for residents based on their needs and conditions. Jan 09, 2025
Corrected

Nutrition moderate citation Info Issues related to food quality, meal service, and resident's nutritional needs. Apr 20, 2023
Corrected

Quality of Care moderate citation Info Issues related to how well residents receive appropriate treatment and support for their medical and daily care needs. Apr 20, 2023
Corrected

Compare Nursing Homes around Palm Bay The information below is reported by the Florida Agency for Health Care Administration (AHCA).

1 facility compared · CMS & FL Dept. of Health data · Updated Apr 2026

Filter by care type
Life Care Center of Palm Bay
AL

Assisted Living A licensed, long-term care setting for seniors or individuals with disabilities who need help with daily activities — like bathing, dressing, and medication management — but not 24-hour skilled nursing. Offers housing, meals, and around-the-clock support while aiming to maximize resident independence.

NH

Nursing Home Licensed facility providing 24/7 skilled nursing care for residents with complex, ongoing medical needs. Staffed by RNs, LPNs, and CNAs. Inspected and star-rated annually by CMS. Accepts Medicare (short-term rehab) and Medicaid (long-term care).

Palm Bay
141
94.0%
+12%
4.06
+48%
+1%
1
8
2.7
2
135
32
Tarbet, Willard
$25.5M
$8.0M
31.3%
106060

Places of interest near Life Care Center of Palm Bay

Address 5.0 miles from city center — 0.2 miles to nearest hospital (Health First Palm Bay Hospital)

Calculate Travel Distance to Life Care Center of Palm Bay

Add your location

Address

Staffing Data (Q2 2025)

This data corresponds to Q2 2025 and is based on CMS Payroll-Based Journal.

Total staff 165
Employees 158
Contractors 7
Staff to resident ratio 1.30:1
14% worse than Florida average

Florida average ratio: 1.52:1

Avg staff/day 76
Average shift 7.7 hours
0% compared with Florida average

Florida average: 7.9 hours

Total staff hours (quarter) 53,070
Nursing staff breakdown
Registered Nurse

Manages medical care and health needs.

Total count 29
Average shift length Info Average shift length. Calculated as total hours divided by days worked and average staff per day. 8.1 hours

No contractors work on this role.

Licensed Practical Nurse

Assists with medical care and medications.

Total count 13
Average shift length Info Average shift length. Calculated as total hours divided by days worked and average staff per day. 7.7 hours

No contractors work on this role.

Certified Nursing Assistant

Helps with daily care and mobility.

Total count 74
Average shift length Info Average shift length. Calculated as total hours divided by days worked and average staff per day. 7.6 hours

No contractors work on this role.

Contractor staffing

Total hours from contractors

0.6%

309 contractor hours this quarter

Occupational Therapy Assistant: 4 Qualified Social Worker: 1 Occupational Therapy Aide: 1 Medical Director: 1
Staff by category
Certified Nursing Assistant7407427,51491100%7.6
Registered Nurse290299,88791100%8.1
Licensed Practical Nurse130134,39591100%7.7
Respiratory Therapy Technician5051,4368492%7.2
Clinical Nurse Specialist4041,4206571%8.1
RN Director of Nursing3031,0966571%8.3
Physical Therapy Assistant4041,0708189%7.2
Other Dietary Services Staff3039808593%7.4
Dietitian3038767987%7.1
Qualified Social Worker7188656875%7.4
Speech Language Pathologist4045557785%7.1
Physical Therapy Aide4045547279%7
Administrator1015206571%8
Nurse Practitioner1014886167%8
Mental Health Service Worker1014836369%7.7
Dental Services Staff1014045358%7.6
Therapeutic Recreation Specialist1012414549%5.3
Occupational Therapy Aide0111882527%7.5
Occupational Therapy Assistant0445755%9.6
Medical Director0114433%14.5
74 Certified Nursing Assistant
% of Days 100%
29 Registered Nurse
% of Days 100%
13 Licensed Practical Nurse
% of Days 100%
5 Respiratory Therapy Technician
% of Days 92%
4 Clinical Nurse Specialist
% of Days 71%
3 RN Director of Nursing
% of Days 71%
4 Physical Therapy Assistant
% of Days 89%
3 Other Dietary Services Staff
% of Days 93%
3 Dietitian
% of Days 87%
8 Qualified Social Worker
% of Days 75%
4 Speech Language Pathologist
% of Days 85%
4 Physical Therapy Aide
% of Days 79%
1 Administrator
% of Days 71%
1 Nurse Practitioner
% of Days 67%
1 Mental Health Service Worker
% of Days 69%
1 Dental Services Staff
% of Days 58%
1 Therapeutic Recreation Specialist
% of Days 49%
1 Occupational Therapy Aide
% of Days 27%
4 Occupational Therapy Assistant
% of Days 5%
1 Medical Director
% of Days 3%

Facility Characteristics

Source: CMS Long-Term Care Facility Characteristics (Data as of Jan 2026)

Total census
127 residents
Residents by payment source
Medicare
15 residents (11.8%)
Medicaid
101 residents (79.5%)
Private pay or other
11 residents (8.7%)
Programs & Services
Residents' Group

Residents meet regularly to discuss policies, care quality, and activities

Active Resident Council

Organized group of residents that meets regularly to discuss facility policies, quality of life, and activities.

Quality of care over time

These measures show how residents usually do over time at this home, based on health outcomes and preventive care.

High-risk clinical events score Info A composite score based on pressure ulcers, falls with injury, weight loss, walking ability decline, and activities of daily living decline. 6.7
10% better than Florida average

Florida average: 7.4

Functional decline score Info A composite score based on activities of daily living decline, walking ability decline, and incontinence. 14.7
19% worse than Florida average

Florida average: 12.4

Long-stay resident measures
Significantly above average Florida avg: 4.6 Info CMS star rating based on long-stay quality measure performance. 5 stars = significantly above average, 1 star = significantly below average.
Need for Help with Daily Activities Increased Info Percent of long-stay residents whose need for help with daily activities has increased 7.2%
31% better than Florida average

Florida average: 10.5%

Walking Ability Worsened Info Percent of long-stay residents whose ability to move independently worsened 18.3%
42% worse than Florida average

Florida average: 12.9%

Low Risk Residents with Bowel/Bladder Incontinence Info Percent of low risk long-stay residents who lose control of their bowels or bladder 18.6%
38% worse than Florida average

Florida average: 13.5%

Falls with Major Injury Info Percent of long-stay residents experiencing one or more falls with major injury 2.4%
8% better than Florida average

Florida average: 2.6%

High Risk Residents with Pressure Ulcers Info Percent of long-stay high risk residents with pressure ulcers 4.3%
20% better than Florida average

Florida average: 5.4%

Urinary Tract Infection Info Percent of long-stay residents with a urinary tract infection 0.0%
100% better than Florida average

Florida average: 0.9%

Lost Too Much Weight Info Percent of long-stay residents who lose too much weight 1.2%
80% better than Florida average

Florida average: 6.0%

Depressive Symptoms Info Percent of long-stay residents who have depressive symptoms 0.5%
84% better than Florida average

Florida average: 3.3%

Antipsychotic Use Info Percent of long-stay residents who received an antipsychotic medication 2.4%
70% better than Florida average

Florida average: 8.0%

Pneumococcal Vaccine Info Percent of long-stay residents assessed and appropriately given the pneumococcal vaccine 100.0%
In line with Florida average

Florida average: 97.7%

Influenza Vaccine Info Percent of long-stay residents assessed and appropriately given the seasonal influenza vaccine 100.0%
In line with Florida average

Florida average: 99.2%

Hospitalizations per 1,000 days Info Number of hospitalizations per 1,000 long-stay resident days. 0.86
59% better than Florida average

Florida average: 2.10

ED visits per 1,000 days Info Number of outpatient emergency department visits per 1,000 long-stay resident days. 1.13
In line with Florida average

Florida average: 1.18

Short-stay resident measures
Significantly above average Florida avg: 2.9 Info CMS star rating based on short-stay quality measure performance. 5 stars = much above average, 1 star = much below average.
Pneumococcal Vaccine Info Percent of short-stay residents assessed and appropriately given the pneumococcal vaccine 98.4%
5% better than Florida average

Florida average: 94.0%

Antipsychotic medication increase Info Percent of short-stay residents who newly received an antipsychotic medication 0.3%
81% better than Florida average

Florida average: 1.5%

Influenza Vaccine Info Percent of short-stay residents assessed and appropriately given the seasonal influenza vaccine 99.1%
5% better than Florida average

Florida average: 94.7%

Re-hospitalized after SNF stay Info Percentage of short-stay residents who were re-hospitalized after their nursing home admission. 23.0%
12% better than Florida average

Florida average: 26.2%

Emergency department visits Info Percentage of short-stay residents who had an outpatient emergency department visit. 10.2%
10% worse than Florida average

Florida average: 9.3%

Falls with major injury Info Percentage of SNF residents who experience falls with major injury during their stay. 0.4%
51% better than Florida average

Florida average: 0.8%

Ability to care for self at discharge Info Percentage of residents at or above expected ability to care for themselves at discharge. 72.3%
35% better than Florida average

Florida average: 53.7%

Successful return to home or community Info Rate of successful return to home or community from a skilled nursing facility. 57.1%
13% better than Florida average

Florida average: 50.6%

Penalties and fines

Federal penalties imposed by CMS for regulatory violations, including civil money penalties (fines) and denials of payment for new Medicare/Medicaid admissions.

Source: CMS Penalties Database (Data as of Jan 2026)

Total fines amount $52K
28% lower than Florida average

Florida average: $72K

Number of fines 1
62% fewer fines than Florida average

Florida average: 2.6

Payment Denials Info Serious action where Medicare and/or Medicaid temporarily stops payments for new residents until issues are fixed. 0
100% fewer payment denials than Florida average

Florida average: 0.1

Fines amount comparison
This facility $52K
Florida average $72K
Penalty History

Penalties are imposed by CMS for violations of federal nursing home regulations.

Civil Money Penalty Info Fines imposed for noncompliance, which can be assessed per day or per instance of violation. Apr 20, 2023
$52K

Last updated: Jan 2026

Guides for Better Senior Living

Care Cost Calculator: See Prices in Your Area

Nursing Home Data Explorer

Don’t Wait Too Long: 7 Red Flag Signs Your Parent Needs Assisted Living Now

The True Cost of Assisted Living in 2025 – And How Families Are Paying For It

Understanding Senior Living Costs: Pricing Models, Discounts & Financial Assistance

Financial Aid for Florida Seniors

Get financial aid guidance

Long-Term Care Waiver

Florida Medicaid LTC Waiver

Age 65+ or 21+ disabled, Florida resident, Medicaid- eligible, nursing home-level care need.

~$2,829/month (300% FBR, individual).

$2,000 (individual), $3,000 (couple).

High demand; waitlists common.

Community Care for the Elderly (CCE)

Florida CCE

Age 60+, Florida resident, at risk of nursing home.

~$2,000/month (varies).

$5,000 (individual).

Limited funding; regional variation.

Home Care for the Elderly (HCE)

Florida Home Care for the Elderly

Age 60+, Florida resident, at risk of nursing home placement; caregiver must be approved.

~$2,829/month (individual, aligned with Medicaid thresholds).

~$2,000 (individual); varies by case manager discretion.

Limited funding (~3,500 served annually); prioritizes low-income frail seniors.

Program of All-Inclusive Care for the Elderly (PACE)

Florida Medicaid PACE

Age 55+, Florida resident, nursing home-level care need, safe with PACE support.

~$2,829/month (300% FBR).

$2,000 (individual), $3,000 (couple).

Limited to specific counties (e.g., Hillsborough, Miami-Dade); ~10 sites statewide.

Optional State Supplementation (OSS)

Florida Optional State Supplementation

Age 65+ or disabled, Florida resident, living in approved facility, receiving SSI or low-income.

~$1,004/month (individual, including SSI).

$2,000 (individual), $3,000 (couple).

Limited to specific facility types; ~$78.40/month max supplement.

Senior Community Service Employment Program (SCSEP)

Florida SCSEP (federally funded, state-administered)

Age 55+, unemployed, low-income, Florida resident.

~$1,983/month (125% FPL, individual).

Not specified; income-focused.

Priority for veterans, rural residents; ~1,000 slots/year.

Tour Icon
Planning a tour? Check our touring checklist.
Chat Icon
Thinking of living here? We can help you speak to a current resident