Life Care Center of Palm Bay

Nursing Home in Palm Bay

CMS overall rating Info The Overall CMS Rating is scored from 1 to 5 stars and combines results from health inspections, staffing levels, and quality measures. Health inspections carry the most weight. Staffing and quality scores can increase or decrease the final rating based on performance compared to state and national standards.
Calculator: See prices in your area
Life Care Center of Palm Bay accepts Medicare, Medicaid, and private pay.

Overview of Life Care Center of Palm Bay

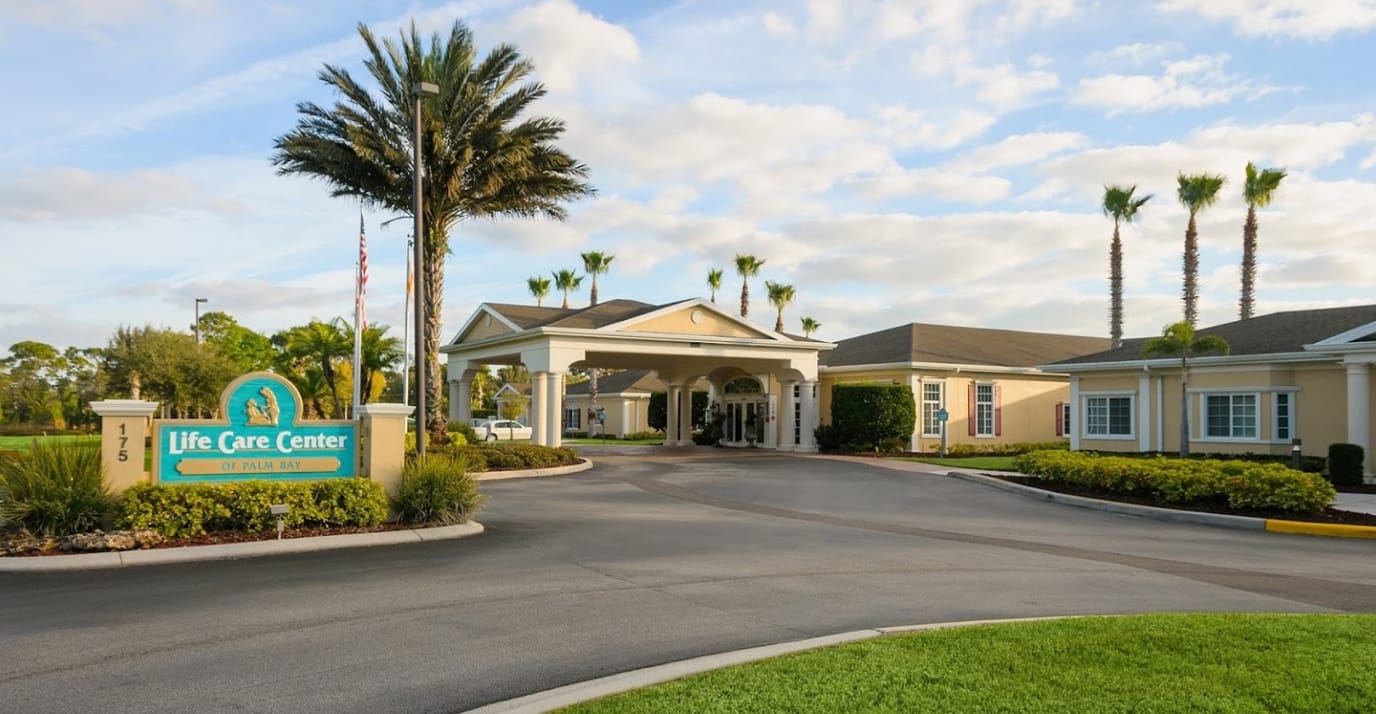
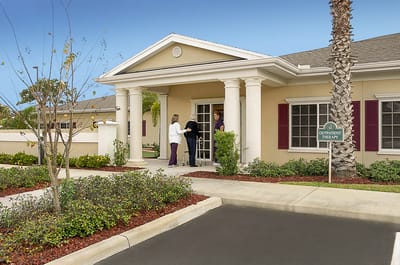
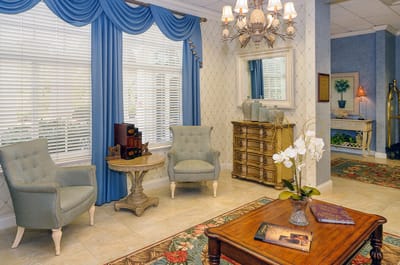
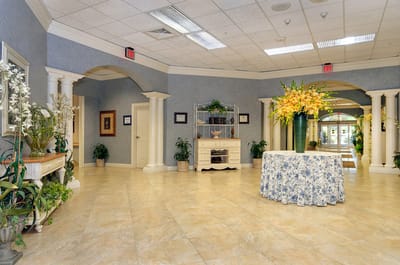
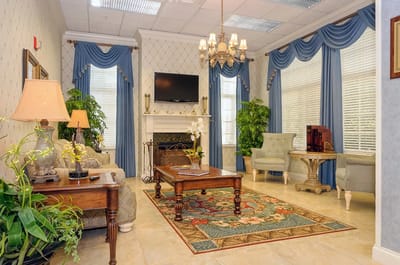
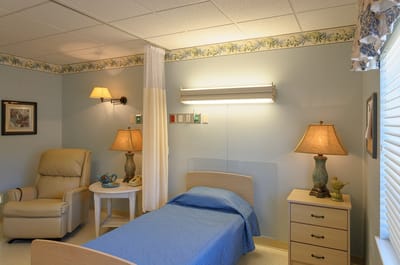
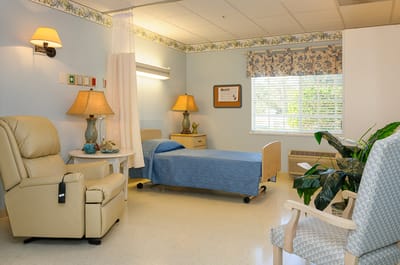
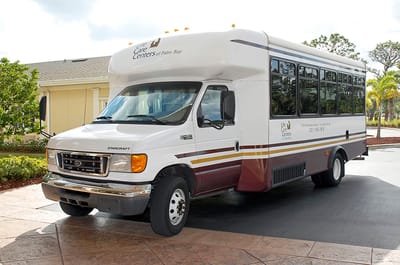
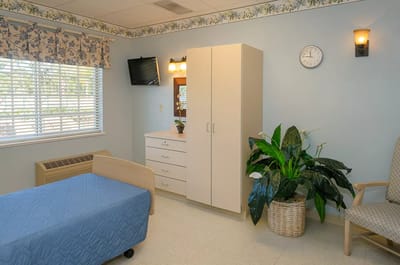
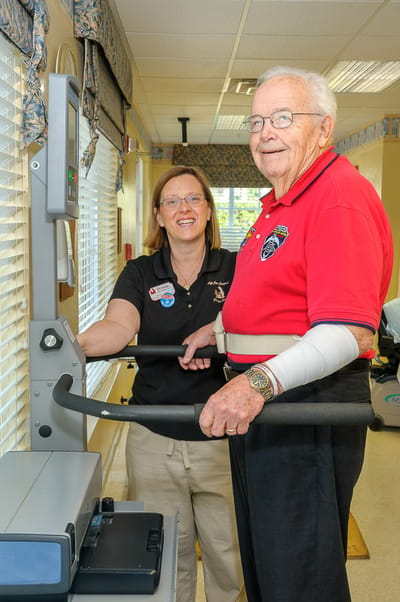
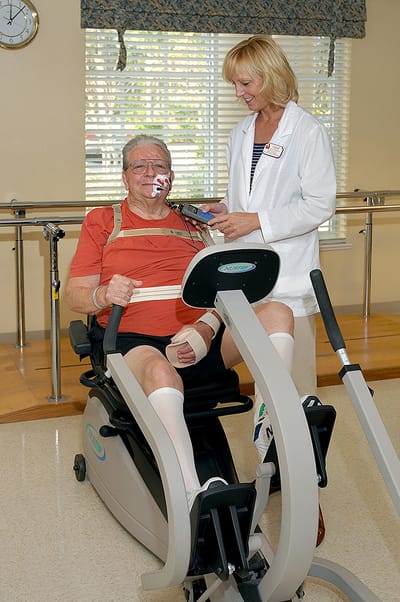
Life Care Center of Palm Bay is a skilled nursing and rehabilitation facility located in Palm Bay, FL. This long-term care facility provides 24 hour skilled nursing care and security to its patients and residents, as well as medication management, post surgical care, wound care, IV therapy and infection management.

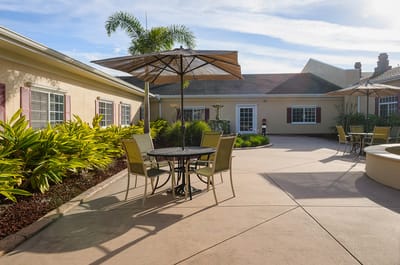
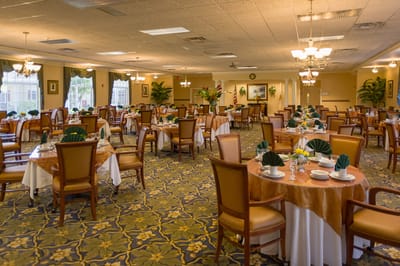
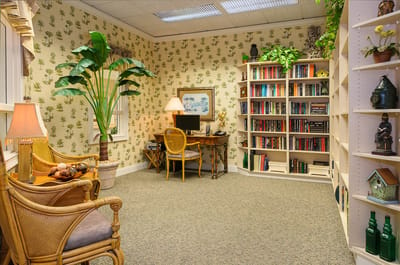
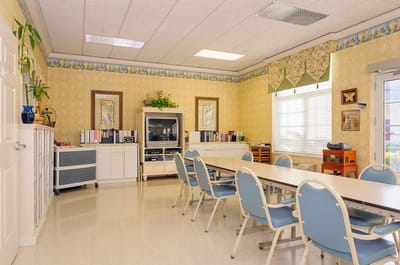
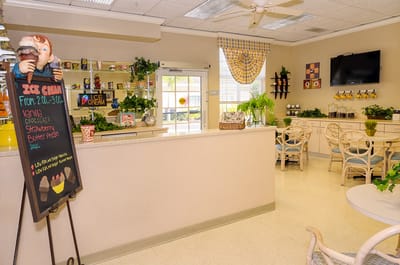
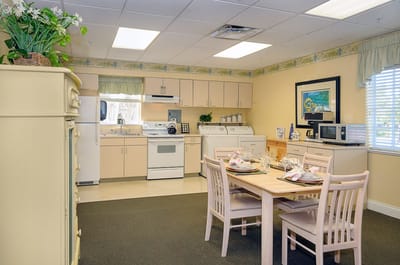
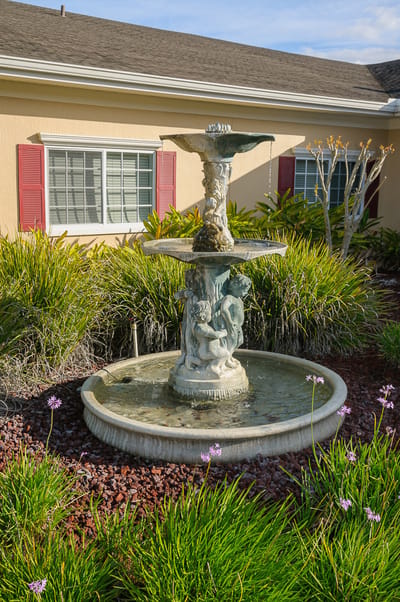
The long-term residents of this care facility are confident that their care is in good hands, with the meal services prepared by  certified dieticians, housekeeping and laundry services, and access to library and landscaped grounds. The whole facility itself is also smoke free and pet friendly, providing opportunities for patients and residents alike to breathe fresh air and bond with furry companions.

(321) 952-1818

Quality ratings

Measured by Centers for Medicare & Medicaid Services (CMS)

Overall rating Info The Overall CMS Rating combines results from health inspections, staffing levels and quality measures. Health inspections carry the most weight. Staffing and quality scores can increase or decrease the final rating based on performance compared to state and national standards.
5/5 ▲ 1.8 Florida average: 3.2/5
Health Inspection Info Based on the results of the facility's three most recent standard inspections and any complaint investigations. CMS reviews the number, scope, and severity of deficiencies, with more recent findings weighted more heavily.
4/5 ▲ 1.2 Florida average: 2.8/5
Staffing Info Measures average nursing staff hours per resident per day, including Registered Nurses (RNs) and total nursing staff. Ratings are adjusted based on the level of care residents require and are compared to state and national benchmarks.
4/5 ▲ 0.6 Florida average: 3.4/5
Quality Measures Info Based on clinical and physical health indicators reported to CMS, such as hospital readmissions, falls, pressure ulcers, and improvements in mobility. These measures reflect how well residents' health needs are being managed.
5/5 ▲ 0.9 Florida average: 4.1/5

Staffing hours breakdown

Info Daily nursing hours per resident by staff type, reported to CMS. Higher is generally better — compare this facility to state and national averages to see where staffing stands.

Hours per resident per day — compared to Florida state averages

Total nursing care / resident Info This home is ranked 63rd out of 157 homes in Florida.

Total adjusted nursing hours per resident per day, combining RN, LPN, and aide time. CMS adjusts this for case-mix so facilities can be fairly compared.
4h 4m per day
Rank #63 / 157Nurse hours — state benchmarkedThis home is ranked 63rd out of 157 homes in Florida.Shows adjusted nurse hours per resident per day benchmarked to the Florida average, with a ranking across 157 Florida SNFs. More hours mean more direct care. The national average is about 3.5 hrs; below 3.0 is a red flag.
This facility Florida avg (4h 2m per day)
vs Florida avg
+1%

2 of 6 metrics below state avg

Standout metric RN (Weekend) is +53% above state avg
Staff typeHours / dayvs state avg
Registered Nurse (RN) Info RNs hold the highest nursing license and can assess residents, interpret test results, and direct care plans. More RN hours per day often signals stronger clinical oversight and faster response to health changes. 59m per day ▲ 34% State avg: 44m per day · National avg: 41m per day
LPN / LVN Info Licensed Practical Nurses (LPNs) or Licensed Vocational Nurses (LVNs) deliver routine hands-on care — medication administration, wound dressing, and monitoring vital signs. They work under RN supervision and make up a large share of daily bedside care. 29m per day ▼ 38% State avg: 47m per day · National avg: 52m per day
Nurse Aide Info Certified Nurse Aides (CNAs) provide the most direct day-to-day assistance: bathing, dressing, feeding, and mobility. Nurse aide hours are typically the largest staffing category and directly affect residents' quality of life. 2h 18m per day ■ Avg State avg: 2h 20m per day · National avg: 2h 21m per day
Total Nursing (Weekend) Info Combined nursing hours (RN + LPN + Nurse Aide) per resident per day on weekends. Staffing often drops on weekends — this figure reveals whether the facility maintains adequate coverage outside of weekday hours. 3h 16m per day ▼ 7% State avg: 3h 31m per day · National avg: 3h 26m per day
Physical Therapist Info Hours per resident per day provided by licensed Physical Therapists (PTs) or PT Assistants. PT services help residents recover mobility after injury or illness and are especially important for post-acute (short-stay) rehabilitation. 7m per day ▲ 40% State avg: 5m per day · National avg: 4m per day
RN (Weekend) Info Registered nurse hours specifically on weekends. Facilities sometimes reduce RN presence on Saturdays and Sundays — a low weekend RN figure compared to weekday hours can indicate reduced clinical oversight when most administrative staff are absent. 49m per day ▲ 53% State avg: 32m per day · National avg: 29m per day

Capacity and availability

This home usually has limited availability

Occupancy between 85% and 95% suggests balanced demand.

Higher occupancy than the Florida average: 84.3%
Occupancy rate 94% Rank #29 / 159Occupancy rate — state benchmarkedThis home is ranked 29th out of 159 homes in Florida.Shows this facility's occupancy rate versus the Florida average, with its statewide rank out of 159. Higher occupancy signals strong local demand and financial stability.
Avg. Length of Stay 76 days
Occupancy rate
94% Rank #29 / 159Occupancy rate — state benchmarkedThis home is ranked 29th out of 159 homes in Florida.Shows this facility's occupancy rate versus the Florida average, with its statewide rank out of 159. Higher occupancy signals strong local demand and financial stability.
Avg. Length of Stay
76 days

Who this home usually serves

TYPE OF STAY

Mostly short-term rehab stays

Most residents typically stay for a few weeks or months before returning home or moving on.

Breakdown by payment type

Medicare

46% of new residents, usually for short-term rehab.

Typical stay 22 days

Private pay

39% of new residents, often for short stays.

Typical stay 1 - 2 months

Medicaid

15% of new residents, often for long-term daily care.

Typical stay 9 - 10 months

Finances and operations

Privately-owned community
Home revenue
$25.8M
Profit
$1.7M
Privately-owned community
Home revenue
$25.8M Rank #23 / 160Revenue — state benchmarkedThis home is ranked 23rd out of 160 homes in Florida.Shows this facility's annual revenue compared to the Florida SNF average. Higher revenue generally means more resources for staffing and capital — read alongside Payroll %.
Profit
$1.7M
Payroll costs Info The portion of the home's budget spent on staff, including nurses, caregivers, and other employees who support care and operations. Rank #59 / 160Payroll — state benchmarkedThis home is ranked 59th out of 160 homes in Florida.Shows total annual staff payroll benchmarked to the Florida average. Higher payroll investment relative to peers often signals better staffing and less reliance on cheaper contract labor.
$8.0M
30.9% of revenue Rank #133 / 160Payroll % — state benchmarkedThis home is ranked 133rd out of 160 homes in Florida.Shows payroll as a percentage of revenue versus the Florida average. Well-run SNFs often land around 55–65%. Below 25% may signal understaffing or heavy agency use — read with Staffing ratings.
Other operating costs Info All remaining costs needed to run the home, such as food, utilities, building maintenance, supplies and administrative expenses.
$16.1M
Total costs $24.1M
Walk Score
Walk Score: 32 / 100 Rank #86 / 133Walk Score — state benchmarkedThis home is ranked 86th out of 133 homes in Florida.Shows how walkable this facility's neighborhood is compared to the average Walk Score across Florida SNFs. Higher scores benefit residents, families, and staff.
Somewhat walkable. A few nearby services may be reachable on foot, but most trips require transportation.

About this community

Awards

AwardsBest Nursing Home - U.S. News & World Report 2026

License Details

Safety & Compliance

Safety Features24-hour security and fire safety systems

Therapy & Rehabilitation

1 service
Rehabilitation Services

Staffing & Medical

1 service
24-Hour Staffing

Amenities & Lifestyle

Beauty Salon And Barber Shop
Bedside And Bathroom Call Lights
Certified Dietitian
Community Re-Entry Program
Complimentary Wireless Internet
Daily Activity Schedule
Family/Resident Councils
Fine Dining Program
Flat-Screen Tvs
Flexible Visiting Hours
Full-Time
Certified Activity Director
Homelike Setting
Housekeeping And Laundry Services
Landscaped Grounds And Courtyards
Library
Non-Smoking Facility
Pet Visitors Allowed
Private And Semiprivate Rooms
Private Bathrooms
Religious Services
Patient/Family Education Program
Telephone And Cable Television Hookups
Transportation Services
ActivitiesDaily activity schedule available.
Specific ProgramsAlzheimer's & Dementia Care, Independent & Assisted Living
Religious ServicesYes

Dining & Nutrition

Food DescriptionLife Care Center of Palm Bay offers fine dining programs and has an in-house ice cream parlor.

Types of Care at Life Care Center of Palm Bay

Skilled Nursing

Contact Life Care Center of Palm Bay

Health Inspection History

Inspections
Total health inspections 3

Florida average 4.3


Last Health inspection on Jan 2025

Total health citations
8 Rank #24 / 158Health citations — state benchmarkedThis home is ranked 24th out of 158 homes in Florida.Shows this facility's total health deficiency citations benchmarked to the Florida state average, with a ranking across all 158 FL SNFs. Lower citation counts earn a better rank.

Florida average 19.7

Citations per inspection
2.67 Rank #27 / 158Citations per inspection — state benchmarkedThis home is ranked 27th out of 158 homes in Florida.Shows average deficiency citations per CMS inspection for this facility versus the Florida mean across 158 SNFs with citation data. Lower is better.

Florida average 4.48


Health citations are formal notices following inspections when they fail to comply with safety and care standards.

All 8 citations resulted from standard inspections.

Breakdown of citation severity (last 3 years)
Critical Health citations More info
0
100% better than Florida average

Florida average: 0.8


Serious Health citations More info 2
400% worse than Florida average

Florida average: 0.4

0 critical citations More info Florida average: 0.8

2 serious citations More info Florida average: 0.4

6 moderate citations More info Florida average: 18.4

0 minor citations More info Florida average: 0.2
Citations history (last 3 years)
Quality of Care moderate citation Info Issues related to how well residents receive appropriate treatment and support for their medical and daily care needs. Jan 09, 2025
Corrected

Care Planning moderate citation Info Issues related to creating and updating personalized care plans for residents based on their needs and conditions. Jan 09, 2025
Corrected

Nutrition moderate citation Info Issues related to food quality, meal service, and resident's nutritional needs. Apr 20, 2023
Corrected

Quality of Care moderate citation Info Issues related to how well residents receive appropriate treatment and support for their medical and daily care needs. Apr 20, 2023
Corrected

Financial Assistance for
Nursing Home in Florida

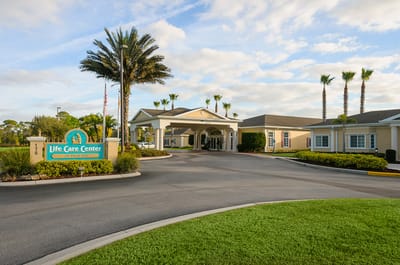
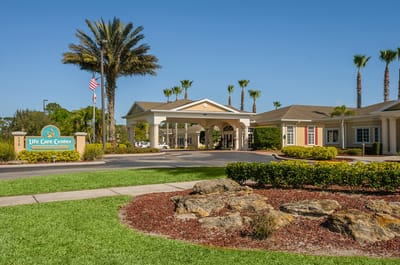
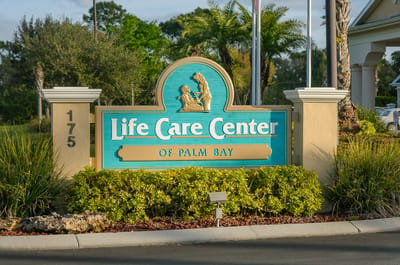
Life Care Center of Palm Bay is located in Palm Bay, Florida.
Here are the financial assistance programs available to residents in Florida.

Get Financial aid guidance

Long-Term Care Waiver

Florida Medicaid LTC Waiver

Age 65+ or 21+ disabled
General Florida resident, Medicaid- eligible, nursing home-level care need.
Income Limits (2025) ~$2,829/month 300% FBR, individual
Asset Limits $2,000 (individual), $3,000 (couple).
FL

High demand; waitlists common.

Benefits
In-home care (6-8 hours/day) Assisted living Respite (240 hours/year) Case management

Community Care for the Elderly (CCE)

Florida CCE

Age 60+
General Florida resident, at risk of nursing home.
Income Limits ~$2,000/month varies
Asset Limits $5,000 individual
FL

Limited funding; regional variation.

Benefits
Homemaker services (3-5 hours/week) Adult day care (~$60/day) Respite (up to 10 days/year)

Home Care for the Elderly (HCE)

Florida Home Care for the Elderly

Age 60+
General Florida resident, at risk of nursing home placement; caregiver must be approved.
Income Limits (2025) ~$2,829/month individual, aligned with Medicaid thresholds
Asset Limits ~$2,000 (individual); varies by case manager discretion.
FL

Limited funding (~3,500 served annually); prioritizes low-income frail seniors.

Benefits
Basic subsidy (~$160/month) for housing/medical costs; special subsidies for supplies/services (e.g., incontinence supplies, ~$50-$200/month)

Program of All-Inclusive Care for the Elderly (PACE)

Florida Medicaid PACE

Age 55+
General Florida resident, nursing home-level care need, safe with PACE support.
Income Limits (2025) ~$2,829/month 300% FBR
Asset Limits $2,000 (individual), $3,000 (couple).
FL

Limited to specific counties (e.g., Hillsborough, Miami-Dade); ~10 sites statewide.

Benefits
Personal care (5-7 hours/day) Medical care Meals Transportation Therapy

Optional State Supplementation (OSS)

Florida Optional State Supplementation

Age 65+ or disabled
General Florida resident, living in approved facility, receiving SSI or low-income.
Income Limits (2025) ~$1,004/month individual, including SSI
Asset Limits $2,000 (individual), $3,000 (couple).
FL

Limited to specific facility types; ~$78.40/month max supplement.

Benefits
Cash payment (~$78.40/month) for room/board or personal needs in facilities

Senior Community Service Employment Program (SCSEP)

Florida SCSEP (federally funded, state-administered)

Age 55+
General unemployed, low-income, Florida resident.
Income Limits (2025) ~$1,983/month 125% FPL, individual
Asset Limits Not specified; income-focused.
FL

Priority for veterans, rural residents; ~1,000 slots/year.

Benefits
Paid training (~20 hours/week at ~$7.25/hour) Job placement

Places of interest near Life Care Center of Palm Bay

Address 5.0 miles from city center Info Estimated distance in miles from Palm Bay's city center to Life Care Center of Palm Bay's address, calculated via Google Maps. — 0.2 miles to nearest hospital (Health First Palm Bay Hospital)

Calculate Travel Distance to Life Care Center of Palm Bay

Add your location

Address

Staffing Data (Q2 2025)

This data corresponds to Q2 2025 and is based on CMS Payroll-Based Journal.

Total staff 165
Employees 158
Contractors 7
Staff to resident ratio 1.30:1
14% worse than Florida average

Florida average ratio: 1.52:1

Avg staff/day 76
Average shift 7.7 hours
0% compared with Florida average

Florida average: 7.9 hours

Total staff hours (quarter) 53,070
Nursing staff breakdown
Registered Nurse

Manages medical care and health needs.

Total count 29
Average shift length Info Average shift length. Calculated as total hours divided by days worked and average staff per day. 8.1 hours

No contractors work on this role.

Licensed Practical Nurse

Assists with medical care and medications.

Total count 13
Average shift length Info Average shift length. Calculated as total hours divided by days worked and average staff per day. 7.7 hours

No contractors work on this role.

Certified Nursing Assistant

Helps with daily care and mobility.

Total count 74
Average shift length Info Average shift length. Calculated as total hours divided by days worked and average staff per day. 7.6 hours

No contractors work on this role.

Contractor staffing

Total hours from contractors

0.6%

309 contractor hours this quarter

Occupational Therapy Assistant: 4 Qualified Social Worker: 1 Occupational Therapy Aide: 1 Medical Director: 1
Staff by category
Certified Nursing Assistant7407427,51491100%7.6
Registered Nurse290299,88791100%8.1
Licensed Practical Nurse130134,39591100%7.7
Respiratory Therapy Technician5051,4368492%7.2
Clinical Nurse Specialist4041,4206571%8.1
RN Director of Nursing3031,0966571%8.3
Physical Therapy Assistant4041,0708189%7.2
Other Dietary Services Staff3039808593%7.4
Dietitian3038767987%7.1
Qualified Social Worker7188656875%7.4
Speech Language Pathologist4045557785%7.1
Physical Therapy Aide4045547279%7
Administrator1015206571%8
Nurse Practitioner1014886167%8
Mental Health Service Worker1014836369%7.7
Dental Services Staff1014045358%7.6
Therapeutic Recreation Specialist1012414549%5.3
Occupational Therapy Aide0111882527%7.5
Occupational Therapy Assistant0445755%9.6
Medical Director0114433%14.5
74 Certified Nursing Assistant
% of Days 100%
29 Registered Nurse
% of Days 100%
13 Licensed Practical Nurse
% of Days 100%
5 Respiratory Therapy Technician
% of Days 92%
4 Clinical Nurse Specialist
% of Days 71%
3 RN Director of Nursing
% of Days 71%
4 Physical Therapy Assistant
% of Days 89%
3 Other Dietary Services Staff
% of Days 93%
3 Dietitian
% of Days 87%
8 Qualified Social Worker
% of Days 75%
4 Speech Language Pathologist
% of Days 85%
4 Physical Therapy Aide
% of Days 79%
1 Administrator
% of Days 71%
1 Nurse Practitioner
% of Days 67%
1 Mental Health Service Worker
% of Days 69%
1 Dental Services Staff
% of Days 58%
1 Therapeutic Recreation Specialist
% of Days 49%
1 Occupational Therapy Aide
% of Days 27%
4 Occupational Therapy Assistant
% of Days 5%
1 Medical Director
% of Days 3%

Facility Characteristics

Source: CMS Long-Term Care Facility Characteristics (Data as of Jan 2026)

Total residents 127
Medicare
15
11.8% of residents
Medicaid
101
79.5% of residents
Private pay or other
11
8.7% of residents
Programs & Services
Residents Group

Residents meet regularly to discuss policies, care quality, and activities

Active Resident Council

Organized group of residents that meets regularly to discuss facility policies, quality of life, and activities.

Quality of care over time

These measures show how residents usually do over time at this home, based on health outcomes and preventive care.

High-risk clinical events score Info A composite score based on pressure ulcers, falls with injury, weight loss, walking ability decline, and activities of daily living decline. 6.7
10% better than Florida average

Florida average: 7.4

Functional decline score Info A composite score based on activities of daily living decline, walking ability decline, and incontinence. 14.7
19% worse than Florida average

Florida average: 12.4

Long-stay resident measures
Significantly above average Florida avg: 4.5 Info CMS star rating based on long-stay quality measure performance. 5 stars = significantly above average, 1 star = significantly below average.
Need for Help with Daily Activities Increased Info Percent of long-stay residents whose need for help with daily activities has increased 7.2%
31% better than Florida average

Florida average: 10.5%

Walking Ability Worsened Info Percent of long-stay residents whose ability to move independently worsened 18.3%
42% worse than Florida average

Florida average: 12.9%

Low Risk Residents with Bowel/Bladder Incontinence Info Percent of low risk long-stay residents who lose control of their bowels or bladder 18.6%
38% worse than Florida average

Florida average: 13.5%

Falls with Major Injury Info Percent of long-stay residents experiencing one or more falls with major injury 2.4%
8% better than Florida average

Florida average: 2.6%

High Risk Residents with Pressure Ulcers Info Percent of long-stay high risk residents with pressure ulcers 4.3%
20% better than Florida average

Florida average: 5.4%

Urinary Tract Infection Info Percent of long-stay residents with a urinary tract infection 0.0%
100% better than Florida average

Florida average: 0.9%

Lost Too Much Weight Info Percent of long-stay residents who lose too much weight 1.2%
80% better than Florida average

Florida average: 6.0%

Depressive Symptoms Info Percent of long-stay residents who have depressive symptoms 0.5%
84% better than Florida average

Florida average: 3.3%

Antipsychotic Use Info Percent of long-stay residents who received an antipsychotic medication 2.4%
70% better than Florida average

Florida average: 8.0%

Pneumococcal Vaccine Info Percent of long-stay residents assessed and appropriately given the pneumococcal vaccine 100.0%
In line with Florida average

Florida average: 97.7%

Influenza Vaccine Info Percent of long-stay residents assessed and appropriately given the seasonal influenza vaccine 100.0%
In line with Florida average

Florida average: 99.2%

Hospitalizations per 1,000 days Info Number of hospitalizations per 1,000 long-stay resident days. 0.86
59% better than Florida average

Florida average: 2.10

ED visits per 1,000 days Info Number of outpatient emergency department visits per 1,000 long-stay resident days. 1.13
In line with Florida average

Florida average: 1.18

Short-stay resident measures
Significantly above average Florida avg: 3.1 Info CMS star rating based on short-stay quality measure performance. 5 stars = much above average, 1 star = much below average.
Pneumococcal Vaccine Info Percent of short-stay residents assessed and appropriately given the pneumococcal vaccine 98.4%
5% better than Florida average

Florida average: 94.0%

Antipsychotic medication increase Info Percent of short-stay residents who newly received an antipsychotic medication 0.3%
81% better than Florida average

Florida average: 1.5%

Influenza Vaccine Info Percent of short-stay residents assessed and appropriately given the seasonal influenza vaccine 99.1%
5% better than Florida average

Florida average: 94.7%

Re-hospitalized after SNF stay Info Percentage of short-stay residents who were re-hospitalized after their nursing home admission. 23.0%
12% better than Florida average

Florida average: 26.2%

Emergency department visits Info Percentage of short-stay residents who had an outpatient emergency department visit. 10.2%
10% worse than Florida average

Florida average: 9.3%

Falls with major injury Info Percentage of SNF residents who experience falls with major injury during their stay. 0.4%
51% better than Florida average

Florida average: 0.8%

Ability to care for self at discharge Info Percentage of residents at or above expected ability to care for themselves at discharge. 72.3%
35% better than Florida average

Florida average: 53.7%

Successful return to home or community Info Rate of successful return to home or community from a skilled nursing facility. 57.1%
13% better than Florida average

Florida average: 50.6%

Penalties and fines

Federal penalties imposed by CMS for regulatory violations, including civil money penalties (fines) and denials of payment for new Medicare/Medicaid admissions.

Source: CMS Penalties Database (Data as of Jan 2026)

Total fines amount $52K
28% lower than Florida average

Florida average: $72K

Number of fines 1
62% fewer fines than Florida average

Florida average: 2.6

Payment Denials Info Serious action where Medicare and/or Medicaid temporarily stops payments for new residents until issues are fixed. 0
100% fewer payment denials than Florida average

Florida average: 0.1

Fines amount comparison
This facility $52K
Florida average $72K
Penalty History

Penalties are imposed by CMS for violations of federal nursing home regulations.

No penalties in the past 3 years

No civil money penalties or payment denials were reported in the last 3 years.

Compare Nursing Homes around Palm Bay The information below is reported by the Florida Agency for Health Care Administration (AHCA).

1 facility compared · CMS & FL Dept. of Health data · Updated Apr 2026

Filter by care type
Life Care Center of Palm Bay
AL

Assisted Living A licensed, long-term care setting for seniors or individuals with disabilities who need help with daily activities — like bathing, dressing, and medication management — but not 24-hour skilled nursing. Offers housing, meals, and around-the-clock support while aiming to maximize resident independence.

NH

Nursing Home Licensed facility providing 24/7 skilled nursing care for residents with complex, ongoing medical needs. Staffed by RNs, LPNs, and CNAs. Inspected and star-rated annually by CMS. Accepts Medicare (short-term rehab) and Medicaid (long-term care).

Palm Bay141 94.0% +12%4.06 +48%+1%182.72135 32 Tarbet, Willard$25.8M$8.0M30.9%106060

Guides for Better Senior Living

Care Cost Calculator: See Prices in Your Area

Nursing Home Data Explorer

Don’t Wait Too Long: 7 Red Flag Signs Your Parent Needs Assisted Living Now

The True Cost of Assisted Living in 2025 – And How Families Are Paying For It

Understanding Senior Living Costs: Pricing Models, Discounts & Financial Assistance

Explore Open Rooms
1 Contact details
2 What type of senior care service are you looking for?
3 What budget do you have in mind for senior care?
4 How soon do you need to find care?
5 Additional details

Thank you for your interest!

Our team will be in touch shortly to help with next steps.