Occupancy rate
92%

We arrange tours, appointments, and even moving support so you don’t have to
Thank you for your interest!
Our team will be in touch shortly to help with next steps.
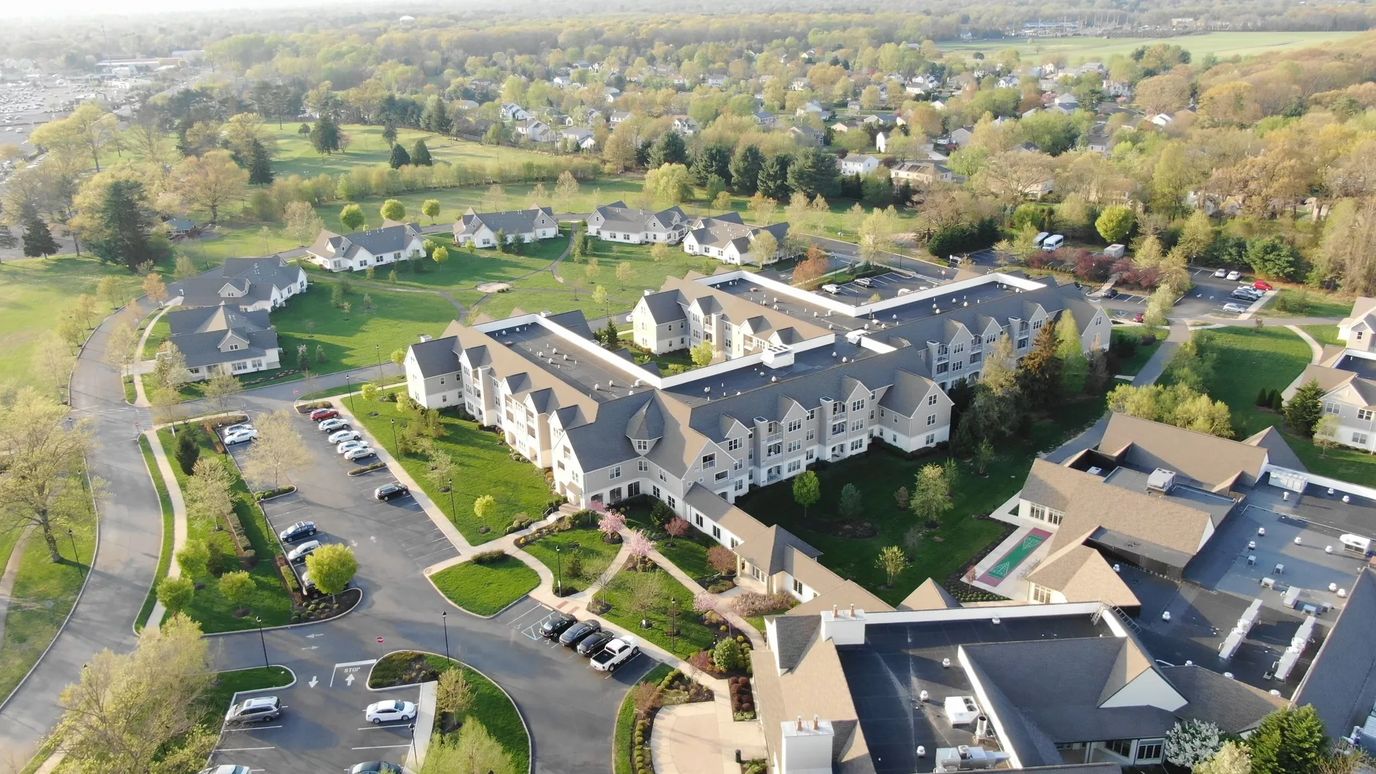
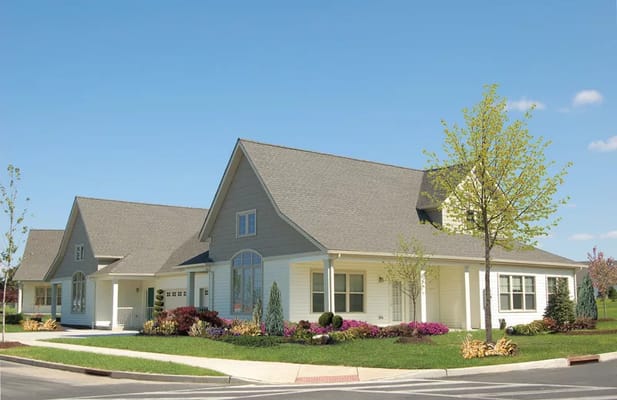
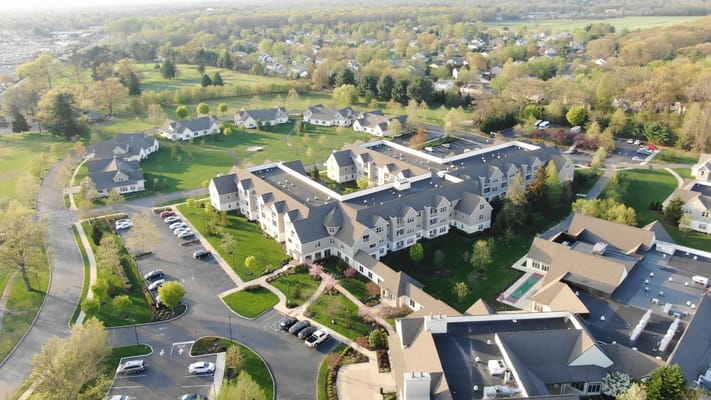
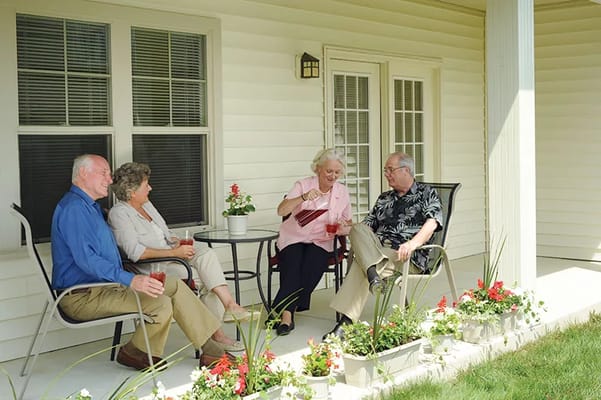
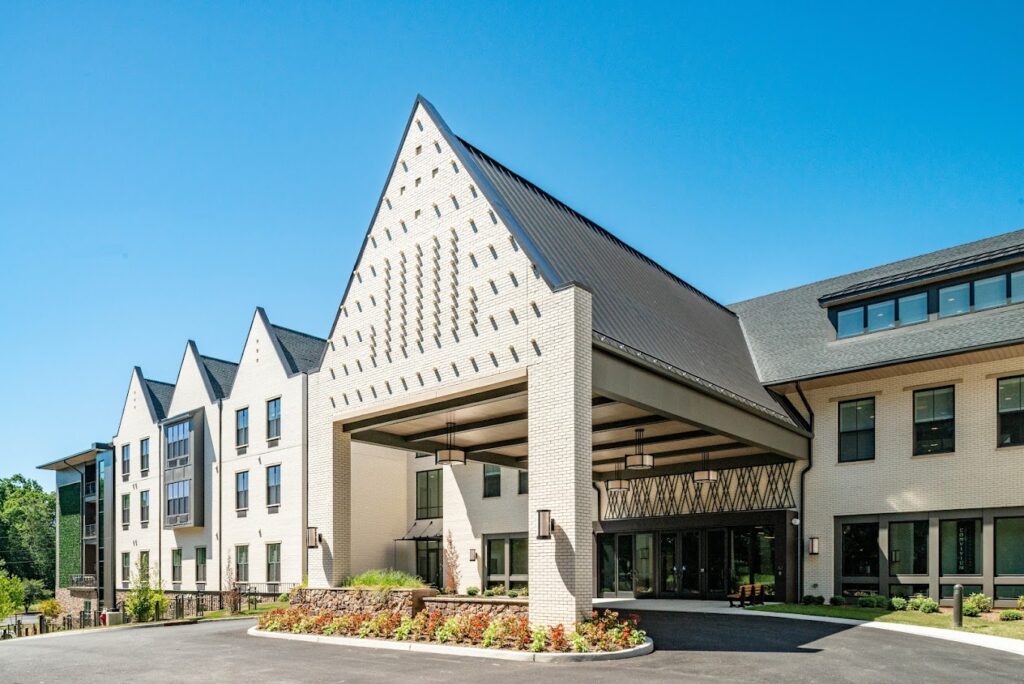
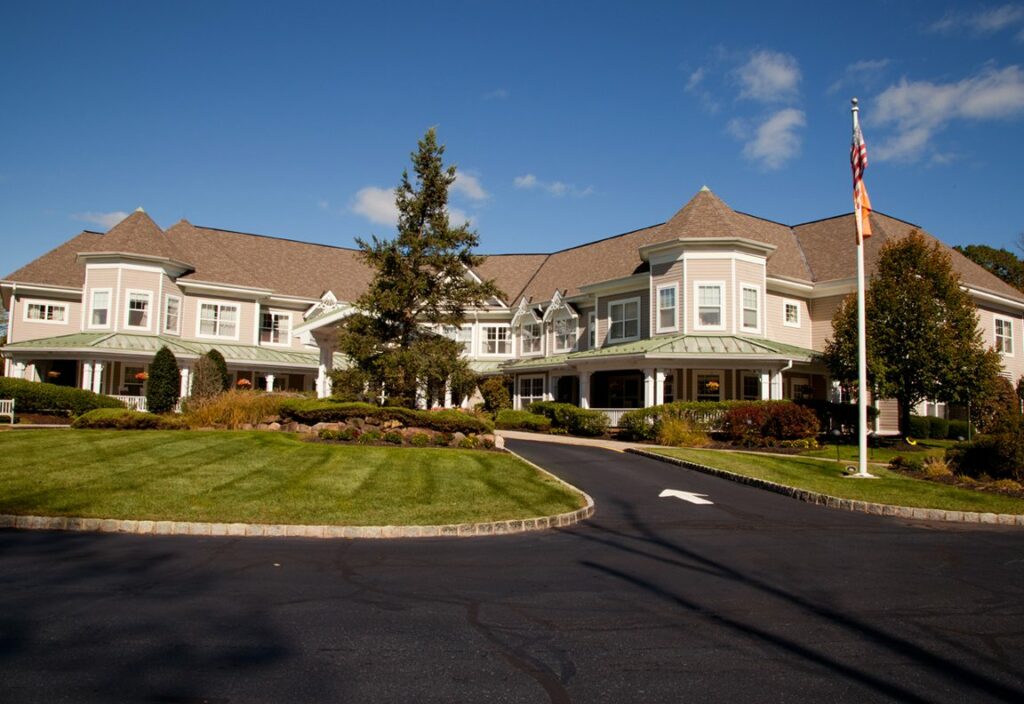
Located in Voorhees, New Jersey, Lions Gate offers a liberating and vibrant lifestyle for the golden years. This community stands as a safe and active haven, providing a range of living options, including independent living, assisted living, memory care, and short-term rehabilitation services. With skilled nursing and a life-plan community, residents can enjoy resort-style living in a serene and peaceful suburban setting, exuding a classic feel that feels just like home. Each detail, from furniture selection to interior design, radiates a warm familial charm, making it easy for residents to engage in various activities and unleash their creativity.
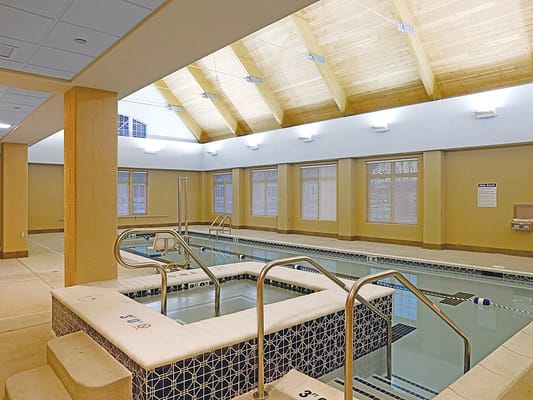
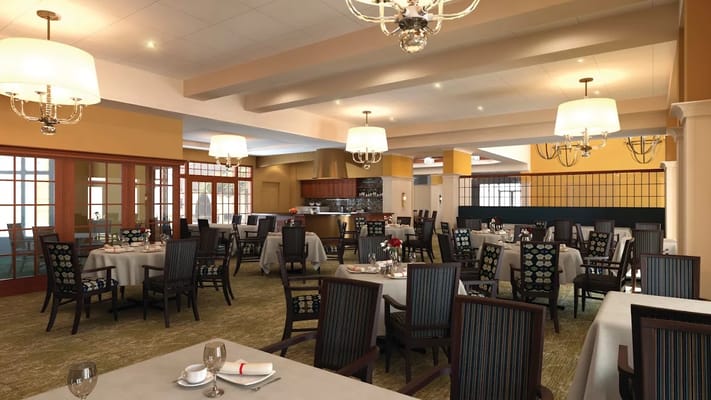
Lions Gate boasts an array of campus amenities that add to the enchanting living experience. From a gift shop to a library and a computer center, residents can explore diverse interests. The community also features a heated pool and spa, complemented by concierge services. For socializing with friends, there’s a restaurant-style dining area and a bar or lounge. Adding to the convenience and pleasure of living, Lions Gate offers a game room, a salon, and a barber shop. These delightful touches are just some of what Lions Gate has in store for its residents.
Lions Gate is proud to be a Kosher community and an agency of the Jewish Federation of Southern New Jersey.
Offers a balance of services and community atmosphere.
Occupancy is moderate, suggesting balanced demand.
Most residents typically stay for a few weeks or months before returning home or moving on.
68% of new residents, usually for short-term rehab.
30% of new residents, often for short stays.
2% of new residents, often for long-term daily care.
Lions Gate is legally operated by Sjf-ccrc, Inc., and administrated by Cristina Palella.
Brian Zell, Dave Thompson, Ian Meklinsky, Mark Rosen, Mark Adler, Meredith Becker, Michael Frankel, Naomi Schimmer
In New Jersey, the Department of Health, Health Facilities Evaluation and Licensing conducts mandatory unannounced surveys to ensure facilities provide safe and effective resident care.
2 complaint inspections
9 routine inspections
New Jersey average: 8 visits/inspections
New Jersey average: 6 inspections
On a scale from A (least severe) to L (most severe).
Deficiencies indicate regulatory issues. A higher number implies the facility had several areas requiring improvement.
New Jersey average: 18 deficiencies
Deficiencies indicate regulatory issues. A higher number implies the facility had several areas requiring improvement.
New Jersey average: 18 deficiencies
State average 4
Last Health inspection on Feb 2025
State average 20.9
State average 5.35
Health citations are formal notices following inspections when they fail to comply with safety and care standards.
12 of 14 citations resulted from standard inspections; and 2 of 14 came from combined inspections (standard and complaint).
State average: 0.7
State average: 0.4
Data sourced from CMS Health Deficiencies reports. Citation severity codes range from A (least serious) to L (most serious). Immediate Jeopardy (J-L) citations indicate situations where the facility's noncompliance has placed residents at risk of death or serious harm.
Assisted Living A licensed, long-term care setting for seniors or individuals with disabilities who need help with daily activities — like bathing, dressing, and medication management — but not 24-hour skilled nursing. Offers housing, meals, and around-the-clock support while aiming to maximize resident independence.
Independent Living Lifestyle-focused communities for older adults offering dining, activities, and transportation with minimal personal care. Best for active, independent seniors who want community without medical support.
Memory Care Secured, specialized care for people living with Alzheimer's or dementia. Staff trained in cognitive impairment, with higher staff-to-resident ratios and an environment designed to reduce confusion and wandering risk.
Nursing Home Licensed facility providing 24/7 skilled nursing care for residents with complex, ongoing medical needs. Staffed by RNs, LPNs, and CNAs. Inspected and star-rated annually by CMS. Accepts Medicare (short-term rehab) and Medicaid (long-term care).
Nursing Home Licensed facility providing 24/7 skilled nursing care for residents with complex, ongoing medical needs. Staffed by RNs, LPNs, and CNAs. Inspected and star-rated annually by CMS. Accepts Medicare (short-term rehab) and Medicaid (long-term care).
Assisted Living A licensed, long-term care setting for seniors or individuals with disabilities who need help with daily activities — like bathing, dressing, and medication management — but not 24-hour skilled nursing. Offers housing, meals, and around-the-clock support while aiming to maximize resident independence.
Independent Living Lifestyle-focused communities for older adults offering dining, activities, and transportation with minimal personal care. Best for active, independent seniors who want community without medical support.
Memory Care Secured, specialized care for people living with Alzheimer's or dementia. Staff trained in cognitive impairment, with higher staff-to-resident ratios and an environment designed to reduce confusion and wandering risk.
Nursing Home Licensed facility providing 24/7 skilled nursing care for residents with complex, ongoing medical needs. Staffed by RNs, LPNs, and CNAs. Inspected and star-rated annually by CMS. Accepts Medicare (short-term rehab) and Medicaid (long-term care).
Assisted Living A licensed, long-term care setting for seniors or individuals with disabilities who need help with daily activities — like bathing, dressing, and medication management — but not 24-hour skilled nursing. Offers housing, meals, and around-the-clock support while aiming to maximize resident independence.
Home Care Professional care delivered in the person's own home — from companionship and errands to skilled nursing and therapy. Allows seniors to age in place. Medicare covers skilled home health when medically necessary.
Memory Care Secured, specialized care for people living with Alzheimer's or dementia. Staff trained in cognitive impairment, with higher staff-to-resident ratios and an environment designed to reduce confusion and wandering risk.
Assisted Living A licensed, long-term care setting for seniors or individuals with disabilities who need help with daily activities — like bathing, dressing, and medication management — but not 24-hour skilled nursing. Offers housing, meals, and around-the-clock support while aiming to maximize resident independence.
![]() 1.7 miles from city center — 5.99 miles to nearest hospital (Jefferson Cherry Hill Hospital)
1.7 miles from city center — 5.99 miles to nearest hospital (Jefferson Cherry Hill Hospital)
Add your location
This data corresponds to Q2 2025 and is based on CMS Payroll-Based Journal.
New Jersey average ratio: 1.77:1
New Jersey average: 8 hours
Manages medical care and health needs.
No contractors work on this role.
Assists with medical care and medications.
This role is partially covered by contractors.
Helps with daily care and mobility.
This role is partially covered by contractors.
Total hours from contractors
4,166 contractor hours this quarter
| Certified Nursing Assistant | 60 | 126 | 186 | 27,030 | 91 | 100% | 8.5 |
| Licensed Practical Nurse | 61 | 80 | 141 | 15,274 | 91 | 100% | 8.2 |
| Registered Nurse | 18 | 0 | 18 | 5,913 | 91 | 100% | 9.3 |
| Other Dietary Services Staff | 23 | 0 | 23 | 4,960 | 91 | 100% | 6.4 |
| Clinical Nurse Specialist | 6 | 0 | 6 | 1,923 | 88 | 97% | 8.9 |
| Respiratory Therapy Technician | 10 | 0 | 10 | 1,848 | 87 | 96% | 7.3 |
| Physical Therapy Assistant | 9 | 0 | 9 | 1,700 | 89 | 98% | 7.5 |
| Speech Language Pathologist | 3 | 0 | 3 | 1,426 | 82 | 90% | 7.3 |
| Mental Health Service Worker | 3 | 0 | 3 | 1,007 | 66 | 73% | 8 |
| Physical Therapy Aide | 3 | 0 | 3 | 915 | 78 | 86% | 7.6 |
| Qualified Social Worker | 4 | 0 | 4 | 468 | 65 | 71% | 7 |
| Qualified Activities Professional | 5 | 0 | 5 | 455 | 72 | 79% | 6.1 |
| Administrator | 1 | 0 | 1 | 448 | 56 | 62% | 8 |
| Nurse Practitioner | 1 | 0 | 1 | 448 | 56 | 62% | 8 |
| Dietitian | 1 | 0 | 1 | 432 | 54 | 59% | 8 |
| Occupational Therapy Aide | 0 | 2 | 2 | 285 | 46 | 51% | 5.7 |
| Occupational Therapy Assistant | 0 | 3 | 3 | 83 | 34 | 37% | 2.1 |
| Medical Director | 1 | 0 | 1 | 44 | 38 | 42% | 1.2 |
| Other Physician | 1 | 0 | 1 | 26 | 13 | 14% | 2 |
Source: CMS Long-Term Care Facility Characteristics (Data as of Jan 2026)
Residents meet regularly to discuss policies, care quality, and activities
Part of a Continuing Care Retirement Community offering multiple care levels
Organized group of residents that meets regularly to discuss facility policies, quality of life, and activities.
Data sourced from CMS Long-Term Care Facility Characteristics quarterly report. Payer mix reflects the current resident census by primary payment source.
These measures show how residents usually do over time at this home, based on health outcomes and preventive care.
New Jersey average: 6.8
New Jersey average: 12.4
New Jersey average: 10.1%
New Jersey average: 11.0%
New Jersey average: 16.0%
New Jersey average: 2.4%
New Jersey average: 6.1%
New Jersey average: 1.0%
New Jersey average: 4.6%
New Jersey average: 11.3%
New Jersey average: 11.1%
New Jersey average: 93.0%
New Jersey average: 97.2%
New Jersey average: 78.9%
New Jersey average: 1.2%
New Jersey average: 80.1%
Quality measures are calculated from Minimum Data Set (MDS) assessments. For most measures, lower percentages indicate better care quality.
Historical financial and operational data for Lions Gate based on CMS SNF Cost Reports.
Loading trend charts...
Care Cost Calculator: See Prices in Your Area
Nursing Home Data Explorer
Don’t Wait Too Long: 7 Red Flag Signs Your Parent Needs Assisted Living Now
The True Cost of Assisted Living in 2025 – And How Families Are Paying For It
Understanding Senior Living Costs: Pricing Models, Discounts & Financial Assistance

Touring a community? Use this expert-backed checklist to stay organized, ask the right questions, and find the perfect fit.
We'll send you a PDF version of the touring checklist.