Lone Tree Post Acute

Nursing Home
Overview of Lone Tree Post Acute

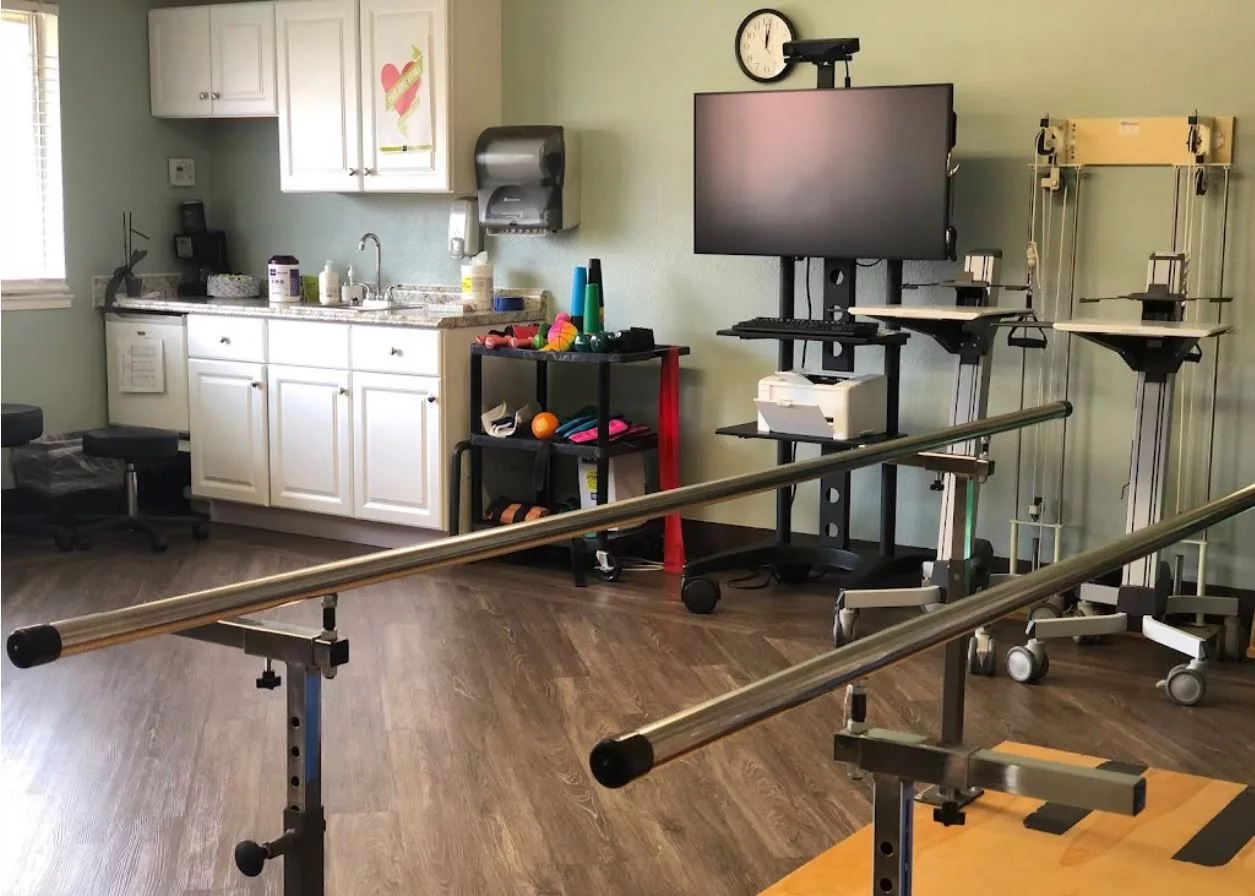
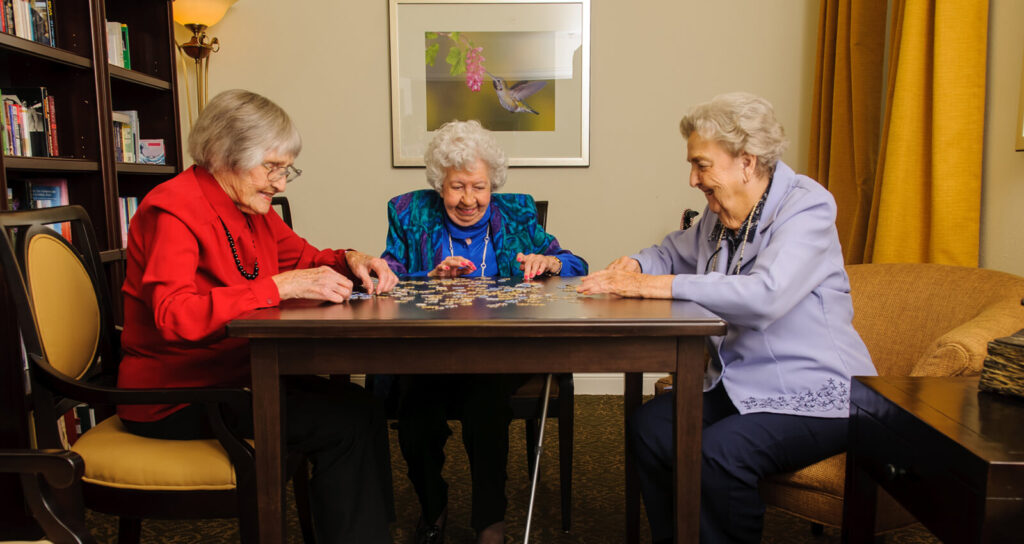
Lone Tree Post Acute is one of Antioch’s skilled nursing facilities offering skilled nursing and rehabilitative services to its residents and patients alike. They take pride in the quality of care they provide through their skilled nursing services, where their residents receive 24/7 care and supervision, medication management, incontinence care, as well as memory care for residents living with Alzheimer’s and other forms of dementia.

This skilled nursing facility also ensures that residents receive proper nutrition, providing dietician approved meals and oral supplements, as well as regular nutritional assessments. Other services they provide include wound and pain management, hospice and respite care, restorative nursing, IV Therapy, and laboratory testing and x-rays.

(925) 754-0470

Quality ratings

Measured by Centers for Medicare & Medicaid Services (CMS)

Overall rating Info Official CMS rating based on health inspections, staffing and quality measures.
5/5
California average: 3.1/5
Health Inspection Info Official CMS rating based on deficiencies found during state health inspections.
4/5
California average: 2.8/5
Staffing Info Official CMS rating based on nurse staffing hours per resident per day.
2/5
California average: 3.1/5
Quality Measures Info Official CMS rating based on clinical outcomes for residents.
5/5
California average: 4.1/5

Nursing care per resident

Info Average daily nursing hours per resident (adjusted for acuity). Higher values indicate more nursing time per resident.
3h 15m per day

This home provides 23% less nursing time per resident than the state average.

California average: 4h 13m per day

Staffing hours breakdown

Info Hours of care per resident per day, broken down by staff type. Data from CMS Medicare.
Staff type Facility State avg National avg
Registered Nurse (RN) Info Registered nurse hours per resident per day. 31m per day 39m per day 41m per day
LPN / LVN Info Licensed Practical Nurse / Licensed Vocational Nurse hours per resident per day. 1h 7m per day 1h 13m per day 52m per day
Nurse Aide Info Nurse aide hours per resident per day. 2h 23m per day 2h 39m per day 2h 21m per day
Total Nursing (Weekend) Info Total number of nurse staff hours per resident per day on weekends. 3h 36m per day 4h 5m per day 3h 26m per day
Physical Therapist Info Physical therapist staff hours per resident per day. 6m per day 5m per day 4m per day
RN (Weekend) Info Registered nurse hours per resident per day on weekends. 28m per day 30m per day 29m per day

Capacity and availability

Smaller home

May offer a more intimate, personalized care environment.

Total beds 99

This home usually has limited availability

Occupancy is moderate, suggesting balanced demand.

Similar demand to the California average
Occupancy rate 92.7%
Residents per day (avg) 96
Occupancy rate
92.7%
Residents per day (avg)
96

Who this home usually serves

TYPE OF STAY

Mix of rehab and long-term care

This home supports both short-term rehab and long-term care, with residents staying for a wide range of durations.

Breakdown by payment type

Medicare

46% of new residents, usually for short-term rehab.

Typical stay 1 - 2 months

Private pay

52% of new residents, often for short stays.

Typical stay 2 - 3 months

Medicaid

2% of new residents, often for long-term daily care.

Typical stay 8 - 9 months

Finances and operations

Proprietary home
Other
Home revenue
$22.7M
Profit
$5.6M
Proprietary home Other
Home revenue
$22,669,928.00
Profit
$5,589,750.00
Payroll costs Info The portion of the home's budget spent on staff, including nurses, caregivers, and other employees who support care and operations.
$7.5M
33% of revenue
Other operating costs Info All remaining costs needed to run the home, such as food, utilities, building maintenance, supplies and administrative expenses.
$9.6M
Total costs $17.1M
Walk Score
Walk Score: 53 / 100
Moderately walkable. Some errands can be accomplished on foot, with a mix of nearby amenities.

About this community

Additional licensing details

Awards: Best Nursing Homes – Long-Term Care award from U.S. News, 5-Star Overall and Quality Measures facility from CMS

Care Services

Nursing Services
Rehabilitation Services
Memory Care
Skilled Nursing
Licensed Nurses/CNAs

Programs & Activities

Specific Programs
Skilled Nursing, Rehabilitation, Wound Care, Activities, Social Services

Types of Care at Lone Tree Post Acute

Skilled Nursing
Contact Lone Tree Post Acute

Compare Nursing Homes around Antioch

The information below is reported by the California Department of Social Services and Department of Public Health.
Lone Tree Post Acute
AL

Assisted Living For seniors needing help with daily tasks but not full-time nursing.

SNF

Nursing Homes 24/7 care needed

Antioch
99
No
53
92.7%
$22,609,336.00
$7,490,989.00
33.1%
95.90
5/5
3.2448
4/5
2/5
5/5
1
24
2
-6%
-23%
+9%
Delta View Post Acute
AL

Assisted Living For seniors needing help with daily tasks but not full-time nursing.

MC

Memory Care Specialized care for those with Memory Loss, Alzheimer's, or dementia, ensuring safety and support.

SNF

Nursing Homes 24/7 care needed

Antioch
99
No
88
91.2%
$22,972,463.00
$6,520,099.00
28.4%
94.10
4/5
3.9033
3/5
3/5
5/5
-
39
1
+23%
-8%
+8%
Country Place Assisted Living
SNF

Nursing Home 24/7 care needed

AL

Assisted Living For seniors needing help with daily tasks but not full-time nursing.

CA 94509
49
No
-
-
-
-
-
-
-
-
-
-
-
-
-
-
-
-
-
Delta Shores Assisted Living
SNF

Nursing Home 24/7 care needed

AL

Assisted Living For seniors needing help with daily tasks but not full-time nursing.

CA 94509
90
No
-
-
-
-
-
-
-
-
-
-
-
-
-
-
-
-
-

Places of interest near Lone Tree Post Acute

Address 2.3 miles from city center — 0.15 miles to nearest hospital (Pharmacy, Sutter Delta Medical Center)
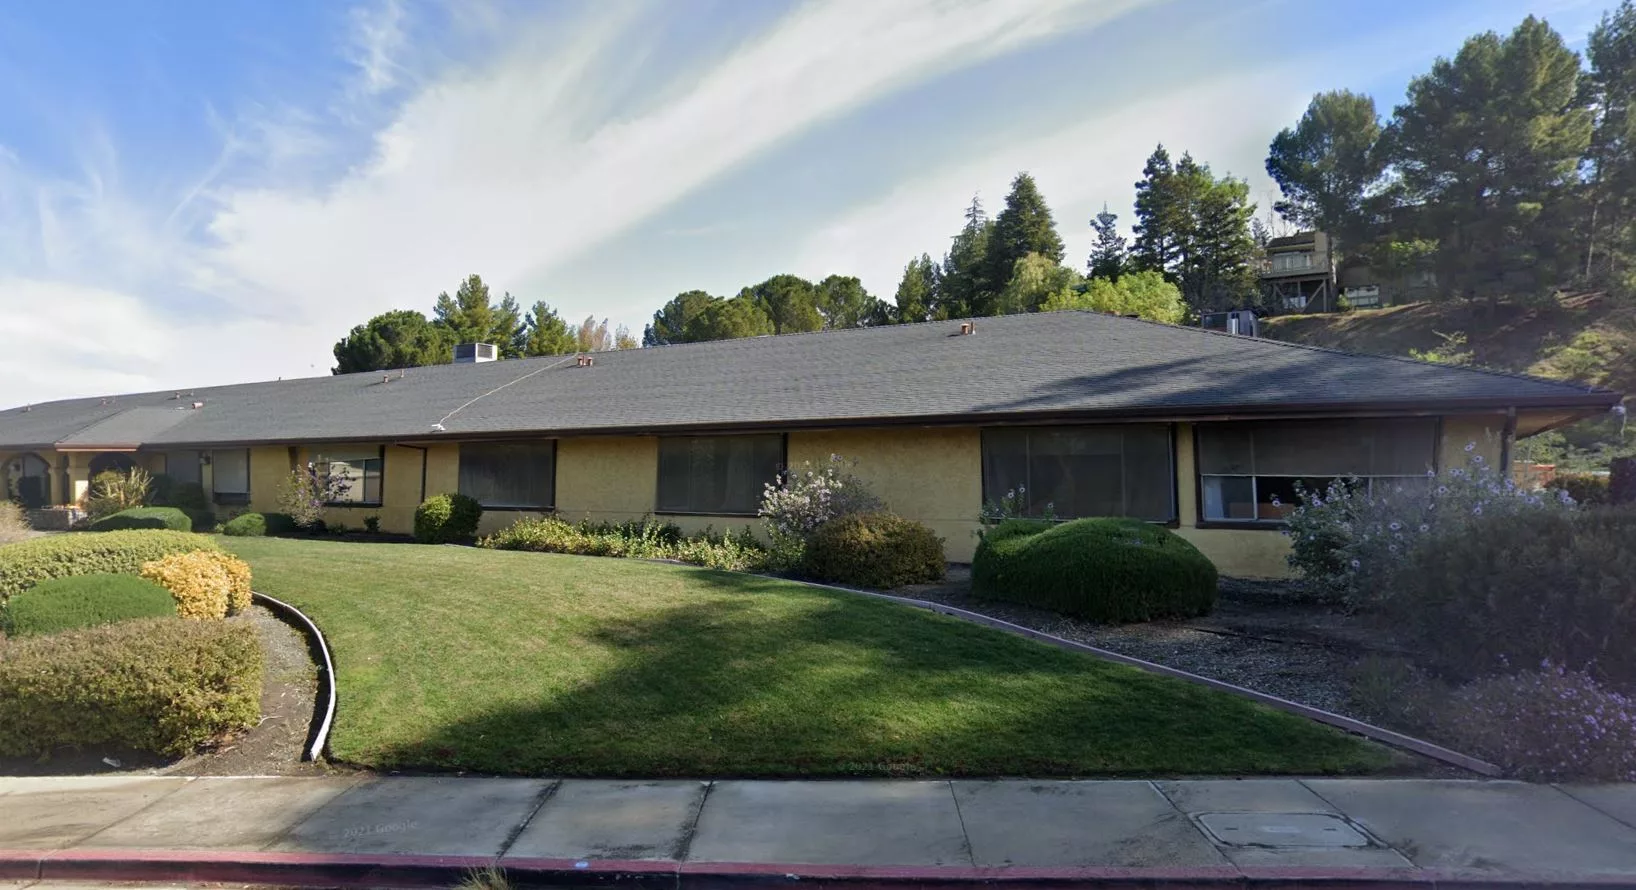
Address 4001 Lone Tree Wy, Antioch, CA 94509

Calculate Travel Distance to Lone Tree Post Acute

Add your location

Address

Staffing Data

Source: CMS Payroll-Based Journal (Q2 2025)

138
Total Staff
120
Employees
18
Contractors
43,180
Total Hours (Quarter)
62
Avg Staff/Day
7.7
Avg Shift (hrs)
Nursing Staff Breakdown
Role Count Avg Shift (hrs) Uses Contractors?
Registered Nurse118.2 No
Licensed Practical Nurse307.6 Yes
Certified Nursing Assistant667.8 Yes
Staff by Category
Administration
1 staff
4hs shift avg
Nursing Staff
110 staff
7.8hs shift avg
Physicians & Practitioners
1 staff
8hs shift avg
Therapy Services
16 staff
7hs shift avg
Activities & Recreation
0 staff
0hs shift avg
Social Services
3 staff
7hs shift avg
Dietary Services
5 staff
7.9hs shift avg
Other Services
2 staff
8hs shift avg
Contractor Analysis
1.3%
of total hours from contractors
544 contractor hours this quarter
Licensed Practical Nurse: 7 Certified Nursing Assistant: 11
Role Employees Contractors Total Staff Total Hours Days Worked % of Days Avg Shift (hrs)
Certified Nursing Assistant55116621,30891100%7.8
Licensed Practical Nurse237308,73691100%7.6
Registered Nurse110113,40191100%8.2
RN Director of Nursing3031,5366470%8
Other Dietary Services Staff4041,4318998%8.1
Speech Language Pathologist4041,1568189%7.6
Dental Services Staff2021,0036470%8
Physical Therapy Aide3039296875%7.8
Physical Therapy Assistant3037577380%6.1
Respiratory Therapy Technician4046597785%6
Occupational Therapy Aide2025506470%7.7
Nurse Practitioner1015126470%8
Qualified Social Worker3035086571%7
Dietitian1014396066%7.3
Administrator1012566470%4

Health Inspection History

Inspections
Total health inspections 4

California average 12.5


Last Health inspection on Apr 2025

Total health citations 24
Citations per inspection
6

Health citations are formal notices following inspections when they fail to comply with safety and care standards.

23 of 24 citations resulted from standard inspections; and 1 of 24 resulted from complaint investigations.

Breakdown of citation severity (last 3 years)
Critical Health citations More info 1
150% worse than California average

California average: 0.4


Serious Health citations More info 1
In line with California average

California average: 1

1 critical citation More info California average: 0.4

1 serious citation More info California average: 1

22 moderate citations More info California average: 47.2

0 minor citations More info California average: 1.5
Citations history (last 3 years)
Infection Control moderate citation Apr 10, 2025
Corrected

Nursing Services moderate citation Apr 10, 2025
Corrected

Nutrition moderate citation Apr 10, 2025
Corrected

Pharmacy moderate citation Apr 10, 2025
Corrected

Facility Characteristics

Source: CMS Long-Term Care Facility Characteristics (Data as of Jan 2026)

Ownership: For-Profit LLC
Part of: Contra Loma Healthcare, LLC
Resident Census by Payment Source
97 Total Residents
Medicare 33 (34%)
Medicaid 49 (50.5%)
Private Pay/Other 15 (15.5%)

Quality of care over time

These measures show how residents usually do over time at this home, based on health outcomes and preventive care.

High-risk clinical events score Info A composite score based on pressure ulcers, falls with injury, weight loss, walking ability decline, and activities of daily living decline. 3.9
41% better than California average

California average: 6.6

Functional decline score Info A composite score based on activities of daily living decline, walking ability decline, and incontinence. 10.3
10% better than California average

California average: 11.3

Long-stay resident measures
Need for Help with Daily Activities Increased Info Percent of long-stay residents whose need for help with daily activities has increased 8.3%
25% better than California average

California average: 11.1%

Walking Ability Worsened Info Percent of long-stay residents whose ability to move independently worsened 4.0%
66% better than California average

California average: 12.0%

Low Risk Residents with Bowel/Bladder Incontinence Info Percent of low risk long-stay residents who lose control of their bowels or bladder 18.4%
63% worse than California average

California average: 11.3%

Falls with Major Injury Info Percent of long-stay residents experiencing one or more falls with major injury 0.4%
74% better than California average

California average: 1.7%

High Risk Residents with Pressure Ulcers Info Percent of long-stay high risk residents with pressure ulcers 4.0%
19% better than California average

California average: 5.0%

Urinary Tract Infection Info Percent of long-stay residents with a urinary tract infection 0.9%
25% better than California average

California average: 1.2%

Lost Too Much Weight Info Percent of long-stay residents who lose too much weight 2.7%
37% better than California average

California average: 4.2%

Depressive Symptoms Info Percent of long-stay residents who have depressive symptoms 9.1%
36% worse than California average

California average: 6.7%

Antipsychotic Use Info Percent of long-stay residents who received an antipsychotic medication 0.5%
95% better than California average

California average: 10.1%

Pneumococcal Vaccine Info Percent of long-stay residents assessed and appropriately given the pneumococcal vaccine 100.0%
In line with California average

California average: 98.5%

Influenza Vaccine Info Percent of long-stay residents assessed and appropriately given the seasonal influenza vaccine 98.3%
In line with California average

California average: 98.2%

Hospitalizations per 1,000 days Info Number of hospitalizations per 1,000 long-stay resident days. 2.54
13% worse than California average

California average: 2.25

ED visits per 1,000 days Info Number of outpatient emergency department visits per 1,000 long-stay resident days. 1.73
9% worse than California average

California average: 1.59

Short-stay resident measures
Pneumococcal Vaccine Info Percent of short-stay residents assessed and appropriately given the pneumococcal vaccine 98.9%
5% better than California average

California average: 94.0%

Antipsychotic medication increase Info Percent of short-stay residents who newly received an antipsychotic medication 0.2%
89% better than California average

California average: 1.5%

Influenza Vaccine Info Percent of short-stay residents assessed and appropriately given the seasonal influenza vaccine 95.8%
In line with California average

California average: 93.2%

Re-hospitalized after SNF stay Info Percentage of short-stay residents who were re-hospitalized after their nursing home admission. 15.8%
32% better than California average

California average: 23.2%

Emergency department visits Info Percentage of short-stay residents who had an outpatient emergency department visit. 12.6%
13% worse than California average

California average: 11.2%

Falls with major injury Info Percentage of SNF residents who experience falls with major injury during their stay. 0.0%
100% better than California average

California average: 0.8%

Ability to care for self at discharge Info Percentage of residents at or above expected ability to care for themselves at discharge. 56.0%
In line with California average

California average: 53.7%

Successful return to home or community Info Rate of successful return to home or community from a skilled nursing facility. 61.1%
21% better than California average

California average: 50.6%

Penalties and fines

Federal penalties imposed by CMS for regulatory violations, including civil money penalties (fines) and denials of payment for new Medicare/Medicaid admissions.

Source: CMS Penalties Database (Data as of Jan 2026)

Total fines amount $47K
14% lower than California average

California average: $55K

Number of fines 1
58% fewer fines than California average

California average: 2.4

Payment Denials Info Serious action where Medicare and/or Medicaid temporarily stops payments for new residents until issues are fixed. 0
100% fewer payment denials than California average

California average: 0.5

Fines amount comparison
This facility $47K
California average $55K
Penalty History

Penalties are imposed by CMS for violations of federal nursing home regulations.

Civil Money Penalty Info Fines imposed for noncompliance, which can be assessed per day or per instance of violation. May 22, 2023
$47K

Last updated: Jan 2026

Guides for Better Senior Living

Care Cost Calculator: See Prices in Your Area

Nursing Home Data Explorer

Don’t Wait Too Long: 7 Red Flag Signs Your Parent Needs Assisted Living Now

The True Cost of Assisted Living in 2025 – And How Families Are Paying For It

Understanding Senior Living Costs: Pricing Models, Discounts & Financial Assistance

Financial Aid for California Seniors

Get financial aid guidance

Multipurpose Senior Services Program

MSSP (Medi-Cal Waiver)

Age 65+, California resident, Medi-Cal eligible, nursing home risk.

~$2,829/month (300% FBR, individual).

$2,000 (individual), $3,000 (couple).

County-managed; waitlists possible.

In-Home Supportive Services (IHSS)

California IHSS

Age 65+, California resident, Medicaid-eligible or low-income.

~$1,732/month (individual, Medi-Cal threshold).

$2,000 (individual).

Can hire family as caregivers.

Multipurpose Senior Services Program (MSSP)

CA MSSP

Age 65+, California resident, Medi-Cal-eligible, nursing home-eligible but community-capable.

~$2,829/month (300% FBR, individual).

$2,000 (individual).

Available in 38 counties; waitlists common.

Property Tax Postponement Program (PTP)

CA PTP

Age 62+, California resident, own and live in home, 40% equity.

~$51,500/year (household, adjusted annually).

Equity-based; no strict asset cap.

Deferred taxes accrue interest (5% as of 2024); repaid upon sale/death.

Assisted Living Waiver (ALW)

CA ALW

Age 65+ or disabled, California resident, Medi-Cal-eligible, nursing home-eligible.

~$2,829/month (300% FBR, individual).

$2,000 (individual).

Available in 15 counties (e.g., LA, Sacramento); waitlists common.

California CARES Program

CA CARES

Caregivers of California residents 60+ needing help with 3+ daily activities; no caregiver age limit.

No strict limit; cost-sharing above ~$2,500/month threshold.

Not applicable; need-based.

High demand in urban areas; complements IHSS respite.

Low-Income Home Energy Assistance Program (LIHEAP)

CA LIHEAP

Age 60+ priority, California resident, low-income, utility/heating need.

~$2,510/month (200% of poverty level, individual).

Not applicable; income-focused.

High demand in inland/coastal extremes; weatherization capped at $5,000/home.

Who we are

Your Senior Care Partner, Every Step of the Way

We help families find affordable senior communities and unlock same day discounts, Medicaid, and Medicare options tailored to your needs.

Contact us Today
Tour Icon
Planning a tour? Check our touring checklist.
Chat Icon
Thinking of living here? We can help you speak to a current resident