


Total staff
120
Employees
119
Contractors
1
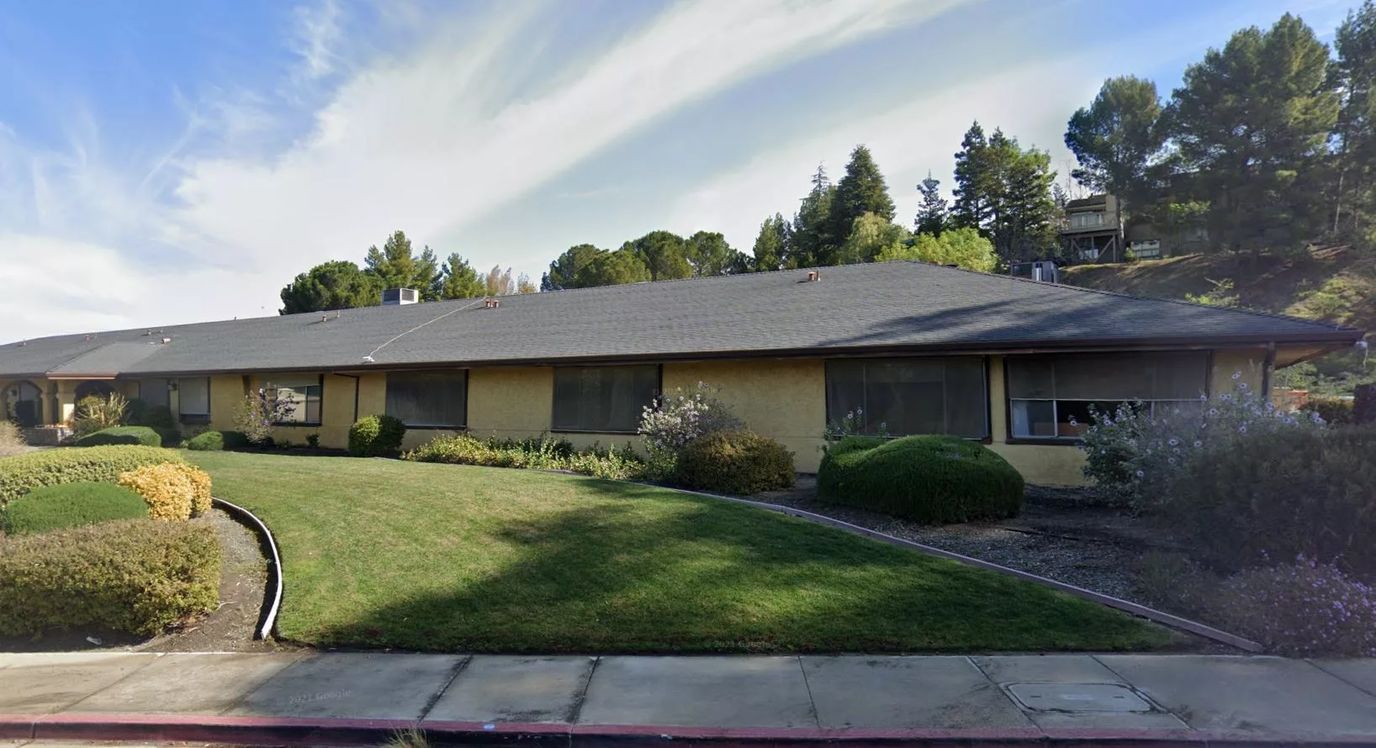
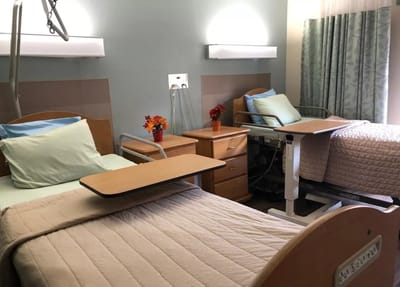
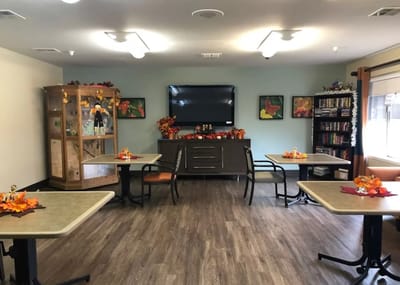
Lone Tree Post Acute is one of Antioch’s skilled nursing facilities offering skilled nursing and rehabilitative services to its residents and patients alike. They take pride in the quality of care they provide through their skilled nursing services, where their residents receive 24/7 care and supervision, medication management, incontinence care, as well as memory care for residents living with Alzheimer’s and other forms of dementia.
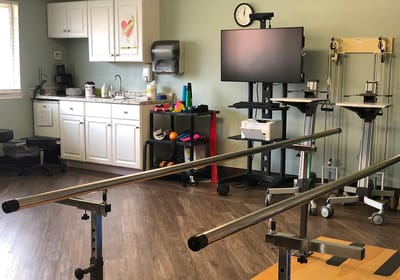
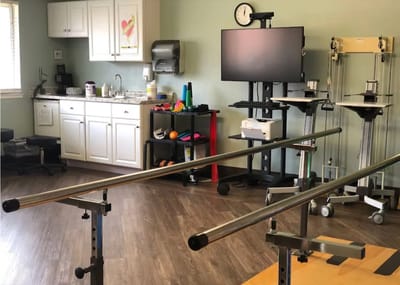
This skilled nursing facility also ensures that residents receive proper nutrition, providing dietician approved meals and oral supplements, as well as regular nutritional assessments. Other services they provide include wound and pain management, hospice and respite care, restorative nursing, IV Therapy, and laboratory testing and x-rays.
| Staff type | Hours / Day / Resident | vs state avg |
|---|---|---|
|
Registered Nurse (RN)
| 34m per day | ▼ 14% State avg: 39m per day · National avg: 41m per day |
|
LPN / LVN
| 1h 2m per day | ▼ 15% State avg: 1h 13m per day · National avg: 52m per day |
|
Nurse Aide
| 2h 21m per day | ▼ 11% State avg: 2h 39m per day · National avg: 2h 21m per day |
|
Weekend Total Nursing
| 3h 34m per day | ▼ 13% State avg: 4h 5m per day · National avg: 3h 26m per day |
|
Physical Therapist
| 5m per day | ▲ 5% State avg: 5m per day · National avg: 4m per day |
|
Weekend RN
| 25m per day | ▼ 16% State avg: 30m per day · National avg: 29m per day |
Reporting period: October 1 – December 31, 2025 (Q4 2025). Source: CMS Payroll-Based Journal report.
Manages medical care and health needs.
Assists with medical care and medications.
Helps with daily care and mobility.
| Certified Nursing Assistant | 55 | 0 | 55 | 20,575 | 92 | 100% | 8.2 |
| Licensed Practical Nurse | 20 | 0 | 20 | 8,098 | 92 | 100% | 7.9 |
| Registered Nurse | 10 | 0 | 10 | 3,873 | 92 | 100% | 7.9 |
| Speech Language Pathologist | 5 | 0 | 5 | 1,580 | 83 | 90% | 7.6 |
| Other Dietary Services Staff | 4 | 0 | 4 | 1,250 | 85 | 92% | 7.4 |
| RN Director of Nursing | 2 | 0 | 2 | 960 | 64 | 70% | 8 |
| Physical Therapy Assistant | 3 | 0 | 3 | 903 | 75 | 82% | 6 |
| Dental Services Staff | 2 | 0 | 2 | 817 | 64 | 70% | 7.6 |
| Respiratory Therapy Technician | 5 | 0 | 5 | 768 | 79 | 86% | 5.9 |
| Occupational Therapy Aide | 2 | 0 | 2 | 520 | 64 | 70% | 8 |
| Nurse Practitioner | 1 | 0 | 1 | 512 | 64 | 70% | 8 |
| Clinical Nurse Specialist | 1 | 0 | 1 | 512 | 64 | 70% | 8 |
| Dietitian | 1 | 0 | 1 | 455 | 63 | 68% | 7.2 |
| Qualified Social Worker | 2 | 0 | 2 | 427 | 55 | 60% | 7.4 |
| Physical Therapy Aide | 5 | 0 | 5 | 362 | 46 | 50% | 5.2 |
| Administrator | 1 | 0 | 1 | 256 | 64 | 70% | 4 |
| Medical Director | 0 | 1 | 1 | 10 | 4 | 4% | 2.5 |
Federal penalties imposed by CMS for regulatory violations, including civil money penalties (fines) and denials of payment for new Medicare/Medicaid admissions.
Source: CMS Penalties Database (Data as of Jan 2026)
California average: $55K
California average: 2.4
California average: 0.5
No penalties in the past 3 years
No civil money penalties or payment denials were reported in the last 3 years.
These measures show how residents usually do over time at this home, based on health outcomes and preventive care.
California average: 6.6
California average: 11.3
California average: 11.1%
California average: 12.0%
California average: 11.3%
California average: 1.7%
California average: 5.0%
California average: 1.2%
California average: 4.2%
California average: 6.7%
California average: 10.1%
California average: 98.5%
California average: 98.2%
California average: 2.25
California average: 1.59
California average: 94.0%
California average: 1.5%
California average: 93.2%
California average: 23.2%
California average: 11.2%
California average: 0.8%
California average: 53.7%
California average: 50.6%
Quality measures are calculated from Minimum Data Set (MDS) assessments. For most measures, lower percentages indicate better care quality.
46% of new residents, usually for short-term rehab.
52% of new residents, often for short stays.
2% of new residents, often for long-term daily care.
Source: CMS Long-Term Care Facility Characteristics (Data as of Jan 2026)
Data sourced from CMS Long-Term Care Facility Characteristics quarterly report. Payer mix reflects the current resident census by primary payment source.
Historical financial and operational data for Lone Tree Post Acute from 2012–2023, based on CMS SNF Cost Reports.
Key figures below are for fiscal year ending in 12/2023.
Based on CMS SNF Cost Report for fiscal year ending in 12/2023.
This home supports both short-term rehab and long-term care, with residents staying for a wide range of durations.
Most new residents arrive under private pay (52% of admissions), and a typical private pay stay runs around 2 - 3 months.
Coverage residents most often arrive under.
Coverage residents most often leave under.
![]() 2.3 miles from city center
2.3 miles from city center
![]() Estimated distance in miles from Antioch's city center to Lone Tree Post Acute's address, calculated via Google Maps.
— 0.17 miles to nearest hospital (Sutter Delta Medical Center)
Estimated distance in miles from Antioch's city center to Lone Tree Post Acute's address, calculated via Google Maps.
— 0.17 miles to nearest hospital (Sutter Delta Medical Center)
Add your location
The information below is reported by the California Department of Social Services and Department of Public Health.
| Lone Tree Post Acute | NH MC SNF | Antioch | 99
Facility
99
CA AVG
104
Rank
#724 / 1644 |
96.2%
Facility
96.2%
CA AVG
73.9
Rank
#187 / 1492 | +30% | 3.24
Facility
3.24
CA AVG
4.22
Rank
#309 / 327 | -7% | -23% | $46.9k
Facility
$46.9k
CA AVG
$56.5k
Rank
#284 / 334 | - | 24
Facility
24
CA AVG
50.2
Rank
#65 / 327 | 6.0
Facility
6.0
CA AVG
4.6
Rank
#272 / 327 | 2 | 95 | - |
53
Facility
53
CA AVG
57
Rank
#1277 / 2087 | - | $23.4MFiscal year ending 12/2023
Facility
$23.4MFiscal year ending 12/2023
CA AVG
$17.0M
Rank
#103 / 327 | $8.7MFiscal year ending 12/2023
Facility
$8.7MFiscal year ending 12/2023
CA AVG
$7.0M
Rank
#134 / 327 | 37%Fiscal year ending 12/2023
Facility
37%Fiscal year ending 12/2023
CA AVG
45.2%
Rank
#256 / 327 | 56021 | ||||
| Delta View Post Acute | NH SNF | Antioch | 99
Facility
99
CA AVG
104
Rank
#724 / 1644 |
96.7%
Facility
96.7%
CA AVG
73.9
Rank
#172 / 1492 | +31% | 3.90
Facility
3.90
CA AVG
4.22
Rank
#195 / 327 | +16% | -8% | $0
Facility
$0
CA AVG
$56.5k
Rank
#1 / 334 | - | 39
Facility
39
CA AVG
50.2
Rank
#150 / 327 | 6.5
Facility
6.5
CA AVG
4.6
Rank
#288 / 327 | 1 | 96 | - |
88
Facility
88
CA AVG
57
Rank
#218 / 2087 | - | $17.7MFiscal year ending 12/2023
Facility
$17.7MFiscal year ending 12/2023
CA AVG
$17.0M
Rank
#99 / 327 | $7.8MFiscal year ending 12/2023
Facility
$7.8MFiscal year ending 12/2023
CA AVG
$7.0M
Rank
#156 / 327 | 44%Fiscal year ending 12/2023
Facility
44%Fiscal year ending 12/2023
CA AVG
45.2%
Rank
#278 / 327 | 56381 |
Lone Tree Post Acute is located in Antioch, California.
Here are the financial assistance programs available to residents in California.
Lone Tree Post Acute has a walk score of 53. Moderately walkable. Some errands can be accomplished on foot, with a mix of nearby amenities.
Lone Tree Post Acute's occupancy is 92.7%.
No, Lone Tree Post Acute has a no-pet policy.
Lone Tree Post Acute is registered as a for-profit.
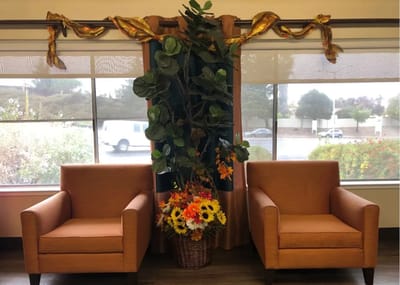
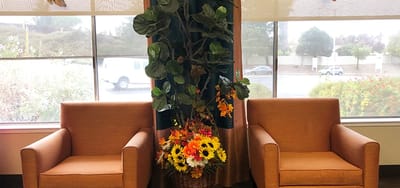
Yes — there are 7 photos of Lone Tree Post Acute in the photo gallery on this page.
Lone Tree Post Acute is located at 4001 Lone Tree Wy, Antioch, CA 94509.
(925) 754-0470 will put you in contact with the team at Lone Tree Post Acute.
Care Cost Calculator: See Prices in Your Area
Nursing Home Data Explorer
Don’t Wait Too Long: 7 Red Flag Signs Your Parent Needs Assisted Living Now
The True Cost of Assisted Living in 2025 – And How Families Are Paying For It
Understanding Senior Living Costs: Pricing Models, Discounts & Financial Assistance


