Occupancy rate
77%
California average: 73%

We arrange tours, appointments, and even moving support so you don’t have to
Thank you for your interest!
Our team will be in touch shortly to help with next steps.

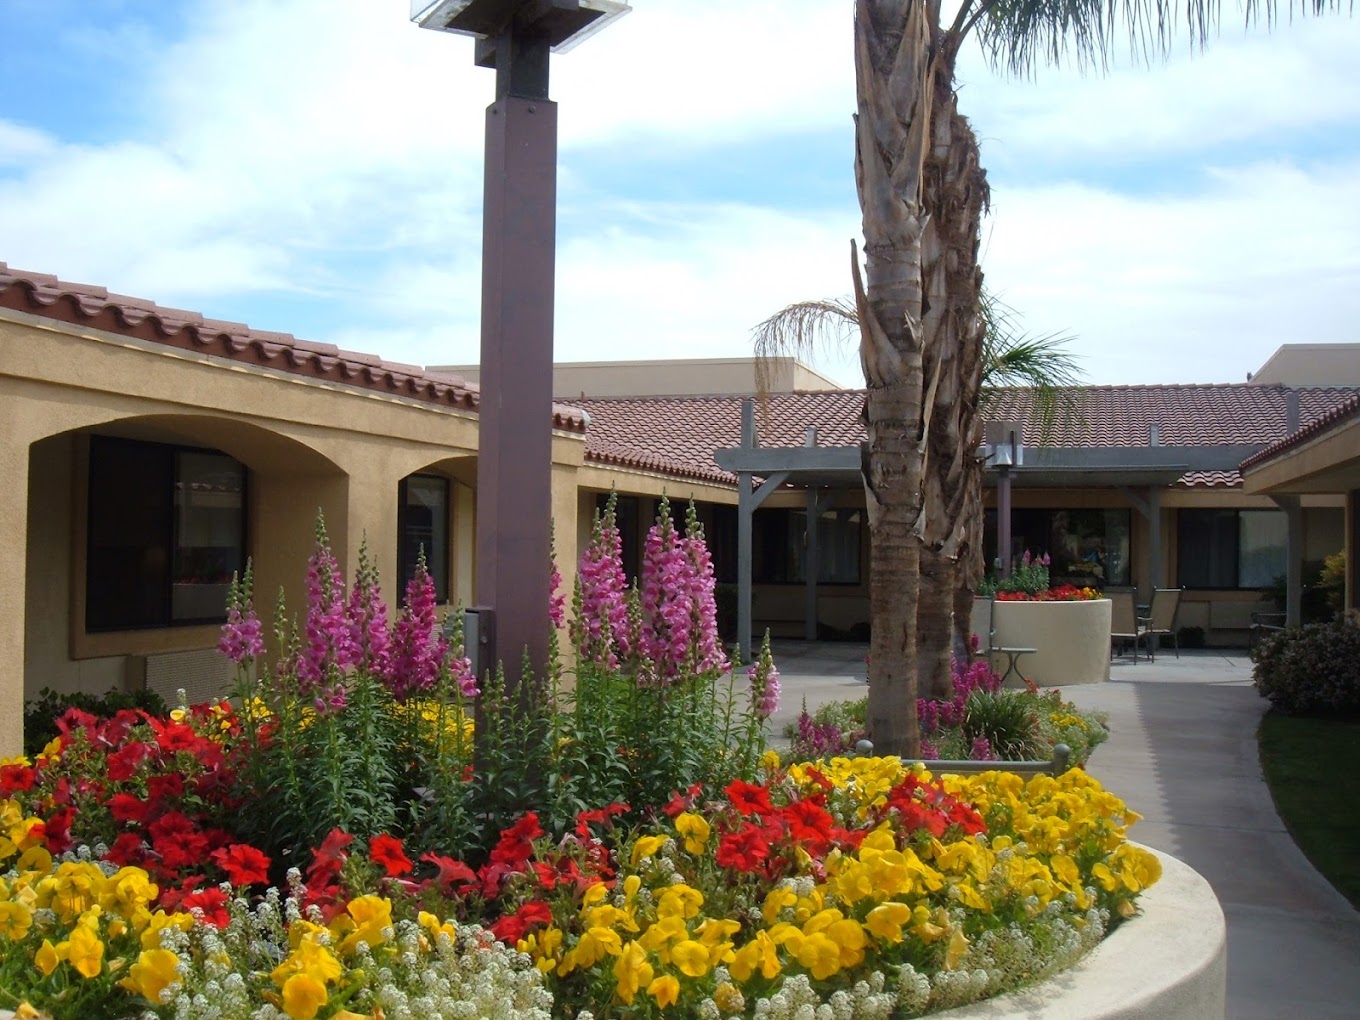
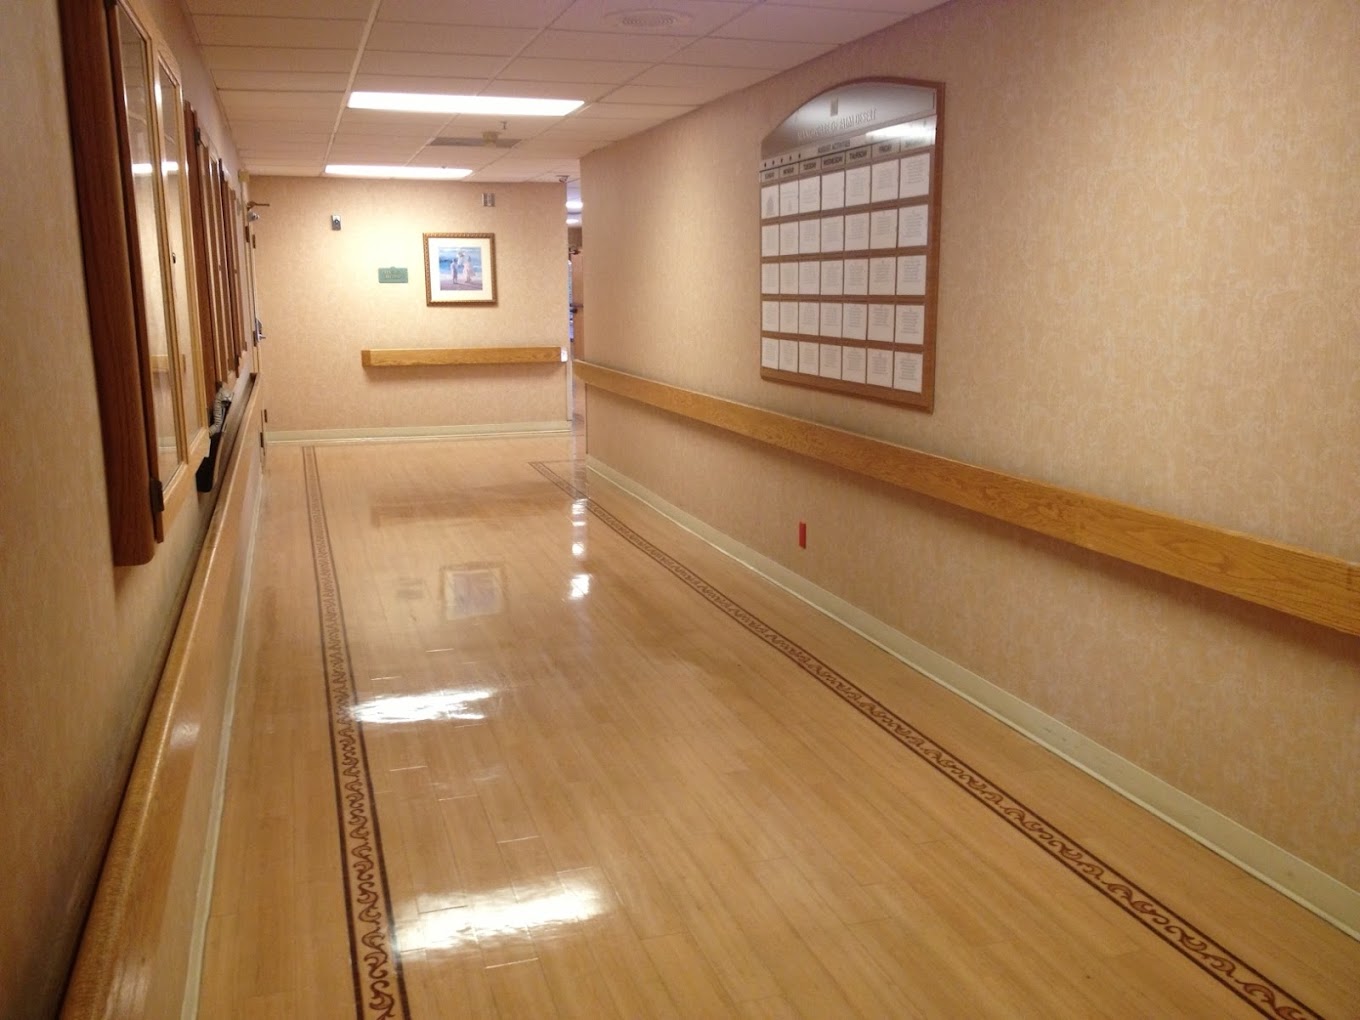
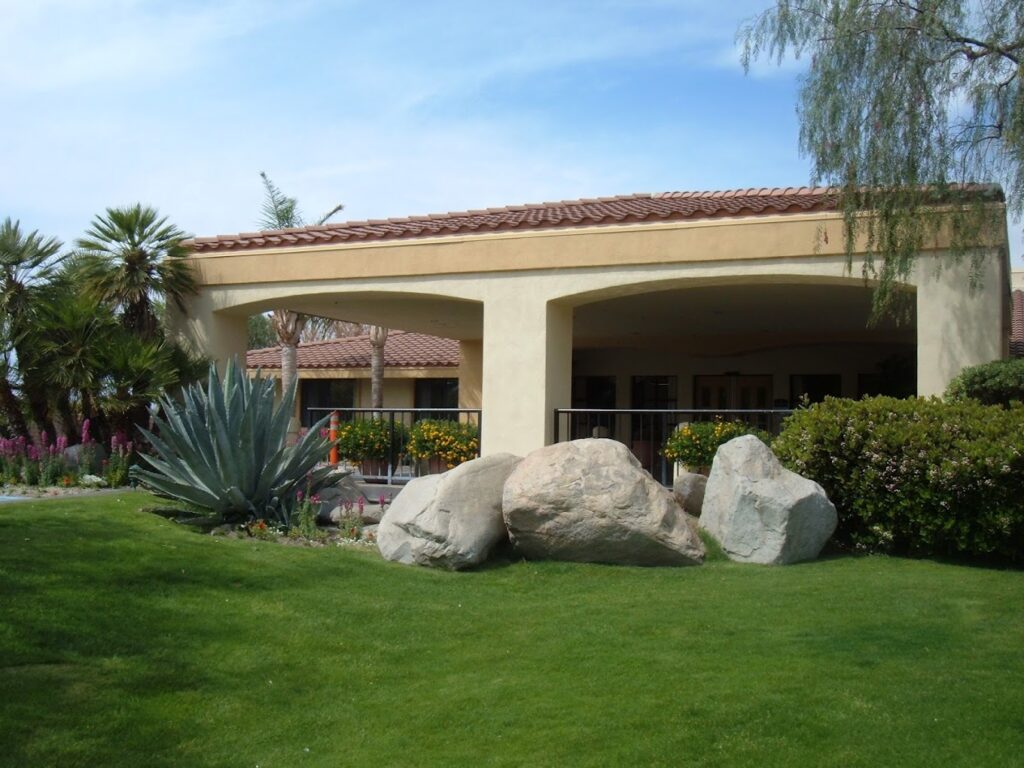
Manorcare Health Services-palm Desert, situated in the peaceful city of Palm Desert, CA, blends lively living with exceptional care. Offering independent living, skilled nursing, respite care, and rehabilitation, this community is dedicated to improving residents’ quality of life with compassionate, individualized support. The team conducts thorough assessments to tailor care to each resident’s specific needs, fostering a warm and supportive environment. Residents can choose from well-designed, comfortable apartments that provide both relaxation and personal space.
The community features top-tier amenities such as fitness centers and stretching classes to encourage wellness and an active lifestyle. Thoughtfully arranged social areas and engaging activities ensure that every day is filled with meaningful experiences and happiness. Every aspect of Manorcare Health Services-palm Desert is designed to inspire, uplift, and celebrate the joy of life.
Offers a balance of services and community atmosphere.
Lower occupancy suggests more openings may be available.
Residents typically stay for brief periods, with frequent admissions and discharges throughout the year.
13% of new residents, usually for short-term rehab.
78% of new residents, often for short stays.
9% of new residents, often for long-term daily care.
California average: 73%
ManorCare Health Services-Palm Desert is legally operated by Blc Mirage Inn Lp.
Accept Medicaid: Yes, Accept
Total Residents: 178 Residents
Pets Allowed: Yes, Pets Allowed
Housing Options: Private / Semi-Private Rooms
Building Type: Single-story
Fitness and Recreation
In California, the Department of Social Services (for assisted living facilities) and the Department of Public Health (for nursing homes) conduct inspections to ensure resident safety and regulatory compliance.
California average: 16 visits
6 total complaint visits
2 other visits
![]() Other visits include regulatory visits that are not routine inspections or complaint investigations, such as administrative check-ins, follow-up reviews, or licensing-related visits.
Other visits include regulatory visits that are not routine inspections or complaint investigations, such as administrative check-ins, follow-up reviews, or licensing-related visits.
13 total complaint visits
7 other visits
Investigations can have many visits.
California average: 10 complaint investigations
California average: 4 official inspections
A violation that poses an immediate risk to resident health or safety, or represents a substantial failure to comply with licensing requirements.
California average: 3 serious citations
A violation that does not pose an immediate risk to resident health or safety but requires correction to remain in compliance.
California average: 4 moderate citations
Most inspections found no deficiencies, including the most recent annual inspection on August 30, 2024, which was fully compliant with all regulations. Several complaint investigations over the past few years alleged issues such as staff misconduct, pressure injuries, and response times, but all were unsubstantiated after thorough reviews. The facility consistently met infection control standards and maintained a safe, clean environment. No fines, enforcement actions, or severe deficiencies were reported in any of the available inspections. This record suggests stable compliance with regulatory requirements and no emerging patterns of concern.
California average 12.5
Last Health inspection on Aug 2025
California average 50.2
California average 4.65
Health citations are formal notices following inspections when they fail to comply with safety and care standards.
62 of 121 citations resulted from standard inspections; 57 of 121 resulted from complaint investigations; and 2 of 121 came from combined inspections (standard and complaint).
California average: 0.4
California average: 1
Data sourced from CMS Health Deficiencies reports. Citation severity codes range from A (least serious) to L (most serious). Immediate Jeopardy (J-L) citations indicate situations where the facility's noncompliance has placed residents at risk of death or serious harm.
Nursing Home Licensed facility providing 24/7 skilled nursing care for residents with complex, ongoing medical needs. Staffed by RNs, LPNs, and CNAs. Inspected and star-rated annually by CMS. Accepts Medicare (short-term rehab) and Medicaid (long-term care).
Assisted Living A licensed, long-term care setting for seniors or individuals with disabilities who need help with daily activities — like bathing, dressing, and medication management — but not 24-hour skilled nursing. Offers housing, meals, and around-the-clock support while aiming to maximize resident independence.
Assisted Living A licensed, long-term care setting for seniors or individuals with disabilities who need help with daily activities — like bathing, dressing, and medication management — but not 24-hour skilled nursing. Offers housing, meals, and around-the-clock support while aiming to maximize resident independence.
Independent Living Lifestyle-focused communities for older adults offering dining, activities, and transportation with minimal personal care. Best for active, independent seniors who want community without medical support.
Memory Care Secured, specialized care for people living with Alzheimer's or dementia. Staff trained in cognitive impairment, with higher staff-to-resident ratios and an environment designed to reduce confusion and wandering risk.
Nursing Home Licensed facility providing 24/7 skilled nursing care for residents with complex, ongoing medical needs. Staffed by RNs, LPNs, and CNAs. Inspected and star-rated annually by CMS. Accepts Medicare (short-term rehab) and Medicaid (long-term care).
![]() 3.2 miles from city center
3.2 miles from city center
![]() 74-350 Country Club Dr, Palm Desert, CA 92260
74-350 Country Club Dr, Palm Desert, CA 92260
Add your location
This data corresponds to Q2 2025 and is based on CMS Payroll-Based Journal.
California average ratio: 0.00:1
California average: 7.7 hours
Manages medical care and health needs.
This role is partially covered by contractors.
Assists with medical care and medications.
This role is partially covered by contractors.
Helps with daily care and mobility.
This role is partially covered by contractors.
Total hours from contractors
2,977 contractor hours this quarter
| Certified Nursing Assistant | 107 | 126 | 233 | 36,196 | 91 | 100% | 8.2 |
| Licensed Practical Nurse | 64 | 26 | 90 | 21,849 | 91 | 100% | 8.1 |
| Registered Nurse | 9 | 3 | 12 | 3,023 | 91 | 100% | 7.9 |
| Physical Therapy Aide | 5 | 0 | 5 | 1,909 | 89 | 98% | 7.3 |
| Speech Language Pathologist | 4 | 0 | 4 | 1,792 | 86 | 95% | 7.8 |
| RN Director of Nursing | 3 | 0 | 3 | 1,656 | 70 | 77% | 8.4 |
| Other Dietary Services Staff | 4 | 0 | 4 | 1,636 | 91 | 100% | 7.3 |
| Physical Therapy Assistant | 3 | 0 | 3 | 1,165 | 79 | 87% | 8 |
| Dental Services Staff | 3 | 0 | 3 | 1,040 | 64 | 70% | 8.1 |
| Qualified Social Worker | 3 | 0 | 3 | 874 | 65 | 71% | 7.7 |
| Respiratory Therapy Technician | 4 | 0 | 4 | 873 | 73 | 80% | 7.4 |
| Qualified Activities Professional | 1 | 0 | 1 | 537 | 69 | 76% | 7.8 |
| Administrator | 1 | 0 | 1 | 512 | 64 | 70% | 8 |
| Dietitian | 1 | 0 | 1 | 483 | 64 | 70% | 7.5 |
| Nurse Practitioner | 1 | 0 | 1 | 464 | 58 | 64% | 8 |
| Clinical Nurse Specialist | 1 | 0 | 1 | 281 | 49 | 54% | 5.7 |
Source: CMS Long-Term Care Facility Characteristics (Data as of Jan 2026)
Residents meet regularly to discuss policies, care quality, and activities
Organized group of residents that meets regularly to discuss facility policies, quality of life, and activities.
Data sourced from CMS Long-Term Care Facility Characteristics quarterly report. Payer mix reflects the current resident census by primary payment source.
These measures show how residents usually do over time at this home, based on health outcomes and preventive care.
California average: 6.6
California average: 11.3
California average: 11.1%
California average: 12.0%
California average: 11.3%
California average: 1.7%
California average: 5.0%
California average: 1.2%
California average: 4.2%
California average: 6.7%
California average: 10.1%
California average: 98.5%
California average: 98.2%
California average: 94.0%
California average: 1.5%
California average: 93.2%
Quality measures are calculated from Minimum Data Set (MDS) assessments. For most measures, lower percentages indicate better care quality.
Federal penalties imposed by CMS for regulatory violations, including civil money penalties (fines) and denials of payment for new Medicare/Medicaid admissions.
Source: CMS Penalties Database (Data as of Jan 2026)
California average: $55K
California average: 2.4
California average: 0.5
Penalties are imposed by CMS for violations of federal nursing home regulations.
Last updated: Jan 2026
Historical financial and operational data for ManorCare Health Services-Palm Desert based on CMS SNF Cost Reports.
Loading trend charts...
Care Cost Calculator: See Prices in Your Area
Nursing Home Data Explorer
Don’t Wait Too Long: 7 Red Flag Signs Your Parent Needs Assisted Living Now
The True Cost of Assisted Living in 2025 – And How Families Are Paying For It
Understanding Senior Living Costs: Pricing Models, Discounts & Financial Assistance

Touring a community? Use this expert-backed checklist to stay organized, ask the right questions, and find the perfect fit.
We'll send you a PDF version of the touring checklist.