

Total health inspections
3
Utah average 3.5
Last Health inspection on Nov 2023

We arrange tours, appointments, and even moving support so you don’t have to
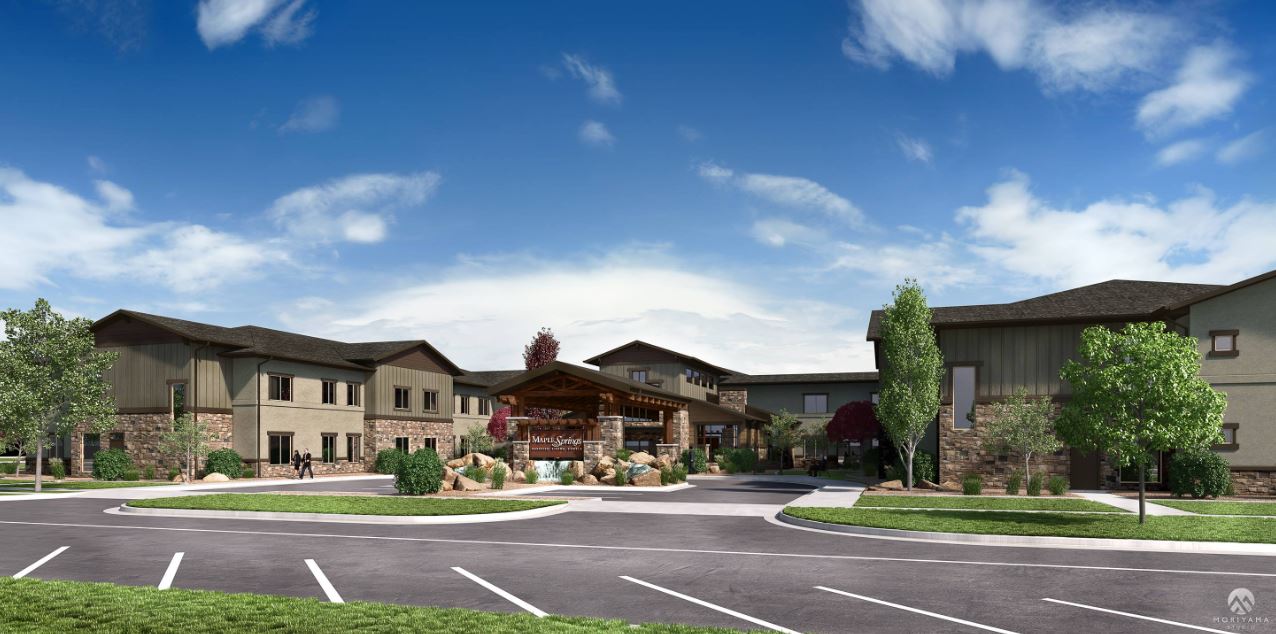
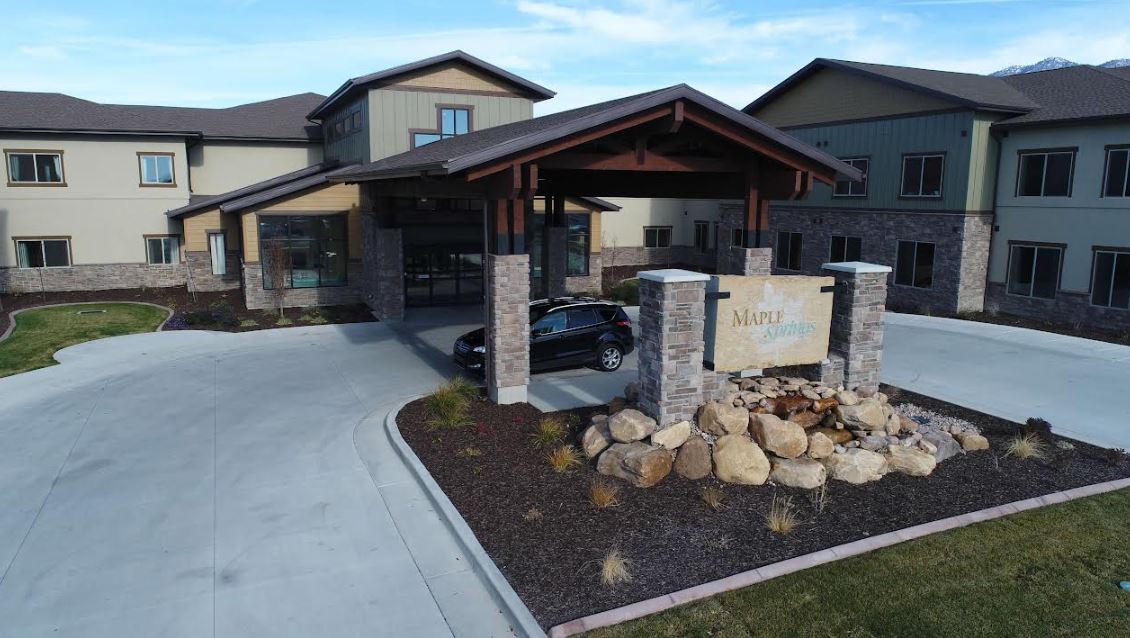

Tucked in the tranquil neighborhood of North Logan, UT, Maple Springs of North Logan is dedicated to improving seniors’ well-being with assisted living, memory care, skilled nursing, and rehabilitation services. Seniors and families can keep their peace of mind with a team of responsive and highly trained professionals caring for their needs and aspirations 24/7. Moreover, the community promotes a bright and welcoming environment for seniors to flourish and live their lives to the fullest.
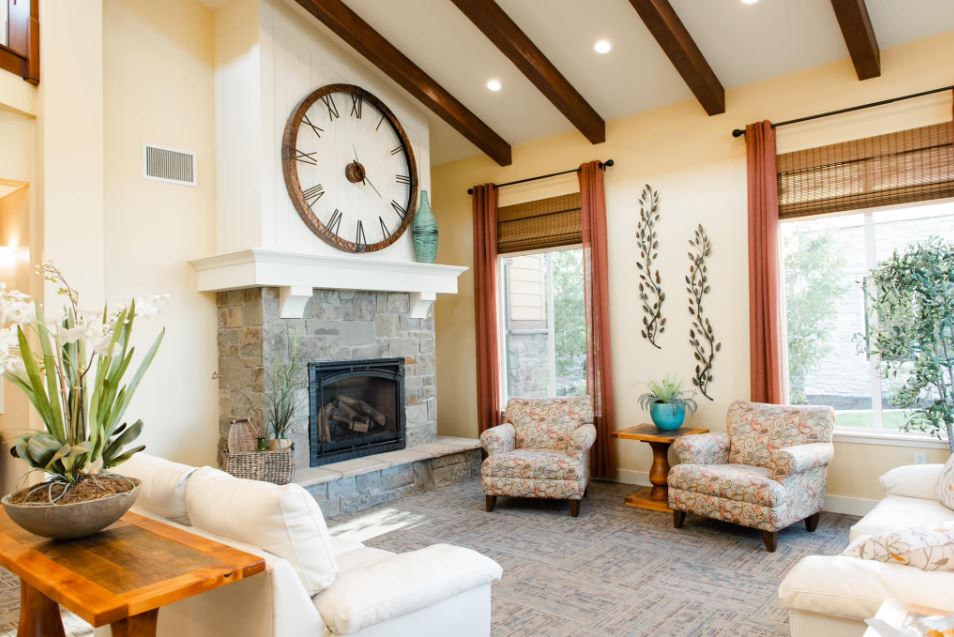
Residents do not run out of things to do with a lot of enriching activities and engaging programs that aim to keep them happy and socially connected. Here, delectable and healthy meals are served to satisfy nutritional needs and tastes. Amenities include a movie theater, onsite salon services, a library, and an ice cream parlor.
 Official CMS rating based on health inspections, staffing and quality measures.
Official CMS rating based on deficiencies found during state health inspections.
Official CMS rating based on nurse staffing hours per resident per day.
Official CMS rating based on clinical outcomes for residents.
Average daily nursing hours per resident (adjusted for acuity). Higher values indicate more nursing time per resident.
Official CMS rating based on health inspections, staffing and quality measures.
Official CMS rating based on deficiencies found during state health inspections.
Official CMS rating based on nurse staffing hours per resident per day.
Official CMS rating based on clinical outcomes for residents.
Average daily nursing hours per resident (adjusted for acuity). Higher values indicate more nursing time per resident.
May offer a more intimate, personalized care environment.
Lower occupancy suggests more openings may be available.
Most residents typically stay for a few weeks or months before returning home or moving on.
59% of new residents, usually for short-term rehab.
41% of new residents, often for short stays.
The portion of the home's budget spent on staff, including nurses, caregivers, and other employees who support care and operations.
All remaining costs needed to run the home, such as food, utilities, building maintenance, supplies and administrative expenses.
Total Residents: 100 Residents
Housing Options: Studio
Building Type: 2-story
Transportation Services
Fitness and Recreation
In Utah, the Department of Health and Human Services, Health Facility Licensing conducts regular onsite inspections to ensure compliance with state and federal healthcare standards.
Deficiencies indicate regulatory issues. A higher number implies the facility had several areas requiring improvement.
Assisted Living For seniors needing help with daily tasks but not full-time nursing.
Independent Living For self-sufficient seniors seeking community and minimal assistance.
Memory Care Specialized care for those with Memory Loss, Alzheimer's, or dementia, ensuring safety and support.
Nursing Homes 24/7 care needed
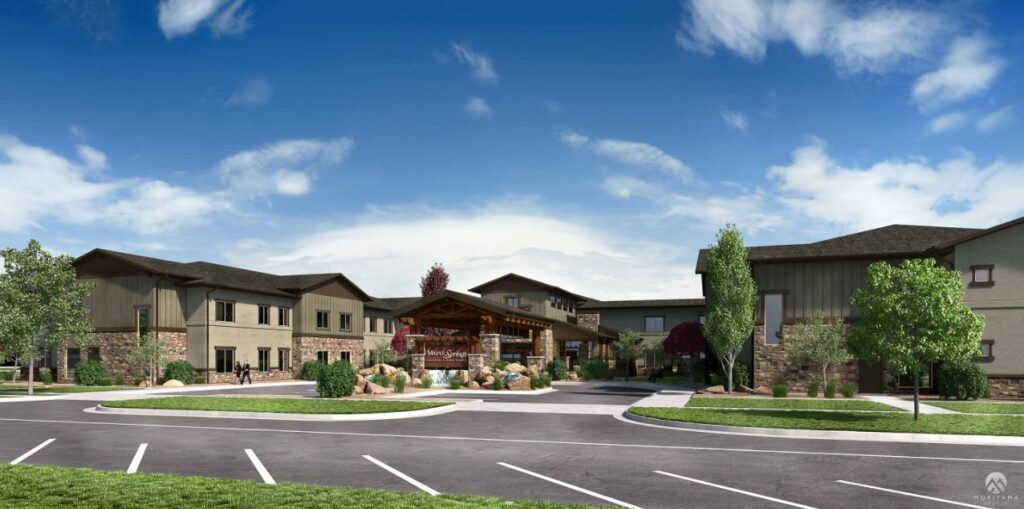 Maple Springs of North Logan
![]() 1.2 miles from city center
1.2 miles from city center
![]() 350 E 2200 N, North Logan, UT 84341
350 E 2200 N, North Logan, UT 84341
Add your location
Source: CMS Payroll-Based Journal (Q2 2025)
| Role ⓘ | Count ⓘ | Avg Shift (hrs) ⓘ | Uses Contractors? ⓘ |
|---|---|---|---|
| Registered Nurse | 18 | 9.6 | No |
| Licensed Practical Nurse | 13 | 9 | No |
| Certified Nursing Assistant | 61 | 6.3 | No |
| Role ⓘ | Employees ⓘ | Contractors ⓘ | Total Staff ⓘ | Total Hours ⓘ | Days Worked ⓘ | % of Days ⓘ | Avg Shift (hrs) ⓘ |
|---|---|---|---|---|---|---|---|
| Certified Nursing Assistant | 61 | 0 | 61 | 12,123 | 91 | 100% | 6.3 |
| Registered Nurse | 18 | 0 | 18 | 4,093 | 91 | 100% | 9.6 |
| Licensed Practical Nurse | 13 | 0 | 13 | 3,161 | 91 | 100% | 9 |
| Physical Therapy Assistant | 2 | 0 | 2 | 896 | 81 | 89% | 6.4 |
| Respiratory Therapy Technician | 4 | 0 | 4 | 792 | 73 | 80% | 7.1 |
| Administrator | 1 | 0 | 1 | 480 | 64 | 70% | 7.5 |
| Nurse Practitioner | 1 | 0 | 1 | 450 | 60 | 66% | 7.5 |
| Dietitian | 1 | 0 | 1 | 439 | 52 | 57% | 8.4 |
| Physical Therapy Aide | 1 | 0 | 1 | 400 | 63 | 69% | 6.4 |
| Other Dietary Services Staff | 1 | 0 | 1 | 353 | 39 | 43% | 9 |
| Speech Language Pathologist | 2 | 0 | 2 | 301 | 52 | 57% | 4.6 |
| Medical Director | 1 | 0 | 1 | 260 | 65 | 71% | 4 |
| Clinical Nurse Specialist | 1 | 0 | 1 | 260 | 65 | 71% | 4 |
| Feeding Assistant | 1 | 0 | 1 | 260 | 65 | 71% | 4 |
| Dental Services Staff | 1 | 0 | 1 | 196 | 27 | 30% | 7.2 |
| Occupational Therapy Aide | 1 | 0 | 1 | 85 | 13 | 14% | 6.5 |
| Qualified Social Worker | 1 | 0 | 1 | 52 | 31 | 34% | 1.7 |
Utah average 3.5
Last Health inspection on Nov 2023
Health citations are formal notices following inspections when they fail to comply with safety and care standards.
All 32 citations resulted from standard inspections.
Utah average: 0.7
Utah average: 2.5
Data sourced from CMS Health Deficiencies reports. Citation severity codes range from A (least serious) to L (most serious). Immediate Jeopardy (J-L) citations indicate situations where the facility's noncompliance has placed residents at risk of death or serious harm.
Source: CMS Long-Term Care Facility Characteristics (Data as of Jan 2026)
Active councils help families stay involved in care decisions and facility operations.
These measures show how residents usually do over time at this home, based on health outcomes and preventive care.
Utah average: 9.3
Utah average: 20.1
Utah average: 15.7%
Utah average: 21.3%
Utah average: 23.1%
Utah average: 2.6%
Utah average: 4.2%
Utah average: 2.1%
Utah average: 4.1%
Utah average: 16.5%
Utah average: 13.5%
Utah average: 97.1%
Utah average: 98.0%
Utah average: 92.9%
Utah average: 1.1%
Utah average: 91.0%
Quality measures are calculated from Minimum Data Set (MDS) assessments. For most measures, lower percentages indicate better care quality.
Historical financial and operational data for Maple Springs of North Logan based on CMS SNF Cost Reports.
Loading trend charts...
Care Cost Calculator: See Prices in Your Area
Nursing Home Data Explorer
Don’t Wait Too Long: 7 Red Flag Signs Your Parent Needs Assisted Living Now
The True Cost of Assisted Living in 2025 – And How Families Are Paying For It
Understanding Senior Living Costs: Pricing Models, Discounts & Financial Assistance

We help families find affordable senior communities and unlock same day discounts, Medicaid, and Medicare options tailored to your needs.
Contact us Today
Touring a community? Use this expert-backed checklist to stay organized, ask the right questions, and find the perfect fit.
We'll send you a PDF version of the touring checklist.


