


Total health inspections
3
State average 3.5
Last Health inspection on Nov 2023
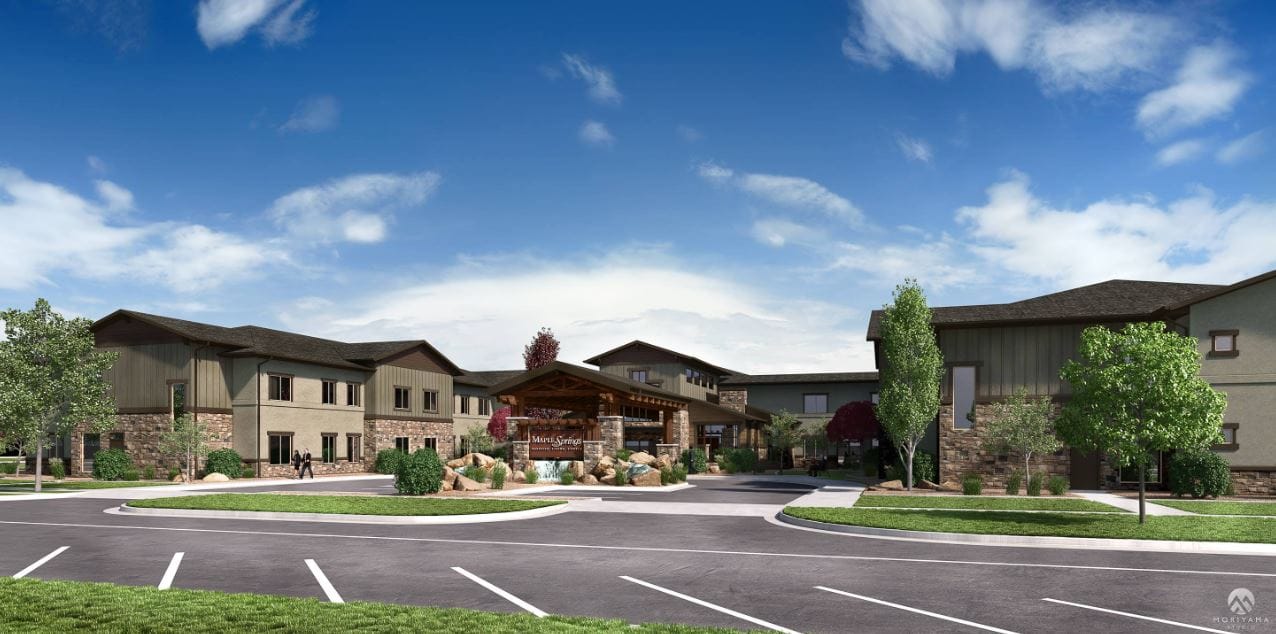
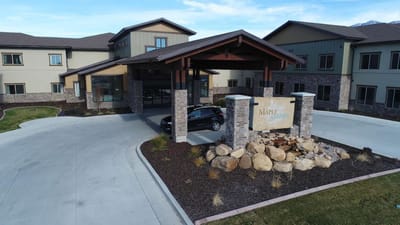
Tucked in the tranquil neighborhood of North Logan, UT, Maple Springs of North Logan is dedicated to improving seniors’ well-being with assisted living, memory care, skilled nursing, and rehabilitation services. Seniors and families can keep their peace of mind with a team of responsive and highly trained professionals caring for their needs and aspirations 24/7. Moreover, the community promotes a bright and welcoming environment for seniors to flourish and live their lives to the fullest.
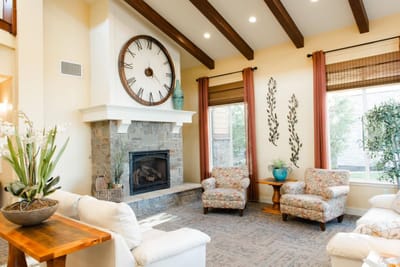
Residents do not run out of things to do with a lot of enriching activities and engaging programs that aim to keep them happy and socially connected. Here, delectable and healthy meals are served to satisfy nutritional needs and tastes. Amenities include a movie theater, onsite salon services, a library, and an ice cream parlor.
| Staff type | Hours / Day / Resident | vs state avg |
|---|---|---|
|
Registered Nurse (RN)
| 1h 10m per day | ■ Avg State avg: 1h 11m per day · National avg: 41m per day |
|
LPN / LVN
| 57m per day | ▲ 84% State avg: 31m per day · National avg: 52m per day |
|
Nurse Aide
| 3h 34m per day | ▲ 51% State avg: 2h 22m per day · National avg: 2h 20m per day |
|
Weekend Total Nursing
| 5h 17m per day | ▲ 50% State avg: 3h 31m per day · National avg: 3h 26m per day |
|
Physical Therapist
| 15m per day | ▲ 112% State avg: 7m per day · National avg: 4m per day |
|
Weekend RN
| 35m per day | ▼ 29% State avg: 50m per day · National avg: 28m per day |
In Utah, the Department of Health and Human Services, Health Facility Licensing conducts regular onsite inspections to ensure compliance with state and federal healthcare standards.
Deficiencies
| This Facility | UT Average | vs. UT Avg |
|---|---|---|---|
|
Total deficiencies
| 44 | 14 | This facility has 214% more total deficiencies than a typical Utah nursing home (44 vs. UT avg 14).↑ 214% worse |
|
Deficiencies per inspection
| 8.8 | 4.7 | This facility has 87% more deficiencies per inspection than a typical Utah nursing home (8.8 vs. UT avg 4.7).↑ 87% worse |
Inspections
| This Facility | UT Average | vs. UT Avg |
|---|---|---|---|
|
Total inspections
| 5 | 3 | This facility has had 67% more total inspections than the Utah average (5 vs. UT avg 3). More inspections can mean more regulatory scrutiny rather than worse care.↑ 67% more |
State average 3.5
Last Health inspection on Nov 2023
State average 27.7
State average 7.62
Health citations are formal notices following inspections when they fail to comply with safety and care standards.
All 32 citations resulted from standard inspections.
State average: 0.7
State average: 2.5
Reporting period: October 1 – December 31, 2025 (Q4 2025). Source: CMS Payroll-Based Journal report.
Manages medical care and health needs.
Assists with medical care and medications.
Helps with daily care and mobility.
| Certified Nursing Assistant | 57 | 0 | 57 | 12,041 | 92 | 100% | 6.2 |
| Licensed Practical Nurse | 14 | 0 | 14 | 3,201 | 92 | 100% | 7.8 |
| Registered Nurse | 17 | 0 | 17 | 3,160 | 92 | 100% | 9.1 |
| Physical Therapy Assistant | 2 | 0 | 2 | 893 | 82 | 89% | 6.1 |
| Respiratory Therapy Technician | 4 | 0 | 4 | 834 | 70 | 76% | 7 |
| Nurse Practitioner | 1 | 0 | 1 | 495 | 66 | 72% | 7.5 |
| Administrator | 1 | 0 | 1 | 443 | 59 | 64% | 7.5 |
| Speech Language Pathologist | 2 | 0 | 2 | 425 | 65 | 71% | 4.9 |
| Dental Services Staff | 1 | 0 | 1 | 405 | 56 | 61% | 7.2 |
| Physical Therapy Aide | 2 | 0 | 2 | 403 | 66 | 72% | 6 |
| Dietitian | 1 | 0 | 1 | 396 | 47 | 51% | 8.4 |
| Other Dietary Services Staff | 2 | 0 | 2 | 314 | 35 | 38% | 8.7 |
| Clinical Nurse Specialist | 2 | 0 | 2 | 297 | 66 | 72% | 3.8 |
| Medical Director | 1 | 0 | 1 | 264 | 66 | 72% | 4 |
| Feeding Assistant | 1 | 0 | 1 | 264 | 66 | 72% | 4 |
| Qualified Social Worker | 2 | 0 | 2 | 229 | 46 | 50% | 3.8 |
| Occupational Therapy Aide | 1 | 0 | 1 | 85 | 13 | 14% | 6.5 |
Federal penalties imposed by CMS for regulatory violations, including civil money penalties (fines) and denials of payment for new Medicare/Medicaid admissions.
Source: CMS Penalties Database
No penalties in the past 3 years
No civil money penalties or payment denials were reported in the last 3 years.
These measures show how residents usually do over time at this home, based on health outcomes and preventive care.
Utah average: 9.3
Utah average: 20.1
Utah average: 15.7%
Utah average: 21.3%
Utah average: 23.1%
Utah average: 2.6%
Utah average: 4.2%
Utah average: 2.1%
Utah average: 4.1%
Utah average: 16.5%
Utah average: 13.5%
Utah average: 97.1%
Utah average: 98.0%
Utah average: 92.9%
Utah average: 1.1%
Utah average: 91.0%
Utah average: 17.4%
Utah average: 11.8%
Utah average: 0.8%
Utah average: 53.7%
Utah average: 50.6%
Quality measures are calculated from Minimum Data Set (MDS) assessments. For most measures, lower percentages indicate better care quality.
59% of new residents, usually for short-term rehab.
41% of new residents, often for short stays.
Source: CMS Long-Term Care Facility Characteristics (Data as of Jan 2026)
Residents meet regularly to discuss policies, care quality, and activities
Part of a Continuing Care Retirement Community offering multiple care levels
Organized group of residents that meets regularly to discuss facility policies, quality of life, and activities.
Data sourced from CMS Long-Term Care Facility Characteristics quarterly report. Payer mix reflects the current resident census by primary payment source.
Historical financial and operational data for Maple Springs of North Logan from 2018–2023, based on CMS SNF Cost Reports.
Key figures below are for fiscal year ending in 12/2023.
Based on CMS SNF Cost Report for fiscal year ending in 12/2023.
Housing Options: Studio
Building Type: 2-story
Transportation Services
Fitness and Recreation
Most residents typically stay for a few weeks or months before returning home or moving on.
Most new residents arrive under Medicare (59% of admissions), and a typical Medicare stay runs around 1 months.
Coverage residents most often arrive under.
Coverage residents most often leave under.
![]() 1.2 miles from city center
1.2 miles from city center
![]() Estimated distance in miles from North Logan's city center to Maple Springs of North Logan's address, calculated via Google Maps.
Estimated distance in miles from North Logan's city center to Maple Springs of North Logan's address, calculated via Google Maps.
Add your location
Info below is compiled from CMS reports & the UT Dept. of Health & Human Services (DHHS), senior community websites & trusted data sources such as Walk Score & BBB.
Communities are listed from highest to lowest based on our ranking methodology.
| Pointe Meadows Health and Rehabilitation | NH MC SNF | Lehi | 99
Facility
99
UT AVG
84
Rank
#67 / 192 |
84.4%
Facility
84.4%
UT AVG
69.3
Rank
#22 / 71 | +22% | 3.85
Facility
3.85
UT AVG
3.72
Rank
#15 / 75 | -6% | +3% | $0
Facility
$0
UT AVG
$52.4k
Rank
#1 / 75 | 22
Facility
22
UT AVG
27.7
Rank
#32 / 70 | 7.3
Facility
7.3
UT AVG
7.6
Rank
#41 / 70 | - | 84 | - |
70
Facility
70
UT AVG
47
Rank
#60 / 280 | Pointe Meadow Healthcare Inc | $13.6MFiscal year ending 06/2024
Facility
$13.6MFiscal year ending 06/2024
UT AVG
$10.3M
Rank
#12 / 72 | $7.5MFiscal year ending 06/2024
Facility
$7.5MFiscal year ending 06/2024
UT AVG
$3.8M
Rank
#9 / 72 | 55.2%Fiscal year ending 06/2024
Facility
55.2%Fiscal year ending 06/2024
UT AVG
38%
Rank
#35 / 72 | 465188 | ||||
| Stonehenge of Orem | NH HOS PC RC SNF | Orem (Windsor South) | 34
Facility
34
UT AVG
84
Rank
#165 / 192 |
92.4%
Facility
92.4%
UT AVG
69.3
Rank
#11 / 71 | +33% | 3.93
Facility
3.93
UT AVG
3.72
Rank
#15 / 75 | -29% | +5% | $0
Facility
$0
UT AVG
$52.4k
Rank
#1 / 75 | 1
Facility
1
UT AVG
27.7
Rank
#1 / 70 | 1.0
Facility
1.0
UT AVG
7.6
Rank
#1 / 70 | - | 31 | - |
73
Facility
73
UT AVG
47
Rank
#40 / 280 | Stonehenge Of Orem, LLC | $4.9MFiscal year ending 12/2023
Facility
$4.9MFiscal year ending 12/2023
UT AVG
$10.3M
Rank
#50 / 72 | $2.3MFiscal year ending 12/2023
Facility
$2.3MFiscal year ending 12/2023
UT AVG
$3.8M
Rank
#64 / 72 | 46.4%Fiscal year ending 12/2023
Facility
46.4%Fiscal year ending 12/2023
UT AVG
38%
Rank
#64 / 72 | 465167 | ||||
| Advanced Health Care of St George | NH SNF | Saint George | 100
Facility
100
UT AVG
84
Rank
#62 / 192 |
42.6%
Facility
42.6%
UT AVG
69.3
Rank
#60 / 71 | -39% | 5.10
Facility
5.10
UT AVG
3.72
Rank
#5 / 75 | -16% | +37% | $0
Facility
$0
UT AVG
$52.4k
Rank
#1 / 75 | 8
Facility
8
UT AVG
27.7
Rank
#4 / 70 | 4.0
Facility
4.0
UT AVG
7.6
Rank
#10 / 70 | - | 43 | - |
26
Facility
26
UT AVG
47
Rank
#213 / 280 | Jason Swigert | $6.6MFiscal year ending 12/2023
Facility
$6.6MFiscal year ending 12/2023
UT AVG
$10.3M
Rank
#34 / 72 | $3.9MFiscal year ending 12/2023
Facility
$3.9MFiscal year ending 12/2023
UT AVG
$3.8M
Rank
#45 / 72 | 58.2%Fiscal year ending 12/2023
Facility
58.2%Fiscal year ending 12/2023
UT AVG
38%
Rank
#58 / 72 | 465190 | ||||
| Stonehenge of Ogden | NH HOS PC RC SNF | Washington Terrace | 52
Facility
52
UT AVG
84
Rank
#134 / 192 |
69.2%
Facility
69.2%
UT AVG
69.3
Rank
#42 / 71 | 0% | 4.10
Facility
4.10
UT AVG
3.72
Rank
#13 / 75 | -34% | +10% | $0
Facility
$0
UT AVG
$52.4k
Rank
#1 / 75 | 12
Facility
12
UT AVG
27.7
Rank
#9 / 70 | 4.0
Facility
4.0
UT AVG
7.6
Rank
#10 / 70 | - | 36 | - |
29
Facility
29
UT AVG
47
Rank
#204 / 280 | Stonehenge Of Ogden LLC | $6.9MFiscal year ending 12/2023
Facility
$6.9MFiscal year ending 12/2023
UT AVG
$10.3M
Rank
#31 / 72 | $4.1MFiscal year ending 12/2023
Facility
$4.1MFiscal year ending 12/2023
UT AVG
$3.8M
Rank
#40 / 72 | 59.2%Fiscal year ending 12/2023
Facility
59.2%Fiscal year ending 12/2023
UT AVG
38%
Rank
#57 / 72 | 465182 | ||||
| Maple Springs of North Logan | NH AL MC RC SNF | North Logan | 80
Facility
80
UT AVG
84
Rank
#87 / 192 | - | - | 5.52
Facility
5.52
UT AVG
3.72
Rank
#2 / 75 | -9% | +48% | $12.7k
Facility
$12.7k
UT AVG
$52.4k
Rank
#40 / 75 | 32
Facility
32
UT AVG
27.7
Rank
#54 / 70 | 10.7
Facility
10.7
UT AVG
7.6
Rank
#58 / 70 | - | 37 | - |
33
Facility
33
UT AVG
47
Rank
#197 / 280 | - | $8.4MFiscal year ending 12/2023
Facility
$8.4MFiscal year ending 12/2023
UT AVG
$10.3M
Rank
#25 / 72 | $4.8MFiscal year ending 12/2023
Facility
$4.8MFiscal year ending 12/2023
UT AVG
$3.8M
Rank
#33 / 72 | 56.8%Fiscal year ending 12/2023
Facility
56.8%Fiscal year ending 12/2023
UT AVG
38%
Rank
#48 / 72 | 465186 |
Maple Springs of North Logan has a walk score of 33. Somewhat walkable. A few nearby services may be reachable on foot, but most trips require transportation.
Maple Springs of North Logan's occupancy is 55.8%.
Maple Springs of North Logan has been operating for approximately 9 years, based on available licensing and registration records.
No, Maple Springs of North Logan has a no-pet policy.
Maple Springs of North Logan is registered as a for-profit in UT.
Maple Springs of North Logan has 80 beds.
Yes — there are 3 photos of Maple Springs of North Logan in the photo gallery on this page.
Care Cost Calculator: See Prices in Your Area
Nursing Home Data Explorer
Don’t Wait Too Long: 7 Red Flag Signs Your Parent Needs Assisted Living Now
The True Cost of Assisted Living in 2025 – And How Families Are Paying For It
Understanding Senior Living Costs: Pricing Models, Discounts & Financial Assistance


