Explore Open Rooms

1 Contact details
2 What type of senior care service are you looking for?
3 What budget do you have in mind for senior care?
4 How soon do you need to find care?
5 Additional details

Thank you for your interest!

Our team will be in touch shortly to help with next steps.

Nursing Home

Meadow Park Rehabilitation & Healthcare Center

Nursing Home

Meadow Park Rehabilitation & Healthcare Center

1525 Rolling Rd., Catonsville, MD 21228 View map
Overview of Meadow Park Rehabilitation & Healthcare Center

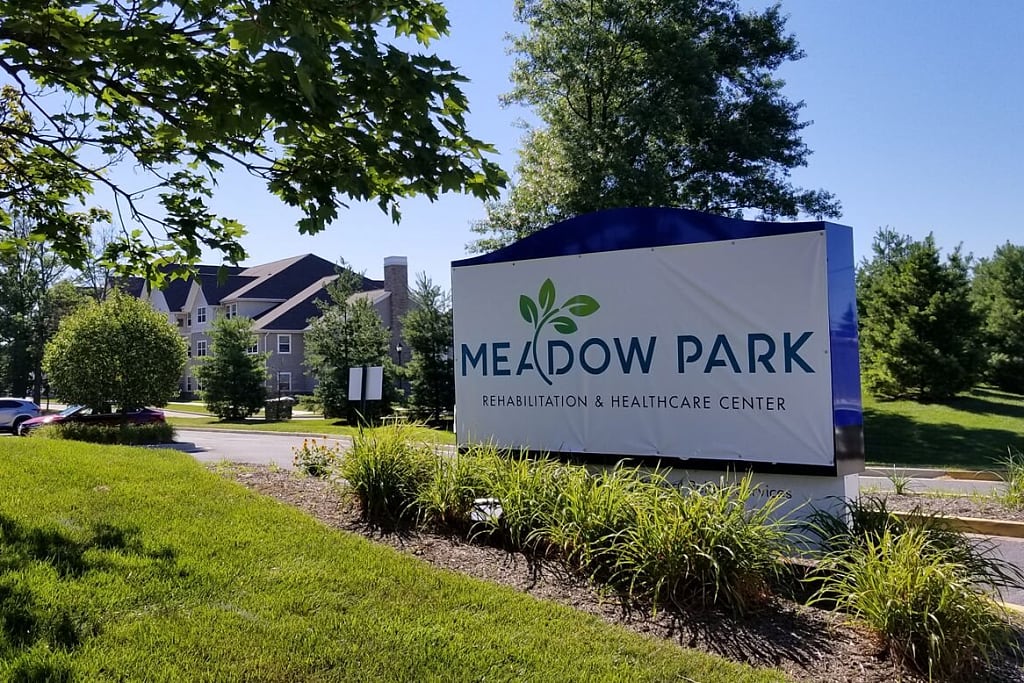
Meadow Park Rehabilitation & Healthcare Center offers skilled nursing care and a comprehensive range of rehabilitation services including physical, occupational, and speech therapy for individuals in need of recovery and seniors looking for long-term care. Operated by a dedicated team of certified professionals including nurses and therapists, collaborative efforts ensure that personalized care plans for each resident are expertly crafted. Assistance with daily living activities are also provided with warmth and compassion, alongside comfortable private or semi-private rooms, healthy meals, and access to engaging social and recreational options for residents.

(410) 402-1200

Managed by Eileen Alexander

Administrator

Eileen Alexander serves as the Administrator at Meadow Park Rehabilitation & Healthcare Center, providing dedicated leadership to ensure quality care and a supportive environment for residents. She leads the community with a focus on resident well-being and operational excellence.

Quality ratings

Measured by Centers for Medicare & Medicaid Services (CMS)

Overall rating Info The Overall CMS Rating combines results from health inspections, staffing levels and quality measures. Health inspections carry the most weight. Staffing and quality scores can increase or decrease the final rating based on performance compared to state and national standards.
3/5
Maryland average: 3.0/5
Health Inspection Info Based on the results of the facility's three most recent standard inspections and any complaint investigations. CMS reviews the number, scope, and severity of deficiencies, with more recent findings weighted more heavily.
2/5
Maryland average: 2.8/5
Staffing Info Measures average nursing staff hours per resident per day, including Registered Nurses (RNs) and total nursing staff. Ratings are adjusted based on the level of care residents require and are compared to state and national benchmarks.
2/5
Maryland average: 3.0/5
Quality Measures Info Based on clinical and physical health indicators reported to CMS, such as hospital readmissions, falls, pressure ulcers, and improvements in mobility. These measures reflect how well residents' health needs are being managed.
5/5
Maryland average: 3.7/5

Nursing care per resident

Info This shows how many total hours of nursing staff time are available per resident each day. Higher numbers usually mean more staff support.
2h 41m per day

This home provides 29% less nursing time per resident than the Maryland average.

Maryland average: 3h 46m per day

Staffing hours breakdown

Info Hours of care per resident per day, broken down by staff type. Data from CMS Medicare.
Staff type Facility State avg National avg
Registered Nurse (RN) Info Registered nurse hours per resident per day. 39m per day 50m per day 41m per day
Nurse Aide Info Nurse aide hours per resident per day. 1h 55m per day 2h 10m per day 2h 21m per day
Total Nursing (Weekend) Info Total number of nurse staff hours per resident per day on weekends. 3h 4m per day 3h 29m per day 3h 26m per day
RN (Weekend) Info Registered nurse hours per resident per day on weekends. 26m per day 37m per day 29m per day

Capacity and availability

Medium-capacity home

Offers a balance of services and community atmosphere.

Total beds 120

This home usually has limited availability

Occupancy is moderate, suggesting balanced demand.

Similar demand to the Maryland average
Occupancy rate 94.6%
Residents per day (avg) 116
Occupancy rate
94.6%
Residents per day (avg)
116

Who this home usually serves

TYPE OF STAY

Mostly short-term rehab stays

Most residents typically stay for a few weeks or months before returning home or moving on.

Might be optimal for
Short stays Recovery Medicare-covered care

Breakdown by payment type

Medicare

51% of new residents, usually for short-term rehab.

Typical stay 1 - 2 months

Private pay

29% of new residents, often for short stays.

Typical stay 28 days

Medicaid

20% of new residents, often for long-term daily care.

Typical stay 11 - 12 months

Finances and operations

Privately-owned community
Operated by a business corporation.
Home revenue
$19.0M
Operating loss
-$517.6K
Privately-owned community Operated by a business corporation.
Home revenue
$18,968,348.00
Operating loss
$-517,608.00
Payroll costs Info The portion of the home's budget spent on staff, including nurses, caregivers, and other employees who support care and operations.
$6.9M
36.1% of revenue
Other operating costs Info All remaining costs needed to run the home, such as food, utilities, building maintenance, supplies and administrative expenses.
$12.6M
Total costs $19.5M

Health Inspection History

Inspections
Total health inspections 3

Maryland average 3.9


Last Health inspection on Jun 2025

Total health citations 48

Maryland average 49.9

Citations per inspection
16

Maryland average 12.81


Health citations are formal notices following inspections when they fail to comply with safety and care standards.

43 of 48 citations resulted from standard inspections; 4 of 48 resulted from complaint investigations; and 1 of 48 came from combined inspections (standard and complaint).

Breakdown of citation severity (last 3 years)
Critical Health citations More info 2
300% worse than Maryland average

Maryland average: 0.5


Serious Health citations More info 0
100% better than Maryland average

Maryland average: 0.6

2 critical citations More info Maryland average: 0.5

0 serious citations More info Maryland average: 0.6

46 moderate citations More info Maryland average: 47.2

0 minor citations More info Maryland average: 1.7
Citations history (last 3 years)
Abuse/Neglect moderate citation Info Issues related to protecting resident's from harm, including abuse, neglect, or mistreatment. Jun 18, 2025
Corrected

Abuse/Neglect moderate citation Info Issues related to protecting resident's from harm, including abuse, neglect, or mistreatment. Jun 18, 2025
Corrected

Quality of Care critical citation Info Issues related to how well residents receive appropriate treatment and support for their medical and daily care needs. Jun 18, 2025
Corrected

Care Planning moderate citation Info Issues related to creating and updating personalized care plans for residents based on their needs and conditions. Jun 18, 2025
Corrected

Compare Nursing Homes around Catonsville The information below is reported by the Maryland Department of Health, Office of Health Care Quality.

1 facility compared · CMS & MD Dept. of Health data · Updated Apr 2026

Meadow Park Rehabilitation & Healthcare Center
N

Nursing

NH

Nursing Home Licensed facility providing 24/7 skilled nursing care for residents with complex, ongoing medical needs. Staffed by RNs, LPNs, and CNAs. Inspected and star-rated annually by CMS. Accepts Medicare (short-term rehab) and Medicaid (long-term care).

Catonsville
120
94.6%
+15%
2.69
-33%
-29%
1
48
2
116
59
Hubbard, Margaret
$18,6M
$6,9M
36.8%
215347

Places of interest near Meadow Park Rehabilitation & Healthcare Center

Address 2.5 miles from city center — 4.83 miles to nearest hospital (Ascension Saint Agnes Hospital)

Address 1525 Rolling Rd., Catonsville, MD 21228

Calculate Travel Distance to Meadow Park Rehabilitation & Healthcare Center

Add your location

Address

Staffing Data (Q2 2025)

This data corresponds to Q2 2025 and is based on CMS Payroll-Based Journal.

Total staff 170
Employees 142
Contractors 28
Staff to resident ratio 1.49:1
18% worse than Maryland average

Maryland average ratio: 1.81:1

Avg staff/day 65
Average shift 7.6 hours
5% worse than Maryland average

Maryland average: 8 hours

Total staff hours (quarter) 44,768
Nursing staff breakdown
Registered Nurse

Manages medical care and health needs.

Total count 15
Average shift length Info Average shift length. Calculated as total hours divided by days worked and average staff per day. 8.2 hours

This role is partially covered by contractors.

Licensed Practical Nurse

Assists with medical care and medications.

Total count 38
Average shift length Info Average shift length. Calculated as total hours divided by days worked and average staff per day. 7.7 hours

This role is partially covered by contractors.

Certified Nursing Assistant

Helps with daily care and mobility.

Total count 69
Average shift length Info Average shift length. Calculated as total hours divided by days worked and average staff per day. 7.4 hours

No contractors work on this role.

Contractor staffing

Total hours from contractors

8.7%

3,887 contractor hours this quarter

Physical Therapy Assistant: 7 Speech Language Pathologist: 5 Respiratory Therapy Technician: 4 Physical Therapy Aide: 4 Registered Nurse: 4 Qualified Social Worker: 3 Licensed Practical Nurse: 1
Staff by category
Certified Nursing Assistant6906919,02691100%7.4
Licensed Practical Nurse371389,65991100%7.7
Registered Nurse114153,91391100%8.2
RN Director of Nursing4041,9258189%8.1
Clinical Nurse Specialist4041,6098593%7.2
Other Dietary Services Staff4041,46091100%7.8
Mental Health Service Worker2021,0137077%8.3
Respiratory Therapy Technician0449696673%7.8
Medication Aide/Technician6069618189%7.3
Physical Therapy Assistant0779567582%7.2
Physical Therapy Aide0446226673%7.1
Speech Language Pathologist0555897279%5.7
Nurse Practitioner1015126470%8
Qualified Social Worker0335046470%7.2
Administrator1014966268%8
Dietitian1014245358%8
Qualified Activities Professional1011172629%4.5
Nurse Aide in Training1011522%7.5
69 Certified Nursing Assistant
% of Days 100%
38 Licensed Practical Nurse
% of Days 100%
15 Registered Nurse
% of Days 100%
4 RN Director of Nursing
% of Days 89%
4 Clinical Nurse Specialist
% of Days 93%
4 Other Dietary Services Staff
% of Days 100%
2 Mental Health Service Worker
% of Days 77%
4 Respiratory Therapy Technician
% of Days 73%
6 Medication Aide/Technician
% of Days 89%
7 Physical Therapy Assistant
% of Days 82%
4 Physical Therapy Aide
% of Days 73%
5 Speech Language Pathologist
% of Days 79%
1 Nurse Practitioner
% of Days 70%
3 Qualified Social Worker
% of Days 70%
1 Administrator
% of Days 68%
1 Dietitian
% of Days 58%
1 Qualified Activities Professional
% of Days 29%
1 Nurse Aide in Training
% of Days 2%

Facility Characteristics

Source: CMS Long-Term Care Facility Characteristics (Data as of Jan 2026)

Total census
114 residents
Residents by payment source
Medicare
29 residents (25.4%)
Medicaid
75 residents (65.8%)
Private pay or other
10 residents (8.8%)
Programs & Services
Residents' Group

Residents meet regularly to discuss policies, care quality, and activities

Active Resident Council

Organized group of residents that meets regularly to discuss facility policies, quality of life, and activities.

Quality of care over time

These measures show how residents usually do over time at this home, based on health outcomes and preventive care.

High-risk clinical events score Info A composite score based on pressure ulcers, falls with injury, weight loss, walking ability decline, and activities of daily living decline. 4.4
66% better than Maryland average

Maryland average: 12.9

Functional decline score Info A composite score based on activities of daily living decline, walking ability decline, and incontinence. 10.7
58% better than Maryland average

Maryland average: 25.7

Long-stay resident measures
Significantly above average Maryland avg: 3.8 Info CMS star rating based on long-stay quality measure performance. 5 stars = significantly above average, 1 star = significantly below average.
Need for Help with Daily Activities Increased Info Percent of long-stay residents whose need for help with daily activities has increased 4.2%
82% better than Maryland average

Maryland average: 23.7%

Low Risk Residents with Bowel/Bladder Incontinence Info Percent of low risk long-stay residents who lose control of their bowels or bladder 17.2%
34% better than Maryland average

Maryland average: 25.9%

Falls with Major Injury Info Percent of long-stay residents experiencing one or more falls with major injury 0.3%
88% better than Maryland average

Maryland average: 2.3%

High Risk Residents with Pressure Ulcers Info Percent of long-stay high risk residents with pressure ulcers 5.3%
19% better than Maryland average

Maryland average: 6.5%

Urinary Tract Infection Info Percent of long-stay residents with a urinary tract infection 1.1%
30% better than Maryland average

Maryland average: 1.6%

Lost Too Much Weight Info Percent of long-stay residents who lose too much weight 7.7%
32% worse than Maryland average

Maryland average: 5.8%

Depressive Symptoms Info Percent of long-stay residents who have depressive symptoms 91.4%
353% worse than Maryland average

Maryland average: 20.2%

Antipsychotic Use Info Percent of long-stay residents who received an antipsychotic medication 15.2%
18% worse than Maryland average

Maryland average: 12.9%

Pneumococcal Vaccine Info Percent of long-stay residents assessed and appropriately given the pneumococcal vaccine 99.7%
8% better than Maryland average

Maryland average: 92.0%

Influenza Vaccine Info Percent of long-stay residents assessed and appropriately given the seasonal influenza vaccine 99.0%
In line with Maryland average

Maryland average: 96.6%

Hospitalizations per 1,000 days Info Number of hospitalizations per 1,000 long-stay resident days. 1.33
In line with Maryland average

Maryland average: 1.32

ED visits per 1,000 days Info Number of outpatient emergency department visits per 1,000 long-stay resident days. 0.15
88% better than Maryland average

Maryland average: 1.21

Short-stay resident measures
Significantly above average Maryland avg: 3.7 Info CMS star rating based on short-stay quality measure performance. 5 stars = much above average, 1 star = much below average.
Pneumococcal Vaccine Info Percent of short-stay residents assessed and appropriately given the pneumococcal vaccine 99.1%
26% better than Maryland average

Maryland average: 78.4%

Antipsychotic medication increase Info Percent of short-stay residents who newly received an antipsychotic medication 0.6%
55% better than Maryland average

Maryland average: 1.4%

Influenza Vaccine Info Percent of short-stay residents assessed and appropriately given the seasonal influenza vaccine 95.6%
19% better than Maryland average

Maryland average: 80.6%

Re-hospitalized after SNF stay Info Percentage of short-stay residents who were re-hospitalized after their nursing home admission. 15.0%
29% better than Maryland average

Maryland average: 21.2%

Emergency department visits Info Percentage of short-stay residents who had an outpatient emergency department visit. 4.3%
57% better than Maryland average

Maryland average: 9.9%

Falls with major injury Info Percentage of SNF residents who experience falls with major injury during their stay. 0.0%
100% better than Maryland average

Maryland average: 0.8%

Ability to care for self at discharge Info Percentage of residents at or above expected ability to care for themselves at discharge. 74.3%
38% better than Maryland average

Maryland average: 53.7%

Successful return to home or community Info Rate of successful return to home or community from a skilled nursing facility. 53.7%
6% better than Maryland average

Maryland average: 50.6%

Penalties and fines

Federal penalties imposed by CMS for regulatory violations, including civil money penalties (fines) and denials of payment for new Medicare/Medicaid admissions.

Source: CMS Penalties Database (Data as of Jan 2026)

Total fines amount $11K
82% lower than Maryland average

Maryland average: $61K

Number of fines 1
33% fewer fines than Maryland average

Maryland average: 1.5

Payment Denials Info Serious action where Medicare and/or Medicaid temporarily stops payments for new residents until issues are fixed. 0
100% fewer payment denials than Maryland average

Maryland average: 0.1

Fines amount comparison
This facility $11K
Maryland average $61K
Penalty History

Penalties are imposed by CMS for violations of federal nursing home regulations.

Civil Money Penalty Info Fines imposed for noncompliance, which can be assessed per day or per instance of violation. Jun 18, 2025
$11K

Last updated: Jan 2026

Guides for Better Senior Living

Care Cost Calculator: See Prices in Your Area

Nursing Home Data Explorer

Don’t Wait Too Long: 7 Red Flag Signs Your Parent Needs Assisted Living Now

The True Cost of Assisted Living in 2025 – And How Families Are Paying For It

Understanding Senior Living Costs: Pricing Models, Discounts & Financial Assistance

Financial Aid for Maryland Seniors

Get financial aid guidance

Community Options Waiver

Maryland Medicaid Community Options Waiver

Age 65+ or disabled, Maryland resident, Medicaid- eligible, nursing home-level care need.

~$2,829/month (300% FBR, individual).

$2,000 (individual), $3,000 (couple) (excludes home, car).

High urban demand; rural outreach efforts.

Senior Care Program

Maryland Senior Care

Age 65+, Maryland resident, at risk of nursing home placement.

~$2,000/month (individual, varies by county).

$11,000 (individual).

Limited funding; waitlists common in high-demand areas.

Maryland Nursing Home Medicaid

Maryland Medical Assistance (Medicaid) Nursing Home Program

Age 65+, Maryland resident, Medicaid-eligible, requires nursing home-level care.

$943/month (individual); most income applied to care costs.

$2,500 (individual), $3,000 (couple); spousal protections up to $155,356.

Home equity limit $636,000; estate recovery applies post-55.

Senior Assisted Living Subsidy Program

Maryland Senior Assisted Living Group Home Subsidy

Age 62+, Maryland resident, in or moving to approved assisted living, low/moderate income.

~$34,000/year (individual, varies by county).

Not strict; prioritizes low-income.

Not available statewide; facility must be licensed by MDH.

Veterans Aid and Attendance (A&A) Benefit

Maryland VA Aid and Attendance

Wartime veteran/spouse, age 65+ or disabled, needs ADL help, Maryland resident.

Net income minus medical expenses < $1,984/month (individual with A&A).

$155,356 (net worth limit).

High veteran population in suburban/rural areas.

Senior Prescription Drug Assistance Program (SPDAP)

Maryland Senior Prescription Drug Assistance Program

Age 65+, Maryland resident (6+ months), Medicare Part D enrolled.

$48,560/year (individual, 300% FPL).

None specified.

Supplements Medicare Part D; annual enrollment required.

Medicare Savings Programs (MSP)

Maryland Medicare Savings Programs

Age 65+, Maryland resident, Medicare Part A/B enrollee.

$2,014/month (QMB), $2,706/month (SLMB/QI, individual).

$9,090 (individual), $13,630 (couple).

Includes QMB, SLMB, QI categories.

Community Personal Assistance Services (CPAS)

Maryland Medicaid Community Personal Assistance Services

Age 65+, Maryland resident, Medicaid-eligible, needs ADL assistance.

$943/month (individual); spend-down available.

$2,500 (individual), $3,000 (couple).

Consumer-directed option allows hiring family caregivers.