Explore Open Rooms

1 Contact details
2 What type of senior care service are you looking for?
3 What budget do you have in mind for senior care?
4 How soon do you need to find care?
5 Additional details

Thank you for your interest!

Our team will be in touch shortly to help with next steps.

Memory Care in Grand Rapids

CMS overall rating Info The Overall CMS Rating combines results from health inspections, staffing levels and quality measures. Health inspections carry the most weight. Staffing and quality scores can increase or decrease the final rating based on performance compared to state and national standards.

Medilodge of Grand Rapids

2000 Leonard St NE, Grand Rapids, MI 49505 View map
Overview of Medilodge of Grand Rapids

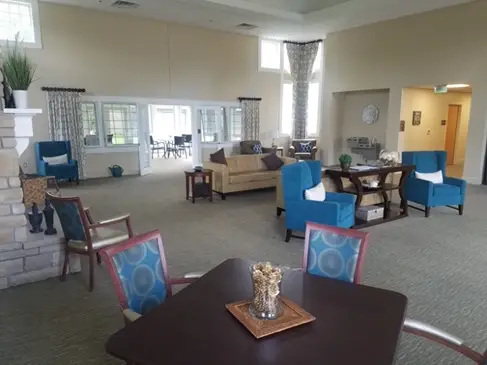
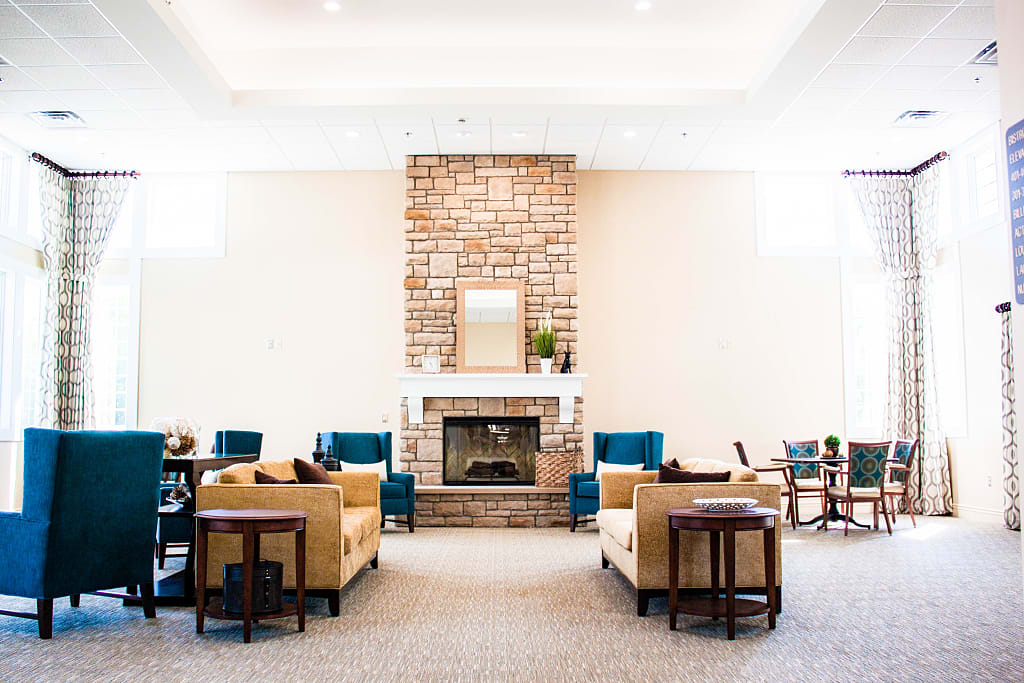
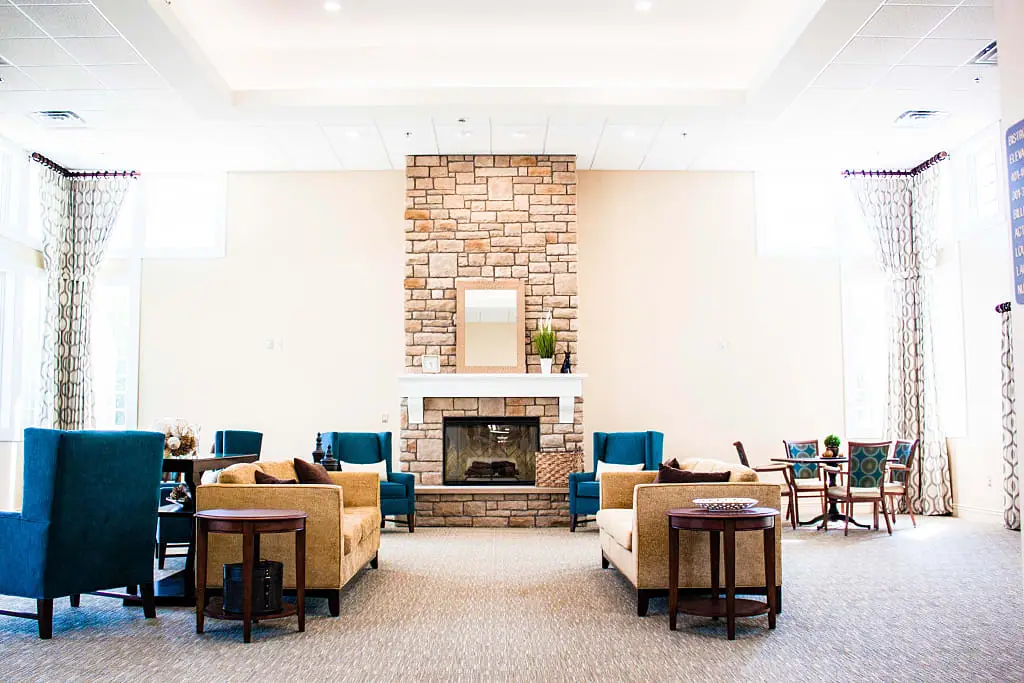
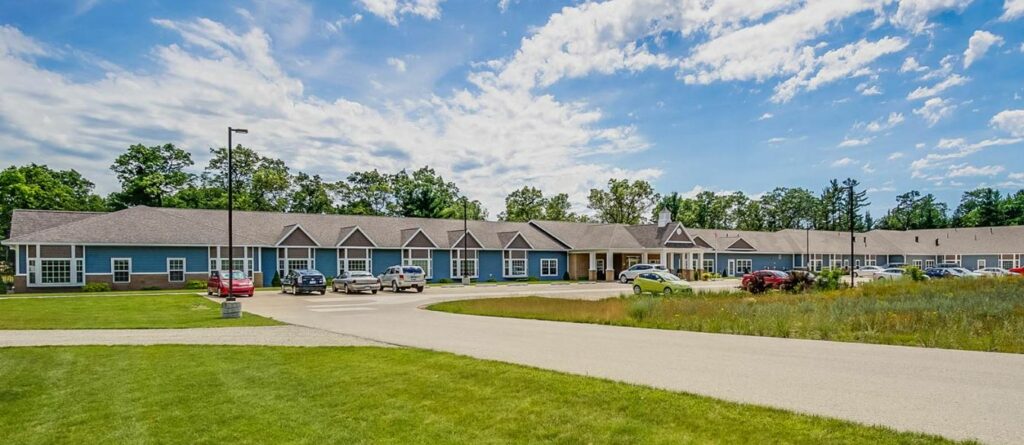
Medilodge of Wyoming in Grand Rapids offers long-term skilled nursing care and short-term rehabilitation services, as well as adaptive healthcare options for maximum independence and comfort. For those requiring specialized care, the facility also provides IV and infusion therapy, respite care, and wound care treatments.

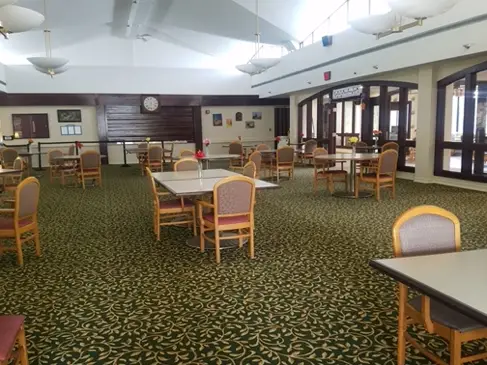
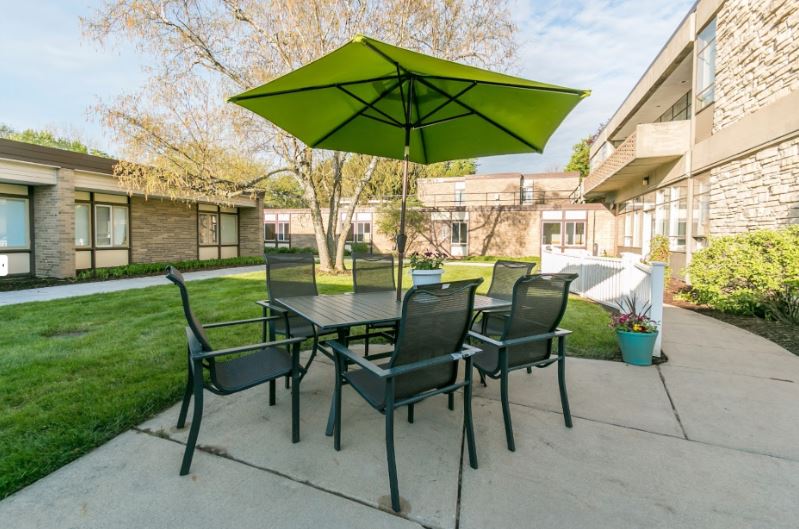
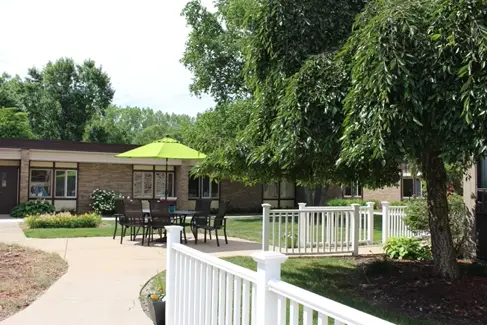
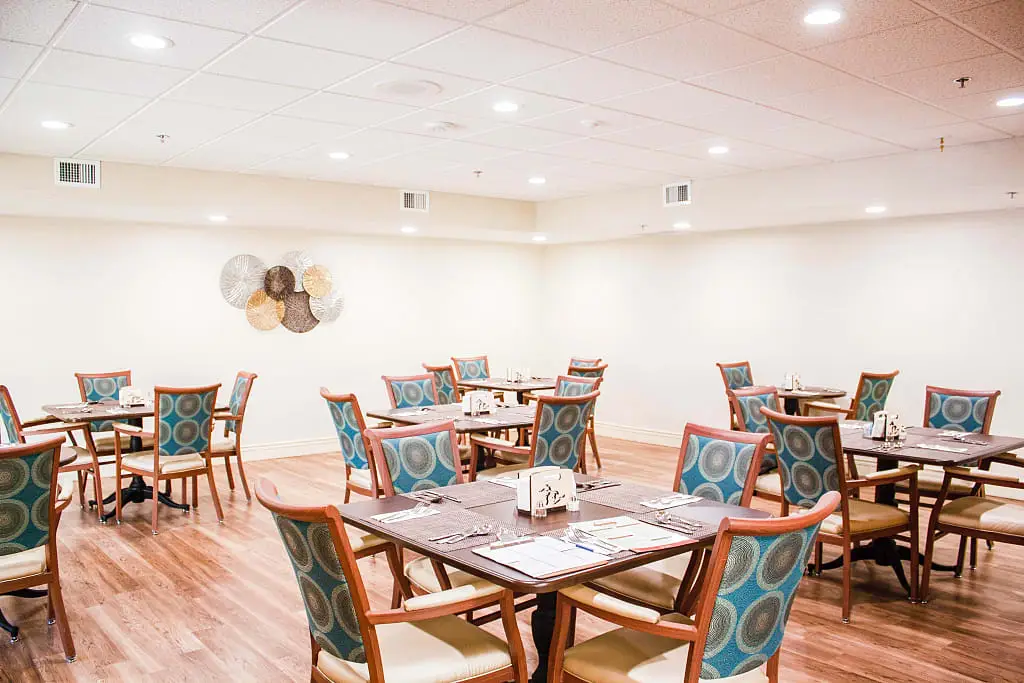
Transportation is made easy with Medilodge of Wyoming’s VA-contracted facility, and residents can enjoy plenty of outings to stay active and engaged. The dining options at the Medilodge of Wyoming are exceptional as well. Experienced chefs prepare savory and exquisite flavors that are sure to delight residents every day, punctuated by the airy atmosphere of the facility that is perfect for healing and rejuvenation.

(616) 458-1133

Quality ratings

Measured by Centers for Medicare & Medicaid Services (CMS)

Overall rating Info The Overall CMS Rating combines results from health inspections, staffing levels and quality measures. Health inspections carry the most weight. Staffing and quality scores can increase or decrease the final rating based on performance compared to state and national standards.
1/5
Michigan average: 3.6/5
Health Inspection Info Based on the results of the facility's three most recent standard inspections and any complaint investigations. CMS reviews the number, scope, and severity of deficiencies, with more recent findings weighted more heavily.
1/5
Michigan average: 3.3/5
Staffing Info Measures average nursing staff hours per resident per day, including Registered Nurses (RNs) and total nursing staff. Ratings are adjusted based on the level of care residents require and are compared to state and national benchmarks.
3/5
Michigan average: 3.4/5
Quality Measures Info Based on clinical and physical health indicators reported to CMS, such as hospital readmissions, falls, pressure ulcers, and improvements in mobility. These measures reflect how well residents' health needs are being managed.
3/5
Michigan average: 3.8/5

Nursing care per resident

Info This shows how many total hours of nursing staff time are available per resident each day. Higher numbers usually mean more staff support.
4h 6m per day

This home provides 4% less nursing time per resident than the Michigan average.

Michigan average: 4h 15m per day

Staffing hours breakdown

Info Hours of care per resident per day, broken down by staff type. Data from CMS Medicare.
Staff type Facility State avg National avg
Registered Nurse (RN) Info Registered nurse hours per resident per day. 46m per day 46m per day 41m per day
Nurse Aide Info Nurse aide hours per resident per day. 2h 19m per day 2h 23m per day 2h 21m per day
Total Nursing (Weekend) Info Total number of nurse staff hours per resident per day on weekends. 3h 24m per day 3h 31m per day 3h 26m per day
Physical Therapist Info Physical therapist staff hours per resident per day. 6m per day 4m per day 4m per day
RN (Weekend) Info Registered nurse hours per resident per day on weekends. 26m per day 29m per day 29m per day

Capacity and availability

Medium-capacity home

Offers a balance of services and community atmosphere.

Total beds 103

This home usually has availability

Lower occupancy suggests more openings may be available.

Lower demand than the Michigan average
Occupancy rate 47.6%
Residents per day (avg) 49
Occupancy rate
47.6%
Residents per day (avg)
49

Who this home usually serves

TYPE OF STAY

Mix of rehab and long-term care

This home supports both short-term rehab and long-term care, with residents staying for a wide range of durations.

Breakdown by payment type

Medicare

15% of new residents, usually for short-term rehab.

Typical stay 1 - 2 months

Private pay

56% of new residents, often for short stays.

Typical stay 7 - 8 months

Medicaid

29% of new residents, often for long-term daily care.

Typical stay 5 months

Finances and operations

Privately-owned community
Operated by a business corporation.
Home revenue
$13.5M
Operating loss
-$1.1M
Privately-owned community Operated by a business corporation.
Home revenue
$13,504,758.00
Operating loss
$-1,143,192.00
Payroll costs Info The portion of the home's budget spent on staff, including nurses, caregivers, and other employees who support care and operations.
$5.1M
38.1% of revenue
Other operating costs Info All remaining costs needed to run the home, such as food, utilities, building maintenance, supplies and administrative expenses.
$9.5M
Total costs $14.6M
Bed community size
103-bed community
A larger shared setting that may offer more common spaces and organized community services.
Years in operation
1 year in operation
A newer community that may feature more recent facilities and programs.
Walk Score
Walk Score: 40 / 100
Somewhat walkable. A few nearby services may be reachable on foot, but most trips require transportation.

Population served

Aged; Alzheimers

About this community

Occupancy

Occupancy rate
48%
In line with Michigan average
Occupied beds
49 / 103
Average residents 84 per day

License details

Facility type
Homes For The Aged
Status Regular
Issuance January 8, 2025
Expiration July 31, 2026
County: KENT

Additional licensing details

License number: AH410413805

Ownership & operating entity

Medilodge of Grand Rapids is legally operated by Grand Rapids Opco, LLC.

Safety & Compliance

Emergency Systems: Yes

Care Services

Nursing Services
Rehabilitation Services
Memory Care
Skilled Nursing
Licensed Nurses/CNAs

Amenities & Lifestyle

Outdoor Courtyard
Cable Tv
In-Room Free Cable Service
In-Room Phones (Arranged By Family)
Weekly Housekeeping Services
Forest Grove Kitchenettes
Therapeutic And Special Diets Accommodated
Restaurant Style Dining
Emergency Call System

Programs & Activities

Specific Programs
Assisted Living Housing Options, Assisted Living Services, Memory Care, Skilled Nursing

Dining & Nutrition

Food Description
Restaurant style dining with therapeutic and special diets accommodated.

Types of Care at Medilodge of Grand Rapids

Assisted Living Memory Care Skilled Nursing
Contact Medilodge of Grand Rapids

Inspection History

In Michigan, the Department of Licensing and Regulatory Affairs (LARA) conducts unannounced inspections and investigations to ensure long-term care facilities comply with state health codes.

7 visits/inspections

Michigan average: 5 visits/inspections

Latest inspection

Date June 4, 2025
Complaint Investigation

76 deficiencies

Deficiencies indicate regulatory issues. A higher number implies the facility had several areas requiring improvement.

Michigan average: 8 deficiencies

Health Inspection History

Inspections
Total health inspections 9

Michigan average 6.5


Last Health inspection on Jun 2025

Total health citations 68

Michigan average 33.5

Citations per inspection
7.56

Michigan average 5.18


Health citations are formal notices following inspections when they fail to comply with safety and care standards.

36 of 68 citations resulted from standard inspections; 27 of 68 resulted from complaint investigations; and 5 of 68 came from combined inspections (standard and complaint).

Breakdown of citation severity (last 3 years)
Critical Health citations More info 4
1233% worse than Michigan average

Michigan average: 0.3


Serious Health citations More info 2
5% worse than Michigan average

Michigan average: 1.9

4 critical citations More info Michigan average: 0.3

2 serious citations More info Michigan average: 1.9

62 moderate citations More info Michigan average: 30.8

0 minor citations More info Michigan average: 0.5
Citations history (last 3 years)
Administration moderate citation Info Issues related to how the facility is managed, including policies, procedures, and compliance with regulations. Jun 04, 2025
Corrected

Nursing Services moderate citation Info Issues related to the availability and quality of nursing staff and the care they provide. Jun 04, 2025
Corrected

Nutrition moderate citation Info Issues related to food quality, meal service, and resident's nutritional needs. Jun 04, 2025
Corrected

Quality of Care moderate citation Info Issues related to how well residents receive appropriate treatment and support for their medical and daily care needs. Jun 04, 2025
Corrected

Compare Memory Care around Grand Rapids The information below is reported by the Michigan Department of Licensing and Regulatory Affairs (LARA).

Filter by care type
Medilodge of Grand Rapids
AL

Assisted Living A licensed, long-term care setting for seniors or individuals with disabilities who need help with daily activities — like bathing, dressing, and medication management — but not 24-hour skilled nursing. Offers housing, meals, and around-the-clock support while aiming to maximize resident independence.

MC

Memory Care Secured, specialized care for people living with Alzheimer's or dementia. Staff trained in cognitive impairment, with higher staff-to-resident ratios and an environment designed to reduce confusion and wandering risk.

NH

Nursing Home Licensed facility providing 24/7 skilled nursing care for residents with complex, ongoing medical needs. Staffed by RNs, LPNs, and CNAs. Inspected and star-rated annually by CMS. Accepts Medicare (short-term rehab) and Medicaid (long-term care).

Grand Rapids (Northeast)
178
No
40
-
1
-
7
76
Grand Rapids Opco, Llc
White Lake Assisted Living & Memory Care
AL

Assisted Living A licensed, long-term care setting for seniors or individuals with disabilities who need help with daily activities — like bathing, dressing, and medication management — but not 24-hour skilled nursing. Offers housing, meals, and around-the-clock support while aiming to maximize resident independence.

IL

Independent Living Lifestyle-focused communities for older adults offering dining, activities, and transportation with minimal personal care. Best for active, independent seniors who want community without medical support.

MC

Memory Care Secured, specialized care for people living with Alzheimer's or dementia. Staff trained in cognitive impairment, with higher staff-to-resident ratios and an environment designed to reduce confusion and wandering risk.

Whitehall
64
Yes
8
-
1
-
4
2
6827 Whitehall Rd Opco Llc
Meadowlark Retirement Village
AL

Assisted Living A licensed, long-term care setting for seniors or individuals with disabilities who need help with daily activities — like bathing, dressing, and medication management — but not 24-hour skilled nursing. Offers housing, meals, and around-the-clock support while aiming to maximize resident independence.

IL

Independent Living Lifestyle-focused communities for older adults offering dining, activities, and transportation with minimal personal care. Best for active, independent seniors who want community without medical support.

MC

Memory Care Secured, specialized care for people living with Alzheimer's or dementia. Staff trained in cognitive impairment, with higher staff-to-resident ratios and an environment designed to reduce confusion and wandering risk.

Sparta
20
No
36
-
-
-
4
0
Porter Hills Presbyterian Village, Inc.
American House Kentwood
AL

Assisted Living A licensed, long-term care setting for seniors or individuals with disabilities who need help with daily activities — like bathing, dressing, and medication management — but not 24-hour skilled nursing. Offers housing, meals, and around-the-clock support while aiming to maximize resident independence.

HC

Home Care Professional care delivered in the person's own home — from companionship and errands to skilled nursing and therapy. Allows seniors to age in place. Medicare covers skilled home health when medically necessary.

MC

Memory Care Secured, specialized care for people living with Alzheimer's or dementia. Staff trained in cognitive impairment, with higher staff-to-resident ratios and an environment designed to reduce confusion and wandering risk.

RC

Respite Care Short-term temporary care — days to weeks — to give family caregivers a break. Full care provided during the stay. Often used after hospitalization or to trial a facility before a permanent placement decision.

Kentwood (Ridgebrook)
-
Yes
26
Studio / 1 Bed
-
A
0
0
-
Baruch Senior Ministries
IL

Independent Living Lifestyle-focused communities for older adults offering dining, activities, and transportation with minimal personal care. Best for active, independent seniors who want community without medical support.

MC

Memory Care Secured, specialized care for people living with Alzheimer's or dementia. Staff trained in cognitive impairment, with higher staff-to-resident ratios and an environment designed to reduce confusion and wandering risk.

RC

Respite Care Short-term temporary care — days to weeks — to give family caregivers a break. Full care provided during the stay. Often used after hospitalization or to trial a facility before a permanent placement decision.

Grand Rapids
-
No
30
-
-
-
0
0
-

Places of interest near Medilodge of Grand Rapids

Address 4 miles from city center — 1.18 miles to nearest hospital (Heart Failure & Transplant Services)

Address 2000 Leonard St NE, Grand Rapids, MI 49505

Calculate Travel Distance to Medilodge of Grand Rapids

Add your location

Address

Staffing Data (Q2 2025)

This data corresponds to Q2 2025 and is based on CMS Payroll-Based Journal.

Total staff 106
Employees 79
Contractors 27
Staff to resident ratio 2.16:1
23% better than Michigan average

Michigan average ratio: 1.75:1

Avg staff/day 33
Average shift 7.7 hours
0% compared with Michigan average

Michigan average: 7.9 hours

Total staff hours (quarter) 23,230
Nursing staff breakdown
Registered Nurse

Manages medical care and health needs.

Total count 7
Average shift length Info Average shift length. Calculated as total hours divided by days worked and average staff per day. 9.4 hours

No contractors work on this role.

Licensed Practical Nurse

Assists with medical care and medications.

Total count 13
Average shift length Info Average shift length. Calculated as total hours divided by days worked and average staff per day. 9.7 hours

No contractors work on this role.

Certified Nursing Assistant

Helps with daily care and mobility.

Total count 40
Average shift length Info Average shift length. Calculated as total hours divided by days worked and average staff per day. 7.9 hours

No contractors work on this role.

Contractor staffing

Total hours from contractors

11.5%

2,665 contractor hours this quarter

Respiratory Therapy Technician: 6 Physical Therapy Aide: 5 Physical Therapy Assistant: 4 Speech Language Pathologist: 4 Occupational Therapy Aide: 3 Qualified Social Worker: 2 Occupational Therapy Assistant: 2 Medical Director: 1
Staff by category
Certified Nursing Assistant4004010,32391100%7.9
Licensed Practical Nurse130132,75391100%9.7
Registered Nurse7072,47091100%9.4
RN Director of Nursing3031,4126470%7.9
Other Dietary Services Staff4049457785%7.2
Speech Language Pathologist0446306976%6
Clinical Nurse Specialist5056006774%5
Administrator2025846571%8
Qualified Social Worker0225326875%7.8
Dietitian1015206571%8
Mental Health Service Worker1015206571%8
Physical Therapy Assistant0444917279%6.6
Physical Therapy Aide0554766470%6.7
Nurse Practitioner1014245358%8
Respiratory Therapy Technician0662946167%4.6
Occupational Therapy Aide1341742730%5.4
Occupational Therapy Assistant022471516%3.1
Medical Director011302629%1.2
Medication Aide/Technician101511%5
40 Certified Nursing Assistant
% of Days 100%
13 Licensed Practical Nurse
% of Days 100%
7 Registered Nurse
% of Days 100%
3 RN Director of Nursing
% of Days 70%
4 Other Dietary Services Staff
% of Days 85%
4 Speech Language Pathologist
% of Days 76%
5 Clinical Nurse Specialist
% of Days 74%
2 Administrator
% of Days 71%
2 Qualified Social Worker
% of Days 75%
1 Dietitian
% of Days 71%
1 Mental Health Service Worker
% of Days 71%
4 Physical Therapy Assistant
% of Days 79%
5 Physical Therapy Aide
% of Days 70%
1 Nurse Practitioner
% of Days 58%
6 Respiratory Therapy Technician
% of Days 67%
4 Occupational Therapy Aide
% of Days 30%
2 Occupational Therapy Assistant
% of Days 16%
1 Medical Director
% of Days 29%
1 Medication Aide/Technician
% of Days 1%

Facility Characteristics

Source: CMS Long-Term Care Facility Characteristics (Data as of Jan 2026)

Total census
49 residents
Residents by payment source
Medicare
3 residents (6.1%)
Medicaid
35 residents (71.4%)
Private pay or other
11 residents (22.4%)
Programs & Services
Residents' Group

Residents meet regularly to discuss policies, care quality, and activities

Active Resident Council

Organized group of residents that meets regularly to discuss facility policies, quality of life, and activities.

Quality of care over time

These measures show how residents usually do over time at this home, based on health outcomes and preventive care.

High-risk clinical events score Info A composite score based on pressure ulcers, falls with injury, weight loss, walking ability decline, and activities of daily living decline. 7.5
11% better than Michigan average

Michigan average: 8.4

Functional decline score Info A composite score based on activities of daily living decline, walking ability decline, and incontinence. 11.6
29% better than Michigan average

Michigan average: 16.3

Long-stay resident measures
Significantly above average Michigan avg: 4.2 Info CMS star rating based on long-stay quality measure performance. 5 stars = significantly above average, 1 star = significantly below average.
Need for Help with Daily Activities Increased Info Percent of long-stay residents whose need for help with daily activities has increased 6.1%
51% better than Michigan average

Michigan average: 12.5%

Walking Ability Worsened Info Percent of long-stay residents whose ability to move independently worsened 9.5%
38% better than Michigan average

Michigan average: 15.3%

Low Risk Residents with Bowel/Bladder Incontinence Info Percent of low risk long-stay residents who lose control of their bowels or bladder 19.1%
9% better than Michigan average

Michigan average: 21.0%

Falls with Major Injury Info Percent of long-stay residents experiencing one or more falls with major injury 3.6%
15% worse than Michigan average

Michigan average: 3.2%

High Risk Residents with Pressure Ulcers Info Percent of long-stay high risk residents with pressure ulcers 6.8%
18% worse than Michigan average

Michigan average: 5.7%

Urinary Tract Infection Info Percent of long-stay residents with a urinary tract infection 0.6%
63% better than Michigan average

Michigan average: 1.7%

Lost Too Much Weight Info Percent of long-stay residents who lose too much weight 11.4%
102% worse than Michigan average

Michigan average: 5.7%

Depressive Symptoms Info Percent of long-stay residents who have depressive symptoms 0.8%
79% better than Michigan average

Michigan average: 3.9%

Antipsychotic Use Info Percent of long-stay residents who received an antipsychotic medication 5.0%
66% better than Michigan average

Michigan average: 15.0%

Pneumococcal Vaccine Info Percent of long-stay residents assessed and appropriately given the pneumococcal vaccine 98.2%
In line with Michigan average

Michigan average: 94.9%

Influenza Vaccine Info Percent of long-stay residents assessed and appropriately given the seasonal influenza vaccine 100.0%
5% better than Michigan average

Michigan average: 95.0%

Hospitalizations per 1,000 days Info Number of hospitalizations per 1,000 long-stay resident days. 2.69
55% worse than Michigan average

Michigan average: 1.74

ED visits per 1,000 days Info Number of outpatient emergency department visits per 1,000 long-stay resident days. 2.02
31% worse than Michigan average

Michigan average: 1.54

Short-stay resident measures
Below average Michigan avg: 3.1 Info CMS star rating based on short-stay quality measure performance. 5 stars = much above average, 1 star = much below average.
Pneumococcal Vaccine Info Percent of short-stay residents assessed and appropriately given the pneumococcal vaccine 88.5%
7% better than Michigan average

Michigan average: 82.5%

Antipsychotic medication increase Info Percent of short-stay residents who newly received an antipsychotic medication 2.0%
35% worse than Michigan average

Michigan average: 1.4%

Influenza Vaccine Info Percent of short-stay residents assessed and appropriately given the seasonal influenza vaccine 76.7%
In line with Michigan average

Michigan average: 79.5%

Re-hospitalized after SNF stay Info Percentage of short-stay residents who were re-hospitalized after their nursing home admission. 37.3%
54% worse than Michigan average

Michigan average: 24.2%

Emergency department visits Info Percentage of short-stay residents who had an outpatient emergency department visit. 10.8%
6% better than Michigan average

Michigan average: 11.5%

Falls with major injury Info Percentage of SNF residents who experience falls with major injury during their stay. 0.0%
100% better than Michigan average

Michigan average: 0.8%

Ability to care for self at discharge Info Percentage of residents at or above expected ability to care for themselves at discharge. 50.0%
7% worse than Michigan average

Michigan average: 53.7%

Successful return to home or community Info Rate of successful return to home or community from a skilled nursing facility. 31.9%
37% worse than Michigan average

Michigan average: 50.6%

Penalties and fines

Federal penalties imposed by CMS for regulatory violations, including civil money penalties (fines) and denials of payment for new Medicare/Medicaid admissions.

Source: CMS Penalties Database (Data as of Jan 2026)

Total fines amount $69K
10% lower than Michigan average

Michigan average: $76K

Number of fines 4
98% more fines than Michigan average

Michigan average: 2.0

Payment Denials Info Serious action where Medicare and/or Medicaid temporarily stops payments for new residents until issues are fixed. 0
100% fewer payment denials than Michigan average

Michigan average: 0.8

Fines amount comparison
This facility $69K
Michigan average $76K
Penalty History

Penalties are imposed by CMS for violations of federal nursing home regulations.

Civil Money Penalty Info Fines imposed for noncompliance, which can be assessed per day or per instance of violation. Jan 6, 2025
$17K
Civil Money Penalty Info Fines imposed for noncompliance, which can be assessed per day or per instance of violation. Jan 6, 2025
$26K
Civil Money Penalty Info Fines imposed for noncompliance, which can be assessed per day or per instance of violation. Aug 29, 2023
$15K
Civil Money Penalty Info Fines imposed for noncompliance, which can be assessed per day or per instance of violation. Mar 1, 2023
$11K

Last updated: Jan 2026

Guides for Better Senior Living

Care Cost Calculator: See Prices in Your Area

Nursing Home Data Explorer

Don’t Wait Too Long: 7 Red Flag Signs Your Parent Needs Assisted Living Now

The True Cost of Assisted Living in 2025 – And How Families Are Paying For It

Understanding Senior Living Costs: Pricing Models, Discounts & Financial Assistance

Financial Aid for Michigan Seniors

Get financial aid guidance

MI Choice Waiver

Michigan Medicaid MI Choice Waiver

Age 65+ or disabled, Michigan resident, Medicaid- eligible, nursing home-level care need.

~$2,829/month (300% FBR, individual).

$2,000 (individual), $3,000 (couple).

Delivered through regional waiver agents; waitlists possible.

Home Help Program

Michigan Home Help

Age 65+ or disabled, Michigan resident, Medicaid- eligible or low-income.

~$1,732/month (individual, Medicaid threshold).

$2,000 (individual).

Can hire family caregivers; less intensive than waiver.

Program of All-Inclusive Care for the Elderly (PACE)

Michigan PACE

Age 55+, Michigan resident, nursing home-level care need, safe with PACE support.

~$2,829/month (Medicaid-eligible); private pay option available.

$2,000 (individual), $3,000 (couple).

16 PACE centers (e.g., Ingham, Wayne counties); expanding slowly.

Medicare Savings Program (MSP)

Michigan Medicare Savings Program

Age 65+ or disabled, Michigan resident, Medicare Part A/B.

~$2,510/month (QMB), ~$3,380/month (SLMB), ~$3,598/month (QI)—individual.

$9,430 (individual), $14,130 (couple).

Three tiers; no waitlist; includes Extra Help for Part D.

National Family Caregiver Support Program (NFCSP) Respite

Michigan NFCSP Respite Care

Caregivers of 60+ needing care or 55+ caregivers of others; Michigan resident; functional needs (2+ ADLs).

Prioritizes ~$24,980/year (individual); no strict cap.

Not assessed; need-based.

16 AAAs; prioritizes low-income, rural caregivers.

Senior Community Service Employment Program (SCSEP)

Michigan SCSEP

Age 55+, unemployed, low-income, Michigan resident.

~$1,983/month (125% FPL).

Not specified; income-focused.

Priority for veterans, rural residents; Operation ABLE partnership.

VA Aid and Attendance (A&A) and Housebound Benefits

Michigan VA Aid and Attendance/Housebound

Age 65+ or disabled veteran/spouse, Michigan resident, wartime service, need for ADL help (A&A) or homebound.

Net income < ~$1,984/month (veteran with dependent, A&A); pension offsets income.

~$155,356 (net worth limit).

High veteran demand in urban/rural areas.

Tour Icon
Planning a tour? Check our touring checklist.
Chat Icon
Thinking of living here? We can help you speak to a current resident