

Occupancy rate
51%
Indiana average: 69%

We arrange tours, appointments, and even moving support so you don’t have to


 Official CMS rating based on health inspections, staffing and quality measures.
Official CMS rating based on deficiencies found during state health inspections.
Official CMS rating based on nurse staffing hours per resident per day.
Official CMS rating based on clinical outcomes for residents.
Average daily nursing hours per resident (adjusted for acuity). Higher values indicate more nursing time per resident.
Official CMS rating based on health inspections, staffing and quality measures.
Official CMS rating based on deficiencies found during state health inspections.
Official CMS rating based on nurse staffing hours per resident per day.
Official CMS rating based on clinical outcomes for residents.
Average daily nursing hours per resident (adjusted for acuity). Higher values indicate more nursing time per resident.
Offers a balance of services and community atmosphere.
Lower occupancy suggests more openings may be available.
This home supports both short-term rehab and long-term care, with residents staying for a wide range of durations.
32% of new residents, usually for short-term rehab.
55% of new residents, often for short stays.
13% of new residents, often for long-term daily care.
The portion of the home's budget spent on staff, including nurses, caregivers, and other employees who support care and operations.
All remaining costs needed to run the home, such as food, utilities, building maintenance, supplies and administrative expenses.
Indiana average: 69%
Miller’s Merry Manor is administrated by RAYNE WISE.
Key information about the people who lead and staff this community.
Ways to qualify for care at this community, including accepted programs and payment options.
This facility is certified for eligible Medicare services.
In Indiana, the Department of Health, Division of Long Term Care is the primary regulatory body that performs onsite inspections and quality of care reviews for all licensed facilities.
4 with citations
0 without citations
Indiana average: 8 complaint visits
Indiana average: 3 inspections with citations
Formal expressions of dissatisfaction or concern made by residents, or their families regarding various aspects of the care, services, and environment provided.
Indiana average: 4 complaints
Citations indicate regulatory violations. A higher number implies the facility had several areas requiring improvement.
Indiana average: 26 citations
Deficiencies indicate regulatory issues. A higher number implies the facility had several areas requiring improvement.
The most recent inspection on July 2, 2025, was a complaint investigation and found no deficiencies related to the allegations. Earlier inspections showed a pattern of Life Safety Code deficiencies, including blocked exit doors, propped open smoke barrier doors, and issues with hazardous storage room doors, but immediate corrective actions were taken and ongoing monitoring was planned. Prior reports also noted care planning, infection control, and medication management issues, along with some deficiencies in emergency preparedness and staff vaccination compliance, though no fines or enforcement actions were listed in the available reports. Complaint investigations were generally unsubstantiated, with no substantiated complaints reported. The facility appears to have addressed many prior deficiencies, as recent inspections have shown improvement in compliance with Life Safety Code and care standards.
Indiana average 6
Last Health inspection on Oct 2025
Health citations are formal notices following inspections when they fail to comply with safety and care standards.
21 of 25 citations resulted from standard inspections; and 4 of 25 resulted from complaint investigations.
Indiana average: 0.2
Indiana average: 0.6
Data sourced from CMS Health Deficiencies reports. Citation severity codes range from A (least serious) to L (most serious). Immediate Jeopardy (J-L) citations indicate situations where the facility's noncompliance has placed residents at risk of death or serious harm.
Nursing Home 24/7 care needed
Assisted Living For seniors needing help with daily tasks but not full-time nursing.
Nursing Home 24/7 care needed
Assisted Living For seniors needing help with daily tasks but not full-time nursing.
Nursing Home 24/7 care needed
Assisted Living For seniors needing help with daily tasks but not full-time nursing.
Nursing Home 24/7 care needed
Assisted Living For seniors needing help with daily tasks but not full-time nursing.
Nursing Home 24/7 care needed
Assisted Living For seniors needing help with daily tasks but not full-time nursing.
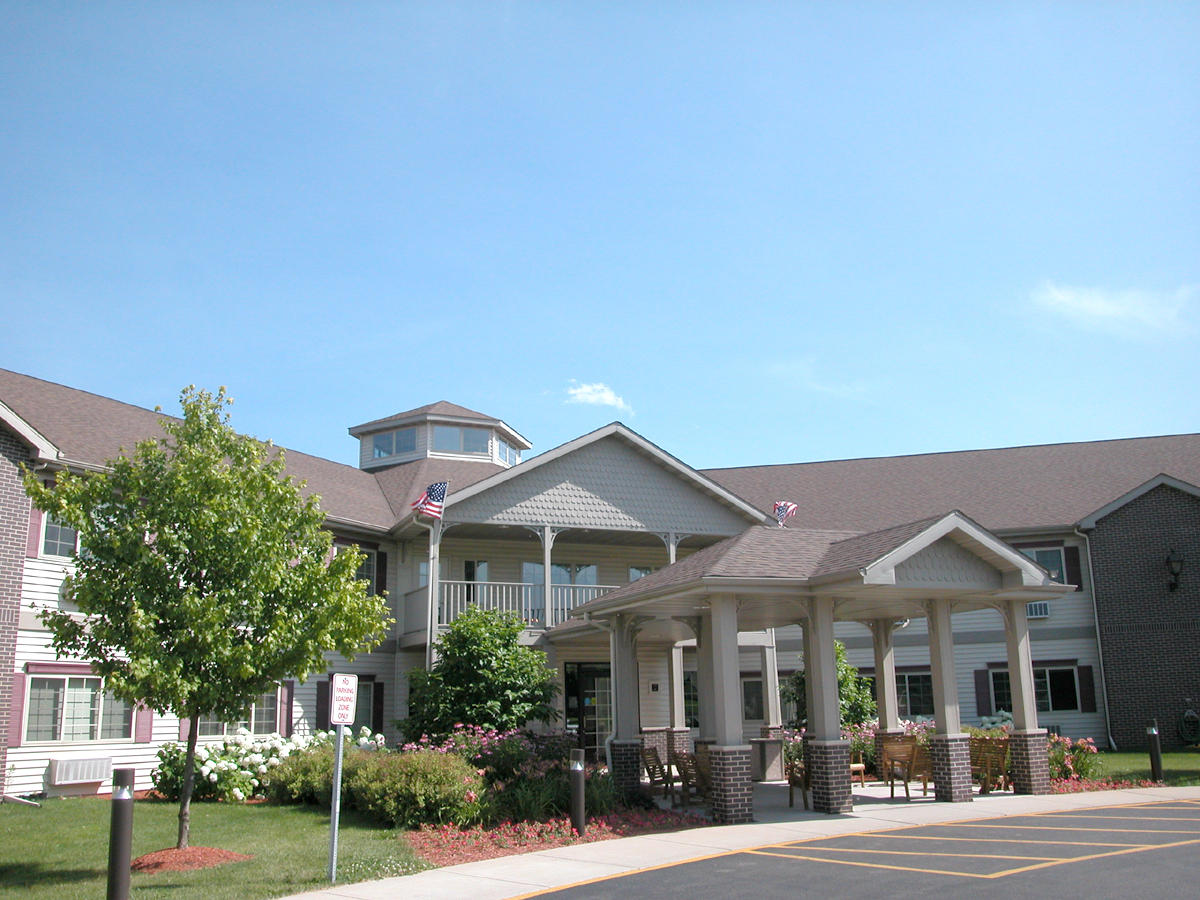
 Miller’s Merry Manor
  Albany Health Care & Rehabilitation Center
![]() 0.0 miles from city center
0.0 miles from city center
![]() WALKERTON, IN 46574
WALKERTON, IN 46574
Add your location
Source: CMS Payroll-Based Journal (Q2 2025)
| Role ⓘ | Count ⓘ | Avg Shift (hrs) ⓘ | Uses Contractors? ⓘ |
|---|---|---|---|
| Registered Nurse | 13 | 7.5 | Yes |
| Licensed Practical Nurse | 18 | 8.2 | Yes |
| Certified Nursing Assistant | 43 | 7.5 | Yes |
| Role ⓘ | Employees ⓘ | Contractors ⓘ | Total Staff ⓘ | Total Hours ⓘ | Days Worked ⓘ | % of Days ⓘ | Avg Shift (hrs) ⓘ |
|---|---|---|---|---|---|---|---|
| Certified Nursing Assistant | 39 | 4 | 43 | 10,038 | 91 | 100% | 7.5 |
| Licensed Practical Nurse | 9 | 9 | 18 | 2,293 | 91 | 100% | 8.2 |
| Registered Nurse | 4 | 9 | 13 | 1,385 | 85 | 93% | 7.5 |
| Clinical Nurse Specialist | 4 | 0 | 4 | 943 | 72 | 79% | 7.2 |
| Dental Services Staff | 4 | 0 | 4 | 874 | 74 | 81% | 7.8 |
| Other Dietary Services Staff | 4 | 0 | 4 | 832 | 90 | 99% | 5.8 |
| Speech Language Pathologist | 0 | 2 | 2 | 523 | 67 | 74% | 7.1 |
| Physical Therapy Aide | 0 | 6 | 6 | 511 | 67 | 74% | 6.5 |
| Administrator | 1 | 0 | 1 | 484 | 61 | 67% | 7.9 |
| Nurse Practitioner | 1 | 0 | 1 | 472 | 59 | 65% | 8 |
| Medication Aide/Technician | 0 | 6 | 6 | 327 | 31 | 34% | 8 |
| RN Director of Nursing | 2 | 0 | 2 | 279 | 41 | 45% | 6.8 |
| Qualified Social Worker | 0 | 2 | 2 | 92 | 48 | 53% | 1.9 |
| Respiratory Therapy Technician | 0 | 2 | 2 | 84 | 37 | 41% | 2.2 |
| Physical Therapy Assistant | 0 | 1 | 1 | 67 | 50 | 55% | 1.3 |
| Occupational Therapy Assistant | 0 | 1 | 1 | 24 | 9 | 10% | 2.6 |
Source: CMS Long-Term Care Facility Characteristics (Data as of Jan 2026)
Residents meet regularly to discuss policies, care quality, and activities
State-approved Nurse Aide Training and Competency Evaluation Program on-site
Organized group of residents that meets regularly to discuss facility policies, quality of life, and activities.
Data sourced from CMS Long-Term Care Facility Characteristics quarterly report. Payer mix reflects the current resident census by primary payment source.
These measures show how residents usually do over time at this home, based on health outcomes and preventive care.
Indiana average: 8.0
Indiana average: 17.1
Indiana average: 12.0%
Indiana average: 14.4%
Indiana average: 24.6%
Indiana average: 3.9%
Indiana average: 4.4%
Indiana average: 1.2%
Indiana average: 5.7%
Indiana average: 24.1%
Indiana average: 12.4%
Indiana average: 93.7%
Indiana average: 95.4%
Indiana average: 81.7%
Indiana average: 1.4%
Indiana average: 79.0%
Quality measures are calculated from Minimum Data Set (MDS) assessments. For most measures, lower percentages indicate better care quality.
Historical financial and operational data for Miller’s Merry Manor based on CMS SNF Cost Reports.
Loading trend charts...
Care Cost Calculator: See Prices in Your Area
Nursing Home Data Explorer
Don’t Wait Too Long: 7 Red Flag Signs Your Parent Needs Assisted Living Now
The True Cost of Assisted Living in 2025 – And How Families Are Paying For It
Understanding Senior Living Costs: Pricing Models, Discounts & Financial Assistance

Touring a community? Use this expert-backed checklist to stay organized, ask the right questions, and find the perfect fit.
We'll send you a PDF version of the touring checklist.


