Explore Open Rooms

1 Contact details
2 What type of senior care service are you looking for?
3 What budget do you have in mind for senior care?
4 How soon do you need to find care?
5 Additional details

Thank you for your interest!

Our team will be in touch shortly to help with next steps.

Memory Care Home

Mulberry Manor

Memory Care Home

Mulberry Manor

1670 W Lingleville Rd, Stephenville, TX 76401 View map
Overview of Mulberry Manor

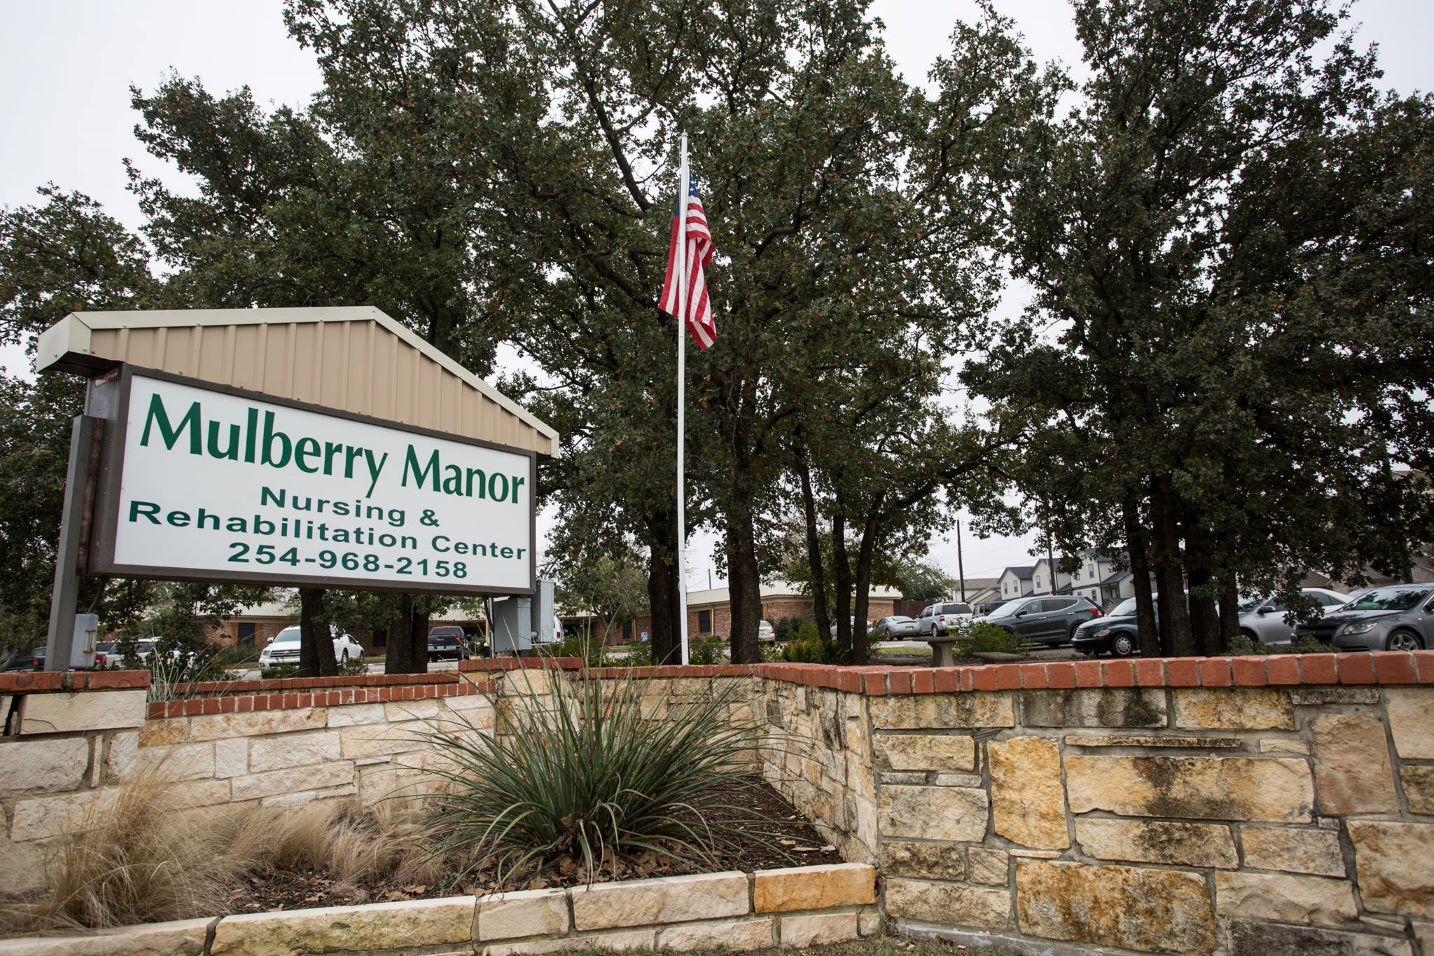
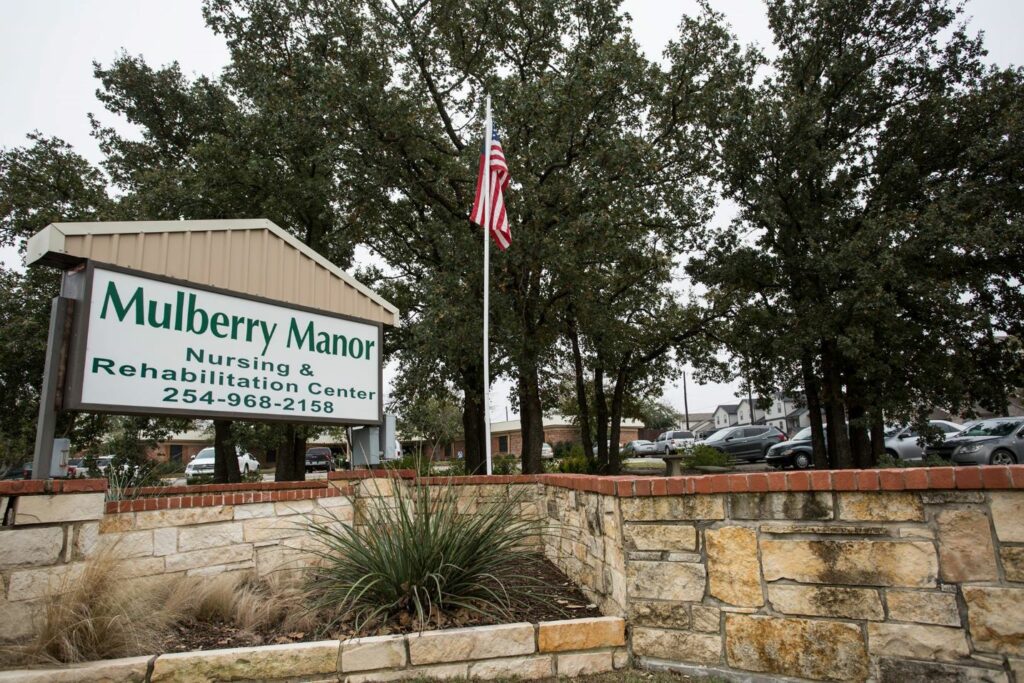
Set within the quiet neighborhood of Stephenville, TX, Mulberry Manor is a dependable senior living community, offering excellent care services, including assisted living and memory care services. The community also caters to the needs of those who are recovering from illnesses or hospitalization with skilled nursing, short-term rehabilitation, and long-term care services. Apart from having 24-hour nurses, residents find comfort in having emergency response systems installed in their cozy accommodations for quick assistance during emergencies.

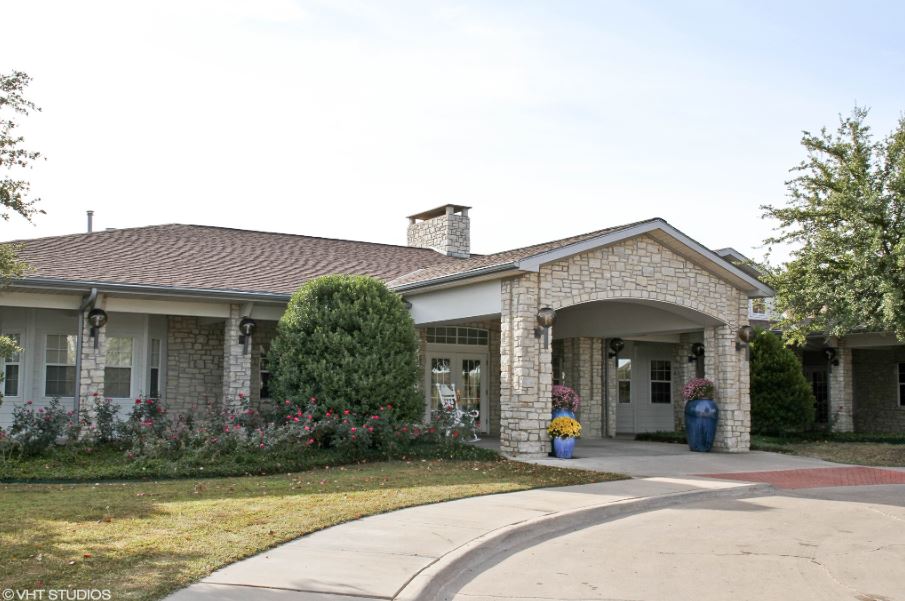
A full-time Certified Activity Director is available to plan vibrant and enriching activities and monthly outings for residents’ fun and enjoyment. Delicious meals and a long-list of thoughtful amenities are also offered for a well-rounded living experience. At Mulberry Manor, residents are guaranteed to enjoy the lifestyle they deserve without the need to move into another community for their ever-changing needs.

(512) 640-7977

Quality ratings

Measured by Centers for Medicare & Medicaid Services (CMS)

Overall rating Info The Overall CMS Rating combines results from health inspections, staffing levels and quality measures. Health inspections carry the most weight. Staffing and quality scores can increase or decrease the final rating based on performance compared to state and national standards.
3/5
Texas average: 3.0/5
Health Inspection Info Based on the results of the facility's three most recent standard inspections and any complaint investigations. CMS reviews the number, scope, and severity of deficiencies, with more recent findings weighted more heavily.
2/5
Texas average: 2.9/5
Staffing Info Measures average nursing staff hours per resident per day, including Registered Nurses (RNs) and total nursing staff. Ratings are adjusted based on the level of care residents require and are compared to state and national benchmarks.
2/5
Texas average: 2.4/5
Quality Measures Info Based on clinical and physical health indicators reported to CMS, such as hospital readmissions, falls, pressure ulcers, and improvements in mobility. These measures reflect how well residents' health needs are being managed.
5/5
Texas average: 4.0/5

Nursing care per resident

Info This shows how many total hours of nursing staff time are available per resident each day. Higher numbers usually mean more staff support.
3h 52m per day

This home provides 2% more nursing time per resident than the Texas average.

Texas average: 3h 46m per day

Capacity and availability

Medium-capacity home

Offers a balance of services and community atmosphere.

Total beds 102

This home usually has availability

Lower occupancy suggests more openings may be available.

Lower demand than the Texas average
Occupancy rate 67.6%
Residents per day (avg) 66
Occupancy rate
67.6%
Residents per day (avg)
66

Who this home usually serves

TYPE OF STAY

Mostly long-term care residents

Most residents stay for extended periods and receive ongoing daily care.

Might be optimal for
Long-term daily care Ongoing support needs

Breakdown by payment type

Medicare

33% of new residents, usually for short-term rehab.

Typical stay 2 - 3 months

Private pay

15% of new residents, often for short stays.

Typical stay 5 - 6 months

Medicaid

51% of new residents, often for long-term daily care.

Typical stay 9 - 10 months

Finances and operations

Governmental community
Operated by state authorities.
Home revenue
$8.2M
Surplus of revenue
$2.4M
Governmental community Operated by state authorities.
Home revenue
$8,194,922.00
Surplus of revenue
$2,389,170.00
Payroll costs Info The portion of the home's budget spent on staff, including nurses, caregivers, and other employees who support care and operations.
$2.5M
30.3% of revenue
Other operating costs Info All remaining costs needed to run the home, such as food, utilities, building maintenance, supplies and administrative expenses.
$3.3M
Total costs $5.8M
Years in operation
44 years in operation
A longer operating history, which may indicate experience navigating regulations and delivering ongoing care.
Walk Score
Walk Score: 37 / 100
Somewhat walkable. A few nearby services may be reachable on foot, but most trips require transportation.

Additional licensing details

CMS Certification Number: 455744

Staffing

Key information about the people who lead and staff this community.

Leadership

Contact: Business Manager/Owner

Care Services

Alzheimer's Certification

What does this home offer?

Accepts Medicaid icon

Accept Medicaid: Yes

Total residents icon

Total Residents: 102

Building type icon
Building type icon

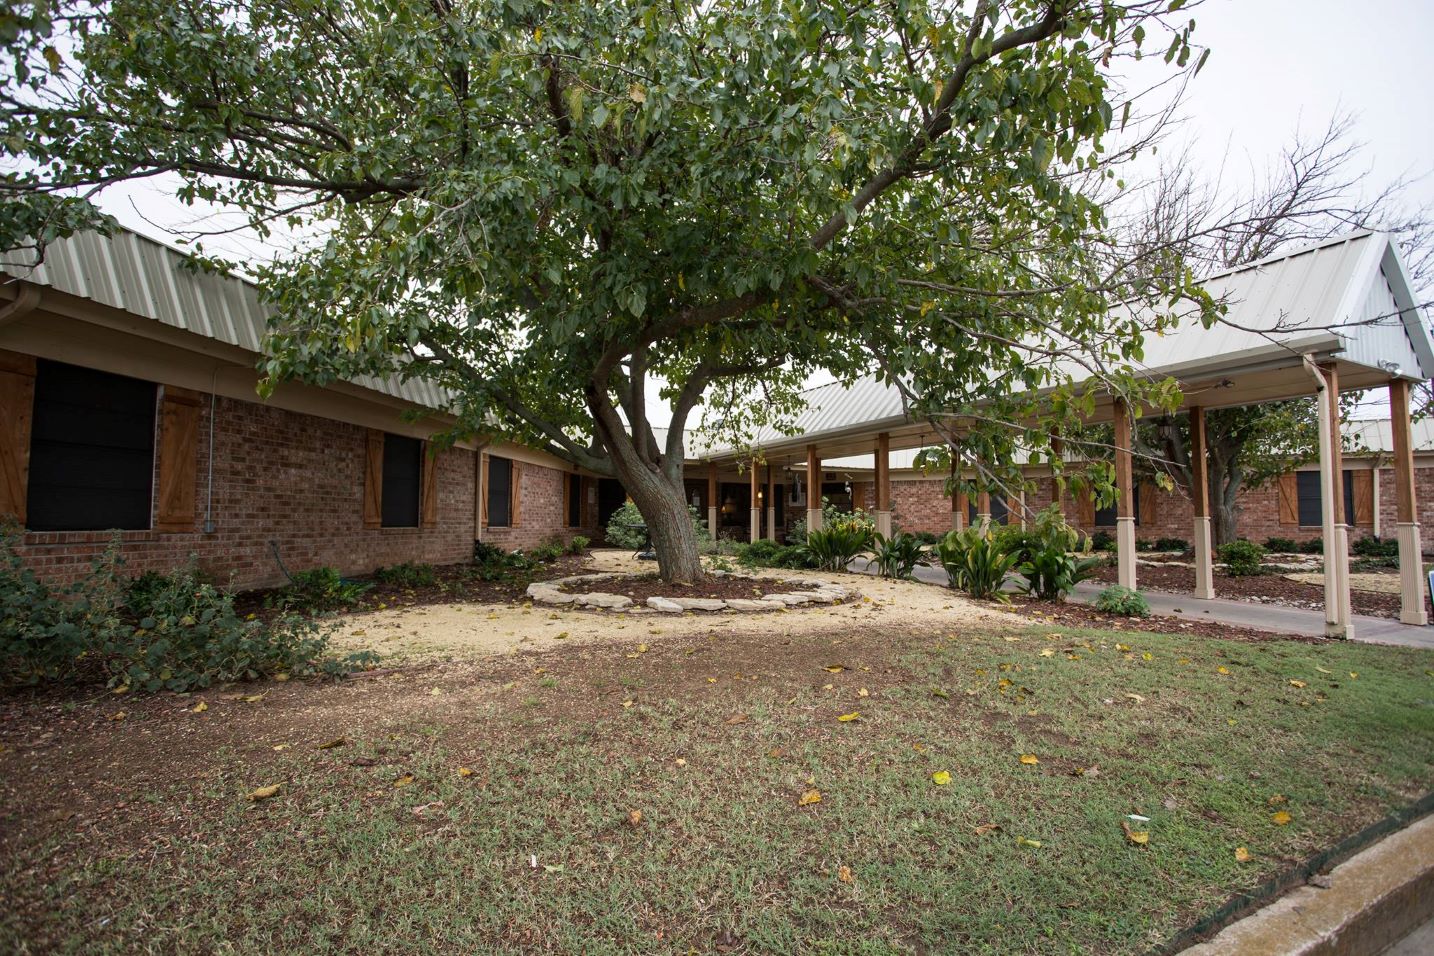
Building Type: Single-story

Types of Care at Mulberry Manor

Assisted Living Memory Care Nursing Home
Contact Mulberry Manor

Inspection History

In Texas, the Health and Human Services Commission (HHSC) is the primary regulatory body that conducts unannounced inspections and publishes quality reports for all long-term care homes.

7 visits/inspections

4 visits/inspections triggered by complaints

Results

7 with issues

0 without issues

Latest inspection

Date:July 24, 2025
Type:Annual Inspection

30 deficiencies

Deficiencies indicate regulatory issues. A higher number implies the facility had several areas requiring improvement.

Health Inspection History

Inspections
Total health inspections 7

Texas average 7.4


Last Health inspection on Jul 2025

Total health citations 30

Texas average 25.9

Citations per inspection
4.29

Texas average 3.67


Health citations are formal notices following inspections when they fail to comply with safety and care standards.

18 of 30 citations resulted from standard inspections; and 12 of 30 resulted from complaint investigations.

Breakdown of citation severity (last 3 years)
Critical Health citations More info 2
In line with Texas average

Texas average: 2


Serious Health citations More info 0
100% better than Texas average

Texas average: 0.4

2 critical citations More info Texas average: 2

0 serious citations More info Texas average: 0.4

28 moderate citations More info Texas average: 23

0 minor citations More info Texas average: 0.4
Citations history (last 3 years)
Administration moderate citation Info Issues related to how the facility is managed, including policies, procedures, and compliance with regulations. Jul 24, 2025
Corrected

Care Planning moderate citation Info Issues related to creating and updating personalized care plans for residents based on their needs and conditions. Jul 24, 2025
Corrected

Infection Control moderate citation Info Issues related to preventing and controlling infections, including hygiene practices and safety protocols. Apr 09, 2025
Corrected

Abuse/Neglect moderate citation Info Issues related to protecting resident's from harm, including abuse, neglect, or mistreatment. Jul 23, 2024
Corrected

Compare Assisted Living around Stephenville The information below is reported by the Texas Health and Human Services Commission.

Mulberry Manor
AL

Assisted Living A licensed, long-term care setting for seniors or individuals with disabilities who need help with daily activities — like bathing, dressing, and medication management — but not 24-hour skilled nursing. Offers housing, meals, and around-the-clock support while aiming to maximize resident independence.

IL

Independent Living Lifestyle-focused communities for older adults offering dining, activities, and transportation with minimal personal care. Best for active, independent seniors who want community without medical support.

MC

Memory Care Secured, specialized care for people living with Alzheimer's or dementia. Staff trained in cognitive impairment, with higher staff-to-resident ratios and an environment designed to reduce confusion and wandering risk.

NH

Nursing Home Licensed facility providing 24/7 skilled nursing care for residents with complex, ongoing medical needs. Staffed by RNs, LPNs, and CNAs. Inspected and star-rated annually by CMS. Accepts Medicare (short-term rehab) and Medicaid (long-term care).

Stephenville
102
-
37
44
-
-
-
-
-
Good Tree
AL

Assisted Living A licensed, long-term care setting for seniors or individuals with disabilities who need help with daily activities — like bathing, dressing, and medication management — but not 24-hour skilled nursing. Offers housing, meals, and around-the-clock support while aiming to maximize resident independence.

IL

Independent Living Lifestyle-focused communities for older adults offering dining, activities, and transportation with minimal personal care. Best for active, independent seniors who want community without medical support.

MC

Memory Care Secured, specialized care for people living with Alzheimer's or dementia. Staff trained in cognitive impairment, with higher staff-to-resident ratios and an environment designed to reduce confusion and wandering risk.

RC

Respite Care Short-term temporary care — days to weeks — to give family caregivers a break. Full care provided during the stay. Often used after hospitalization or to trial a facility before a permanent placement decision.

Stephenville
65
-
21
-
CSL CE STEPHENVILLE LLC
7
1
6
-

Places of interest near Mulberry Manor

Address 2.1 miles from city center

Address 1670 W Lingleville Rd, Stephenville, TX 76401

Calculate Travel Distance to Mulberry Manor

Add your location

Address

Staffing Data (Q2 2025)

This data corresponds to Q2 2025 and is based on CMS Payroll-Based Journal.

Total staff 188
Employees 80
Contractors 108
Staff to resident ratio 2.44:1
62% better than Texas average

Texas average ratio: 1.51:1

Avg staff/day 31
Average shift 8.2 hours
0% compared with Texas average

Texas average: 8.1 hours

Total staff hours (quarter) 23,187
Nursing staff breakdown
Registered Nurse

Manages medical care and health needs.

Total count 9
Average shift length Info Average shift length. Calculated as total hours divided by days worked and average staff per day. 9.2 hours

No contractors work on this role.

Licensed Practical Nurse

Assists with medical care and medications.

Total count 56
Average shift length Info Average shift length. Calculated as total hours divided by days worked and average staff per day. 9 hours

This role is partially covered by contractors.

Certified Nursing Assistant

Helps with daily care and mobility.

Total count 80
Average shift length Info Average shift length. Calculated as total hours divided by days worked and average staff per day. 8.4 hours

This role is partially covered by contractors.

Contractor staffing

Total hours from contractors

22.5%

5,217 contractor hours this quarter

Licensed Practical Nurse: 48 Certified Nursing Assistant: 43 Physical Therapy Aide: 5 Speech Language Pathologist: 4 Respiratory Therapy Technician: 3 Physical Therapy Assistant: 1 Qualified Social Worker: 1 Occupational Therapy Aide: 1 Medical Director: 1 Occupational Therapy Assistant: 1
Staff by category
Certified Nursing Assistant37438011,14991100%8.4
Licensed Practical Nurse848563,88791100%9
Nurse Aide in Training8082,2589099%8.7
Physical Therapy Aide0551,3367077%7.1
Registered Nurse9091,0438391%9.2
Nurse Practitioner4045456066%8
Dietitian2025356268%7
RN Director of Nursing3034555257%8.4
Clinical Nurse Specialist4044373741%9.9
Administrator3034245358%8
Qualified Social Worker0113076571%4.7
Speech Language Pathologist0442774954%5.1
Other Dietary Services Staff1011893134%6.1
Respiratory Therapy Technician0331273134%4.1
Mental Health Service Worker1011252123%5.9
Physical Therapy Assistant011392730%1.4
Occupational Therapy Aide01133910%3.7
Occupational Therapy Assistant0111722%8.5
Medical Director011667%1
80 Certified Nursing Assistant
% of Days 100%
56 Licensed Practical Nurse
% of Days 100%
8 Nurse Aide in Training
% of Days 99%
5 Physical Therapy Aide
% of Days 77%
9 Registered Nurse
% of Days 91%
4 Nurse Practitioner
% of Days 66%
2 Dietitian
% of Days 68%
3 RN Director of Nursing
% of Days 57%
4 Clinical Nurse Specialist
% of Days 41%
3 Administrator
% of Days 58%
1 Qualified Social Worker
% of Days 71%
4 Speech Language Pathologist
% of Days 54%
1 Other Dietary Services Staff
% of Days 34%
3 Respiratory Therapy Technician
% of Days 34%
1 Mental Health Service Worker
% of Days 23%
1 Physical Therapy Assistant
% of Days 30%
1 Occupational Therapy Aide
% of Days 10%
1 Occupational Therapy Assistant
% of Days 2%
1 Medical Director
% of Days 7%

Facility Characteristics

Source: CMS Long-Term Care Facility Characteristics (Data as of Jan 2026)

Total census
77 residents
Residents by payment source
Medicare
3 residents (3.9%)
Medicaid
64 residents (83.1%)
Private pay or other
10 residents (13%)
Programs & Services
Residents' Group

Residents meet regularly to discuss policies, care quality, and activities

Active Resident Council

Organized group of residents that meets regularly to discuss facility policies, quality of life, and activities.

Quality of care over time

These measures show how residents usually do over time at this home, based on health outcomes and preventive care.

High-risk clinical events score Info A composite score based on pressure ulcers, falls with injury, weight loss, walking ability decline, and activities of daily living decline. 4.4
49% better than Texas average

Texas average: 8.6

Functional decline score Info A composite score based on activities of daily living decline, walking ability decline, and incontinence. 7.6
53% better than Texas average

Texas average: 16.0

Long-stay resident measures
Need for Help with Daily Activities Increased Info Percent of long-stay residents whose need for help with daily activities has increased 13.1%
19% better than Texas average

Texas average: 16.2%

Walking Ability Worsened Info Percent of long-stay residents whose ability to move independently worsened 1.2%
93% better than Texas average

Texas average: 16.2%

Low Risk Residents with Bowel/Bladder Incontinence Info Percent of low risk long-stay residents who lose control of their bowels or bladder 8.5%
46% better than Texas average

Texas average: 15.7%

Falls with Major Injury Info Percent of long-stay residents experiencing one or more falls with major injury 2.5%
22% better than Texas average

Texas average: 3.2%

High Risk Residents with Pressure Ulcers Info Percent of long-stay high risk residents with pressure ulcers 2.9%
36% better than Texas average

Texas average: 4.4%

Urinary Tract Infection Info Percent of long-stay residents with a urinary tract infection 0.0%
100% better than Texas average

Texas average: 0.8%

Lost Too Much Weight Info Percent of long-stay residents who lose too much weight 2.1%
39% better than Texas average

Texas average: 3.5%

Depressive Symptoms Info Percent of long-stay residents who have depressive symptoms 1.5%
46% better than Texas average

Texas average: 2.9%

Antipsychotic Use Info Percent of long-stay residents who received an antipsychotic medication 5.1%
35% better than Texas average

Texas average: 7.9%

Pneumococcal Vaccine Info Percent of long-stay residents assessed and appropriately given the pneumococcal vaccine 93.9%
In line with Texas average

Texas average: 97.3%

Influenza Vaccine Info Percent of long-stay residents assessed and appropriately given the seasonal influenza vaccine 100.0%
In line with Texas average

Texas average: 97.9%

Short-stay resident measures
Pneumococcal Vaccine Info Percent of short-stay residents assessed and appropriately given the pneumococcal vaccine 85.1%
6% worse than Texas average

Texas average: 90.4%

Penalties and fines

Federal penalties imposed by CMS for regulatory violations, including civil money penalties (fines) and denials of payment for new Medicare/Medicaid admissions.

Source: CMS Penalties Database (Data as of Jan 2026)

Total fines amount $205K
154% higher than Texas average

Texas average: $80K

Number of fines 1
60% fewer fines than Texas average

Texas average: 2.5

Payment Denials Info Serious action where Medicare and/or Medicaid temporarily stops payments for new residents until issues are fixed. 1
354% more payment denials than Texas average

Texas average: 0.2

Fines amount comparison
This facility $205K
Texas average $80K
Penalty History

Penalties are imposed by CMS for violations of federal nursing home regulations.

Civil Money Penalty Info Fines imposed for noncompliance, which can be assessed per day or per instance of violation. Jun 14, 2024
$205K
Payment Denial Info Serious action where Medicare and/or Medicaid temporarily stops payments for new residents until issues are fixed. Jun 14, 2024
15 days

Last updated: Jan 2026

Guides for Better Senior Living

Care Cost Calculator: See Prices in Your Area

Nursing Home Data Explorer

Don’t Wait Too Long: 7 Red Flag Signs Your Parent Needs Assisted Living Now

The True Cost of Assisted Living in 2025 – And How Families Are Paying For It

Understanding Senior Living Costs: Pricing Models, Discounts & Financial Assistance

Financial Aid for Texas Seniors

Get financial aid guidance

Community Care for the Aged and Disabled (CCAD)

TX Medicaid CCAD

Age 65+ or disabled, Texas resident, Medicaid-eligible, care need (not always nursing home level).

~$2,829/month (300% FBR, individual).

$2,000 (individual), $3,000 (couple).

Large state; rural access challenges.

Texas Community Care Services

TX CCS

Age 60+, Texas resident, at risk of decline.

~$2,000/month (individual, varies).

$5,000 (individual).

Limited funding; high demand in urban areas.

Area Agency on Aging (AAA) Services

Texas AAA Services

Age 60+, TX resident; no income/asset limits.

None; donations encouraged.

Not assessed.

28 AAAs; includes Meals on Wheels in some areas.

Medicare Savings Program (MSP)

Texas Medicare Savings Program

Age 65+ or disabled, TX resident, Medicare Part A/B.

~$2,510/month (QMB), ~$3,380/month (SLMB), ~$3,598/month (QI)—individual.

$9,430 (individual), $14,130 (couple).

Includes Extra Help for Part D; no waitlist.

Low-Income Home Energy Assistance Program (LIHEAP)

Texas Comprehensive Energy Assistance Program (CEAP)

Age 60+ prioritized, TX resident, low-income.

~$3,970/month (185% FPL).

Not assessed.

Priority for elderly/disabled; covers gas, electric, propane.

Family Caregiver Support Program (FCSP)

Texas Family Caregiver Support Program

Caregivers of 60+ needing care or 55+ caregivers of others; TX resident; 2+ ADLs.

No strict cap; prioritizes low-income (~$24,980/year).

Not assessed.

High rural demand; includes grandparent caregivers.

Senior Community Service Employment Program (SCSEP)

Texas SCSEP

Age 55+, unemployed, low-income, TX resident.

~$1,983/month (125% FPL).

Not specified.

Priority for veterans, rural residents; AARP partnership.

VA Aid and Attendance (A&A) and Housebound Benefits

Texas VA Aid and Attendance/Housebound

Age 65+ or disabled veteran/spouse, TX resident, wartime service, ADL help (A&A) or homebound.

Net income < ~$1,984/month (veteran with dependent, A&A); pension offsets income.

~$155,356 (net worth).

High veteran population; supports rural/urban needs.

Property Tax Exemption for Seniors

Texas Senior Property Tax Exemption

Age 65+, TX resident, homeowner (homestead).

None; tax-based eligibility.

Not assessed.

$25,000+ exemption; optional freeze in some counties; saves ~$500-$1,000/year.

Senior Farmers’ Market Nutrition Program (SFMNP)

Texas SFMNP

Age 60+, TX resident, low-income.

~$2,322/month (185% FPL).

Not assessed.

Vouchers (~$50/season); serves ~20,000 via 28 AAAs.

Tour Icon
Planning a tour? Check our touring checklist.
Chat Icon
Thinking of living here? We can help you speak to a current resident