Mulberry Manor
Memory Care, Assisted Living & Nursing Home · Stephenville, TX
CMS overall rating Info The Overall CMS Rating is scored from 1 to 5 stars and combines results from health inspections, staffing levels, and quality measures. Health inspections carry the most weight. Staffing and quality scores can increase or decrease the final rating based on performance compared to state and national standards.

Mulberry Manor

Memory Care, Assisted Living & Nursing Home · Stephenville, TX
CMS overall rating Info The Overall CMS Rating is scored from 1 to 5 stars and combines results from health inspections, staffing levels, and quality measures. Health inspections carry the most weight. Staffing and quality scores can increase or decrease the final rating based on performance compared to state and national standards.
Calculator: See prices in your area
Mulberry Manor accepts Medicare, Medicaid, and private pay.

Overview of Mulberry Manor

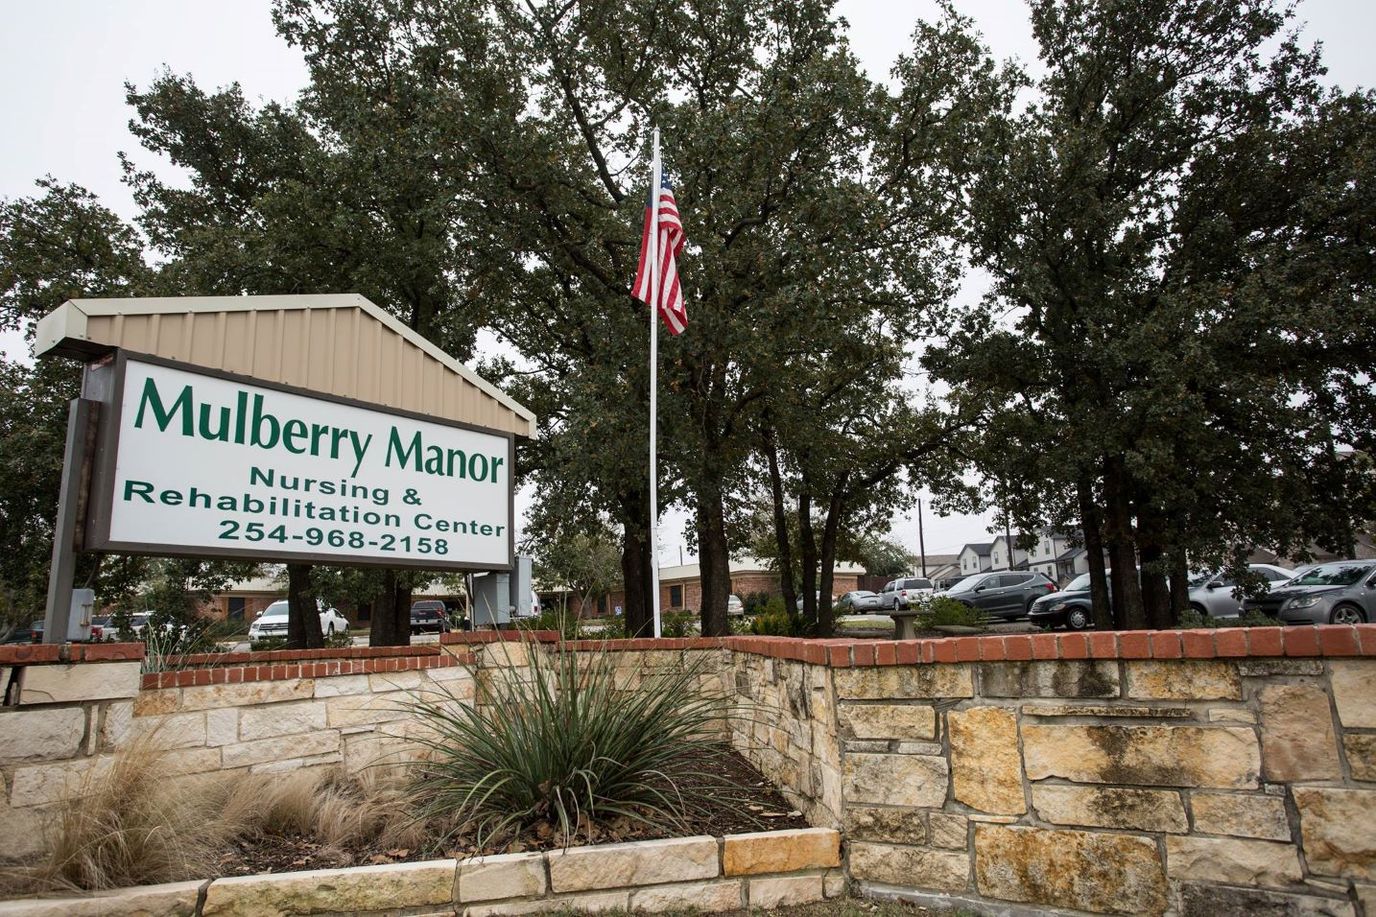
Set within the quiet neighborhood of Stephenville, TX, Mulberry Manor is a dependable senior living community, offering excellent care services, including assisted living and memory care services. The community also caters to the needs of those who are recovering from illnesses or hospitalization with skilled nursing, short-term rehabilitation, and long-term care services. Apart from having 24-hour nurses, residents find comfort in having emergency response systems installed in their cozy accommodations for quick assistance during emergencies.

A full-time Certified Activity Director is available to plan vibrant and enriching activities and monthly outings for residents’ fun and enjoyment. Delicious meals and a long-list of thoughtful amenities are also offered for a well-rounded living experience. At Mulberry Manor, residents are guaranteed to enjoy the lifestyle they deserve without the need to move into another community for their ever-changing needs.

(512) 640-7977

Quality ratings

Measured by Centers for Medicare & Medicaid Services (CMS)

Overall rating Info The Overall CMS Rating combines results from health inspections, staffing levels and quality measures. Health inspections carry the most weight. Staffing and quality scores can increase or decrease the final rating based on performance compared to state and national standards.
At TX avg.
Health Inspection Info Based on the results of the facility's three most recent standard inspections and any complaint investigations. CMS reviews the number, scope, and severity of deficiencies, with more recent findings weighted more heavily.
▼ 30.8% Below TX avg.
Staffing Info Measures average nursing staff hours per resident per day, including Registered Nurses (RNs) and total nursing staff. Ratings are adjusted based on the level of care residents require and are compared to state and national benchmarks.
▼ 16.7% Below TX avg.
Quality Measures Info Based on clinical and physical health indicators reported to CMS, such as hospital readmissions, falls, pressure ulcers, and improvements in mobility. These measures reflect how well residents' health needs are being managed.
▲ 26.6% Above TX avg.

Staffing hours breakdown

Info Daily nursing hours per resident by staff type, reported to CMS. Higher is generally better — compare this facility to state and national averages to see where staffing stands.

Hours per resident per day — compared to Texas state averages

Total nursing care / resident Info This home is ranked 72nd out of 240 homes in Texas.

Total adjusted nursing hours per resident per day, combining RN, LPN, and aide time. CMS adjusts this for case-mix so facilities can be fairly compared.
3h 52m per day
Rank #72 / 240Nurse hours — state benchmarkedThis home is ranked 72nd out of 240 homes in Texas.Shows adjusted nurse hours per resident per day benchmarked to the Texas average, with a ranking across 240 Texas SNFs. More hours mean more direct care. The national average is about 3.5 hrs; below 3.0 is a red flag.
This facility Texas avg (3h 47m per day)
vs Texas avg
+2%

5 of 5 metrics below state avg

Staff type Hours / day vs state avg
Registered Nurse (RN) Info RNs hold the highest nursing license and can assess residents, interpret test results, and direct care plans. More RN hours per day often signals stronger clinical oversight and faster response to health changes. 25m per day ▼ 4% State avg: 26m per day · National avg: 41m per day
LPN / LVN Info Licensed Practical Nurses (LPNs) or Licensed Vocational Nurses (LVNs) deliver routine hands-on care — medication administration, wound dressing, and monitoring vital signs. They work under RN supervision and make up a large share of daily bedside care. 22m per day ▼ 61% State avg: 57m per day · National avg: 52m per day
Nurse Aide Info Certified Nurse Aides (CNAs) provide the most direct day-to-day assistance: bathing, dressing, feeding, and mobility. Nurse aide hours are typically the largest staffing category and directly affect residents' quality of life. 1h 39m per day ▼ 18% State avg: 2h 1m per day · National avg: 2h 21m per day
Total Nursing (Weekend) Info Combined nursing hours (RN + LPN + Nurse Aide) per resident per day on weekends. Staffing often drops on weekends — this figure reveals whether the facility maintains adequate coverage outside of weekday hours. 2h 54m per day ▼ 3% State avg: 2h 59m per day · National avg: 3h 26m per day
RN (Weekend) Info Registered nurse hours specifically on weekends. Facilities sometimes reduce RN presence on Saturdays and Sundays — a low weekend RN figure compared to weekday hours can indicate reduced clinical oversight when most administrative staff are absent. 10m per day ▼ 52% State avg: 21m per day · National avg: 29m per day

Capacity and availability

This home usually has availability

Occupancy lower than 85% suggests more openings may be available.

Higher occupancy than the Texas average: 63.5%
Occupancy rate 67.6% Rank #129 / 252Occupancy rate — state benchmarkedThis home is ranked 129th out of 252 homes in Texas.Shows this facility's occupancy rate versus the Texas average, with its statewide rank out of 252. Higher occupancy signals strong local demand and financial stability.
Avg. Length of Stay 184 days
Occupancy rate
67.6% Rank #129 / 252Occupancy rate — state benchmarkedThis home is ranked 129th out of 252 homes in Texas.Shows this facility's occupancy rate versus the Texas average, with its statewide rank out of 252. Higher occupancy signals strong local demand and financial stability.
Avg. Length of Stay
184 days

Who this home usually serves

TYPE OF STAY

Mostly long-term care residents

Most residents stay for extended periods and receive ongoing daily care.

Breakdown by payment type

Medicare

33% of new residents, usually for short-term rehab.

Typical stay 2 - 3 months

Private pay

15% of new residents, often for short stays.

Typical stay 5 - 6 months

Medicaid

51% of new residents, often for long-term daily care.

Typical stay 9 - 10 months

Finances and operations

Governmental community
Operated by state authorities.
Home revenue
$8.2M
Surplus of revenue
$2.4M
Governmental community Operated by state authorities.
Home revenue
$8.2M Rank #192 / 252Revenue — state benchmarkedThis home is ranked 192nd out of 252 homes in Texas.Shows this facility's annual revenue compared to the Texas SNF average. Higher revenue generally means more resources for staffing and capital — read alongside Payroll %.
Surplus of revenue
$2.4M
Payroll costs Info The portion of the home's budget spent on staff, including nurses, caregivers, and other employees who support care and operations. Rank #212 / 252Payroll — state benchmarkedThis home is ranked 212th out of 252 homes in Texas.Shows total annual staff payroll benchmarked to the Texas average. Higher payroll investment relative to peers often signals better staffing and less reliance on cheaper contract labor.
$2.7M
33% of revenue Rank #190 / 230Payroll % — state benchmarkedThis home is ranked 190th out of 230 homes in Texas.Shows payroll as a percentage of revenue versus the Texas average. Well-run SNFs often land around 55–65%. Below 25% may signal understaffing or heavy agency use — read with Staffing ratings.
Other operating costs Info All remaining costs needed to run the home, such as food, utilities, building maintenance, supplies and administrative expenses.
$3.1M
Total costs $5.8M
Years in operation
44 years in operation
A longer operating history, which may indicate experience navigating regulations and delivering ongoing care.
Walk Score
Walk Score: 37 / 100 Rank #135 / 207Walk Score — state benchmarkedThis home is ranked 135th out of 207 homes in Texas.Shows how walkable this facility's neighborhood is compared to the average Walk Score across Texas SNFs. Higher scores benefit residents, families, and staff.
Somewhat walkable. A few nearby services may be reachable on foot, but most trips require transportation.

License Details

CMS Certification Number455744

Staffing

Key information about the people who lead and staff this community.

Leadership

ContactBusiness Manager/Owner

Memory & Specialized Care

1 service
No Alzheimer's certification

What does this home offer?

Total residents icon

Total Residents: 102

Building type icon
Building type icon

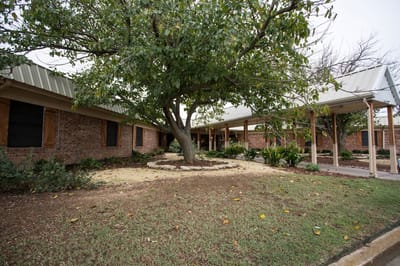
Building Type: Single-story

Types of Care at Mulberry Manor

Assisted Living Memory Care Nursing Home

Contact Mulberry Manor

Inspection History

In Texas, the Health and Human Services Commission (HHSC) is the primary regulatory body that conducts unannounced inspections and publishes quality reports for all long-term care homes.

Since 2023 · 3 years of data 30 citations

Inspection Scorecard Info This scorecard compares key inspection, citation, and complaint metrics at this facility against the Texas state average. Metrics rated ≥15% worse than average are highlighted in red; those ≥15% better are highlighted in green.

Since 2023 vs. Texas state average
Overall vs. TX average 2 Worse Metrics worse than Texas average:
• Total citations (400% above)
• Citations per year (400% above)
0 Better No metrics in this bucket.
Latest Inspection July 24, 2025 Annual Inspection

Citations Info Citations are formal regulatory issues recorded during state inspections.

Metric This Facility TX Average vs. TX Avg
Total citations Info Formal regulatory issues recorded by inspectors across all inspection types. 30 6 This facility has 400% more total citations than a typical Texas assisted living residence (30 vs. TX avg 6).↑ 400% worse
Citations per year Info Average citations per year since 2023. 10 2 This facility has 400% more citations per year than a typical Texas assisted living residence (10 vs. TX avg 2).↑ 400% worse

Inspection Reports Summary Info An editor-reviewed summary of the themes and findings across this facility's recent inspection reports.

The most recent inspection on July 24, 2025, identified deficiencies related to incomplete care plans for mechanical lift use and hospice services, as well as inadequate collaboration with hospice representatives. Earlier inspections showed a pattern of issues including infection control lapses, incomplete care planning, medication administration errors, staffing shortages, and failure to maintain a safe and sanitary environment. Complaint investigations revealed substantiated findings of verbal abuse by staff, inadequate abuse investigations, unsafe conditions involving a dog, and violations of resident rights, with no enforcement actions or fines listed in the available reports. Most complaints were substantiated, highlighting ongoing challenges with resident care, documentation, and safety protocols. While the facility continues to have deficiencies, some recent inspections suggest focused attention on care planning and hospice collaboration.

Read the full inspection reports for this facility, including detailed findings and corrective actions.

Show Inspection Reports

Health Inspection History

Inspections
Total health inspections 7

Texas average 7.4


Last Health inspection on Jul 2025

Total health citations
30 Rank #179 / 243Health citations — state benchmarkedThis home is ranked 179th out of 243 homes in Texas.Shows this facility's total health deficiency citations benchmarked to the Texas state average, with a ranking across all 243 TX SNFs. Lower citation counts earn a better rank.

Texas average 25.9

Citations per inspection
4.29 Rank #195 / 243Citations per inspection — state benchmarkedThis home is ranked 195th out of 243 homes in Texas.Shows average deficiency citations per CMS inspection for this facility versus the Texas mean across 243 SNFs with citation data. Lower is better.

Texas average 3.67


Health citations are formal notices following inspections when they fail to comply with safety and care standards.

18 of 30 citations resulted from standard inspections; and 12 of 30 resulted from complaint investigations.

Breakdown of citation severity (last 3 years)
Critical Health citations More info
2
In line with Texas average

Texas average: 2


Serious Health citations More info 0
100% better than Texas average

Texas average: 0.4

2 critical citations More info Texas average: 2

0 serious citations More info Texas average: 0.4

28 moderate citations More info Texas average: 23

0 minor citations More info Texas average: 0.4
Citations history (last 3 years)
Administration moderate citation Info Issues related to how the facility is managed, including policies, procedures, and compliance with regulations. Jul 24, 2025
Corrected

Care Planning moderate citation Info Issues related to creating and updating personalized care plans for residents based on their needs and conditions. Jul 24, 2025
Corrected

Infection Control moderate citation Info Issues related to preventing and controlling infections, including hygiene practices and safety protocols. Apr 09, 2025
Corrected

Abuse/Neglect moderate citation Info Issues related to protecting resident's from harm, including abuse, neglect, or mistreatment. Jul 23, 2024
Corrected

Financial Assistance for
Memory Care in Texas

Mulberry Manor is located in Stephenville, Texas.
Here are the financial assistance programs available to residents in Texas.

Get Financial aid guidance

Community Care for the Aged and Disabled (CCAD)

TX Medicaid CCAD

Age 65+ or disabled
General Texas resident, Medicaid-eligible, care need (not always nursing home level).
Income Limits (2025) ~$2,829/month 300% FBR, individual
Asset Limits $2,000 (individual), $3,000 (couple).
TX

Large state; rural access challenges.

Benefits
Personal care (5-7 hours/day) Respite (240 hours/year) Adult day care (~$60/day) Home aides

Texas Community Care Services

TX CCS

Age 60+
General Texas resident, at risk of decline.
Income Limits ~$2,000/month individual, varies
Asset Limits $5,000 individual
TX

Limited funding; high demand in urban areas.

Benefits
In-home care (3-5 hours/week) Respite (up to 10 days/year) Transportation (~5 trips/month)

Area Agency on Aging (AAA) Services

Texas AAA Services

Age 60+
General TX resident; no income/asset limits.
Income Limits (2025) None; donations encouraged.
Asset Limits Not assessed.
TX

28 AAAs; includes Meals on Wheels in some areas.

Benefits
Meals (~$5-$7/meal) Transportation Homemaker services (~4 hours/week) Respite (~5 days/year) Legal aid

Medicare Savings Program (MSP)

Texas Medicare Savings Program

Age 65+ or disabled
General TX resident, Medicare Part A/B.
Income Limits (2025) ~$2,510/month (QMB), ~$3,380/month (SLMB), ~$3,598/month (QI)—individual.
Asset Limits $9,430 (individual), $14,130 (couple).
TX

Includes Extra Help for Part D; no waitlist.

Benefits
Covers Part B premiums ($174.70/month) Deductibles ($240/year) Copays (~20%)

Family Caregiver Support Program (FCSP)

Texas Family Caregiver Support Program

Age
General Caregivers of 60+ needing care or 55+ caregivers of others; TX resident; 2+ ADLs.
Income Limits (2025) No strict cap; prioritizes low-income ~$24,980/year
Asset Limits Not assessed.
TX

High rural demand; includes grandparent caregivers.

Benefits
Respite (4-6 hours/week or 5 days/year) Adult day care ($60/day) Training Supplies (~$500/year)

VA Aid and Attendance (A&A) and Housebound Benefits

Texas VA Aid and Attendance/Housebound

Age 65+ or disabled veteran/spouse
General TX resident, wartime service, ADL help (A&A) or homebound.
Income Limits (2025) Net income < ~$1,984/month (veteran with dependent, A&A); pension offsets income.
Asset Limits ~$155,356 net worth
TX

High veteran population; supports rural/urban needs.

Benefits
Cash (~$1,433-$2,642/month veteran, ~$951-$1,318 spouse) for care costs

Property Tax Exemption for Seniors

Texas Senior Property Tax Exemption

Age 65+
General TX resident, homeowner (homestead).
Income Limits (2025) None; tax-based eligibility.
Asset Limits Not assessed.
TX

$25,000+ exemption; optional freeze in some counties; saves ~$500-$1,000/year.

Benefits
Tax exemption or freeze (~$500-$1,000/year savings)

Senior Farmers’ Market Nutrition Program (SFMNP)

Texas SFMNP

Age 60+
General TX resident, low-income.
Income Limits (2025) ~$2,322/month 185% FPL
Asset Limits Not assessed.
TX

Vouchers (~$50/season); serves ~20,000 via 28 AAAs.

Benefits
Vouchers (~$50/season) for produce at farmers’ markets

Places of interest near Mulberry Manor

Address 2.1 miles from city center Info Estimated distance in miles from Stephenville's city center to Mulberry Manor's address, calculated via Google Maps.

Calculate Travel Distance to Mulberry Manor

Add your location

Address

Staffing Data (Q2 2025)

This data corresponds to Q2 2025 and is based on CMS Payroll-Based Journal.

Total staff 188
Employees 80
Contractors 108
Staff to resident ratio 2.44:1
62% better than Texas average

Texas average ratio: 1.51:1

Avg staff/day 31
Average shift 8.2 hours
0% compared with Texas average

Texas average: 8.1 hours

Total staff hours (quarter) 23,187

Nursing staff breakdown

Registered Nurse

Manages medical care and health needs.

Total count 9
Average shift length Info Average shift length. Calculated as total hours divided by days worked and average staff per day. 9.2 hours

No contractors work on this role.

Licensed Practical Nurse

Assists with medical care and medications.

Total count 56
Average shift length Info Average shift length. Calculated as total hours divided by days worked and average staff per day. 9 hours

This role is partially covered by contractors.

Certified Nursing Assistant

Helps with daily care and mobility.

Total count 80
Average shift length Info Average shift length. Calculated as total hours divided by days worked and average staff per day. 8.4 hours

This role is partially covered by contractors.

Contractor staffing

Total hours from contractors

22.5%

5,217 contractor hours this quarter

Licensed Practical Nurse: 48 Certified Nursing Assistant: 43 Physical Therapy Aide: 5 Speech Language Pathologist: 4 Respiratory Therapy Technician: 3 Physical Therapy Assistant: 1 Qualified Social Worker: 1 Occupational Therapy Aide: 1 Medical Director: 1 Occupational Therapy Assistant: 1

Staff by category

Certified Nursing Assistant 37 43 80 11,149 91 100% 8.4
Licensed Practical Nurse 8 48 56 3,887 91 100% 9
Nurse Aide in Training 8 0 8 2,258 90 99% 8.7
Physical Therapy Aide 0 5 5 1,336 70 77% 7.1
Registered Nurse 9 0 9 1,043 83 91% 9.2
Nurse Practitioner 4 0 4 545 60 66% 8
Dietitian 2 0 2 535 62 68% 7
RN Director of Nursing 3 0 3 455 52 57% 8.4
Clinical Nurse Specialist 4 0 4 437 37 41% 9.9
Administrator 3 0 3 424 53 58% 8
Qualified Social Worker 0 1 1 307 65 71% 4.7
Speech Language Pathologist 0 4 4 277 49 54% 5.1
Other Dietary Services Staff 1 0 1 189 31 34% 6.1
Respiratory Therapy Technician 0 3 3 127 31 34% 4.1
Mental Health Service Worker 1 0 1 125 21 23% 5.9
Physical Therapy Assistant 0 1 1 39 27 30% 1.4
Occupational Therapy Aide 0 1 1 33 9 10% 3.7
Occupational Therapy Assistant 0 1 1 17 2 2% 8.5
Medical Director 0 1 1 6 6 7% 1
80 Certified Nursing Assistant
% of Days 100%
56 Licensed Practical Nurse
% of Days 100%
8 Nurse Aide in Training
% of Days 99%
5 Physical Therapy Aide
% of Days 77%
9 Registered Nurse
% of Days 91%
4 Nurse Practitioner
% of Days 66%
2 Dietitian
% of Days 68%
3 RN Director of Nursing
% of Days 57%
4 Clinical Nurse Specialist
% of Days 41%
3 Administrator
% of Days 58%
1 Qualified Social Worker
% of Days 71%
4 Speech Language Pathologist
% of Days 54%
1 Other Dietary Services Staff
% of Days 34%
3 Respiratory Therapy Technician
% of Days 34%
1 Mental Health Service Worker
% of Days 23%
1 Physical Therapy Assistant
% of Days 30%
1 Occupational Therapy Aide
% of Days 10%
1 Occupational Therapy Assistant
% of Days 2%
1 Medical Director
% of Days 7%

Facility Characteristics

Source: CMS Long-Term Care Facility Characteristics (Data as of Jan 2026)

Total residents 77
Medicare
3
3.9% of residents
Medicaid
64
83.1% of residents
Private pay or other
10
13% of residents
Programs & Services
Residents Group

Residents meet regularly to discuss policies, care quality, and activities

Active Resident Council

Organized group of residents that meets regularly to discuss facility policies, quality of life, and activities.

Quality of care over time

These measures show how residents usually do over time at this home, based on health outcomes and preventive care.

High-risk clinical events score Info A composite score based on pressure ulcers, falls with injury, weight loss, walking ability decline, and activities of daily living decline. 4.4
49% better than Texas average

Texas average: 8.6

Functional decline score Info A composite score based on activities of daily living decline, walking ability decline, and incontinence. 7.6
53% better than Texas average

Texas average: 16.0

Long-stay resident measures
Significantly above average Texas avg: 4.1 Info CMS star rating based on long-stay quality measure performance. 5 stars = significantly above average, 1 star = significantly below average.
Need for Help with Daily Activities Increased Info Percent of long-stay residents whose need for help with daily activities has increased 13.1%
19% better than Texas average

Texas average: 16.2%

Walking Ability Worsened Info Percent of long-stay residents whose ability to move independently worsened 1.2%
93% better than Texas average

Texas average: 16.2%

Low Risk Residents with Bowel/Bladder Incontinence Info Percent of low risk long-stay residents who lose control of their bowels or bladder 8.5%
46% better than Texas average

Texas average: 15.7%

Falls with Major Injury Info Percent of long-stay residents experiencing one or more falls with major injury 2.5%
22% better than Texas average

Texas average: 3.2%

High Risk Residents with Pressure Ulcers Info Percent of long-stay high risk residents with pressure ulcers 2.9%
36% better than Texas average

Texas average: 4.4%

Urinary Tract Infection Info Percent of long-stay residents with a urinary tract infection 0.0%
100% better than Texas average

Texas average: 0.8%

Lost Too Much Weight Info Percent of long-stay residents who lose too much weight 2.1%
39% better than Texas average

Texas average: 3.5%

Depressive Symptoms Info Percent of long-stay residents who have depressive symptoms 1.5%
46% better than Texas average

Texas average: 2.9%

Antipsychotic Use Info Percent of long-stay residents who received an antipsychotic medication 5.1%
35% better than Texas average

Texas average: 7.9%

Pneumococcal Vaccine Info Percent of long-stay residents assessed and appropriately given the pneumococcal vaccine 93.9%
In line with Texas average

Texas average: 97.3%

Influenza Vaccine Info Percent of long-stay residents assessed and appropriately given the seasonal influenza vaccine 100.0%
In line with Texas average

Texas average: 97.9%

Hospitalizations per 1,000 days Info Number of hospitalizations per 1,000 long-stay resident days. 1.68
21% better than Texas average

Texas average: 2.13

ED visits per 1,000 days Info Number of outpatient emergency department visits per 1,000 long-stay resident days. 2.46
19% worse than Texas average

Texas average: 2.07

Short-stay resident measures
Pneumococcal Vaccine Info Percent of short-stay residents assessed and appropriately given the pneumococcal vaccine 85.1%
6% worse than Texas average

Texas average: 90.4%

Re-hospitalized after SNF stay Info Percentage of short-stay residents who were re-hospitalized after their nursing home admission. 34.1%
32% worse than Texas average

Texas average: 25.9%

Emergency department visits Info Percentage of short-stay residents who had an outpatient emergency department visit. 16.6%
38% worse than Texas average

Texas average: 12.0%

Penalties and fines

Federal penalties imposed by CMS for regulatory violations, including civil money penalties (fines) and denials of payment for new Medicare/Medicaid admissions.

Source: CMS Penalties Database (Data as of Jan 2026)

Total fines amount $205K
154% higher than Texas average

Texas average: $80K

Number of fines 1
60% fewer fines than Texas average

Texas average: 2.5

Payment Denials Info Serious action where Medicare and/or Medicaid temporarily stops payments for new residents until issues are fixed. 1
354% more payment denials than Texas average

Texas average: 0.2

Fines amount comparison
This facility $205K
Texas average $80K
Penalty History

Penalties are imposed by CMS for violations of federal nursing home regulations.

2 penalties in the past 3 years

Multiple penalties were reported in the last 3 years.

Civil Money Penalty Info Fines imposed for noncompliance, which can be assessed per day or per instance of violation. Jun 14, 2024
$205K
Payment Denial Info Serious action where Medicare and/or Medicaid temporarily stops payments for new residents until issues are fixed. Jun 14, 2024
15 days

Last updated: Jan 2026

Compare Memory Care around Stephenville

The information below is reported by the Texas Health and Human Services Commission.

Filter by care type
Mulberry Manor
MC

Memory Care Secured, specialized care for people living with Alzheimer's or dementia. Staff trained in cognitive impairment, with higher staff-to-resident ratios and an environment designed to reduce confusion and wandering risk.

AL

Assisted Living A licensed, long-term care setting for seniors or individuals with disabilities who need help with daily activities — like bathing, dressing, and medication management — but not 24-hour skilled nursing. Offers housing, meals, and around-the-clock support while aiming to maximize resident independence.

IL

Independent Living Lifestyle-focused communities for older adults offering dining, activities, and transportation with minimal personal care. Best for active, independent seniors who want community without medical support.

NH

Nursing Home Licensed facility providing 24/7 skilled nursing care for residents with complex, ongoing medical needs. Staffed by RNs, LPNs, and CNAs. Inspected and star-rated annually by CMS. Accepts Medicare (short-term rehab) and Medicaid (long-term care).

Stephenville 102 No 37 44 - - - - -
Good Tree
AL

Assisted Living A licensed, long-term care setting for seniors or individuals with disabilities who need help with daily activities — like bathing, dressing, and medication management — but not 24-hour skilled nursing. Offers housing, meals, and around-the-clock support while aiming to maximize resident independence.

IL

Independent Living Lifestyle-focused communities for older adults offering dining, activities, and transportation with minimal personal care. Best for active, independent seniors who want community without medical support.

MC

Memory Care Secured, specialized care for people living with Alzheimer's or dementia. Staff trained in cognitive impairment, with higher staff-to-resident ratios and an environment designed to reduce confusion and wandering risk.

RC

Respite Care Short-term temporary care — days to weeks — to give family caregivers a break. Full care provided during the stay. Often used after hospitalization or to trial a facility before a permanent placement decision.

Stephenville 65 Yes 21 - Csl Ce Stephenville LLC 7 1 6 -

Guides for Better Senior Living

Care Cost Calculator: See Prices in Your Area

Nursing Home Data Explorer

Don’t Wait Too Long: 7 Red Flag Signs Your Parent Needs Assisted Living Now

The True Cost of Assisted Living in 2025 – And How Families Are Paying For It

Understanding Senior Living Costs: Pricing Models, Discounts & Financial Assistance

Frequently Asked Questions about Mulberry Manor

Is Mulberry Manor in a walkable area?

Mulberry Manor has a walk score of 37. Somewhat walkable. A few nearby services may be reachable on foot, but most trips require transportation.

What is the occupancy rate at Mulberry Manor?

Mulberry Manor's occupancy is 73.7%.

Who is the administrator of Mulberry Manor?

field_administrator is the administrator of Mulberry Manor.

What is the address of Mulberry Manor?

Mulberry Manor is located at 1670 W Lingleville Rd, Stephenville, TX 76401, United States.

What is the phone number of Mulberry Manor?

(512) 640-7977 will put you in contact with the team at Mulberry Manor.

Is Mulberry Manor Medicare or Medicaid certified?

Yes — Mulberry Manor is a CMS-certified provider of Medicare and Medicaid.

Explore Open Rooms
1 Contact details
2 What type of senior care service are you looking for?
3 What budget do you have in mind for senior care?
4 How soon do you need to find care?
5 Additional details

Thank you for your interest!

Our team will be in touch shortly to help with next steps.