Explore Open Rooms
1 Contact details
2 What type of senior care service are you looking for?
3 What budget do you have in mind for senior care?
4 How soon do you need to find care?
5 Additional details

Thank you for your interest!

Our team will be in touch shortly to help with next steps.

Nursing Home in Hempstead

CMS overall rating Info The Overall CMS Rating combines results from health inspections, staffing levels and quality measures. Health inspections carry the most weight. Staffing and quality scores can increase or decrease the final rating based on performance compared to state and national standards.

Nassau Rehabilitation and Nursing Center

Overview of Nassau Rehabilitation and Nursing Center

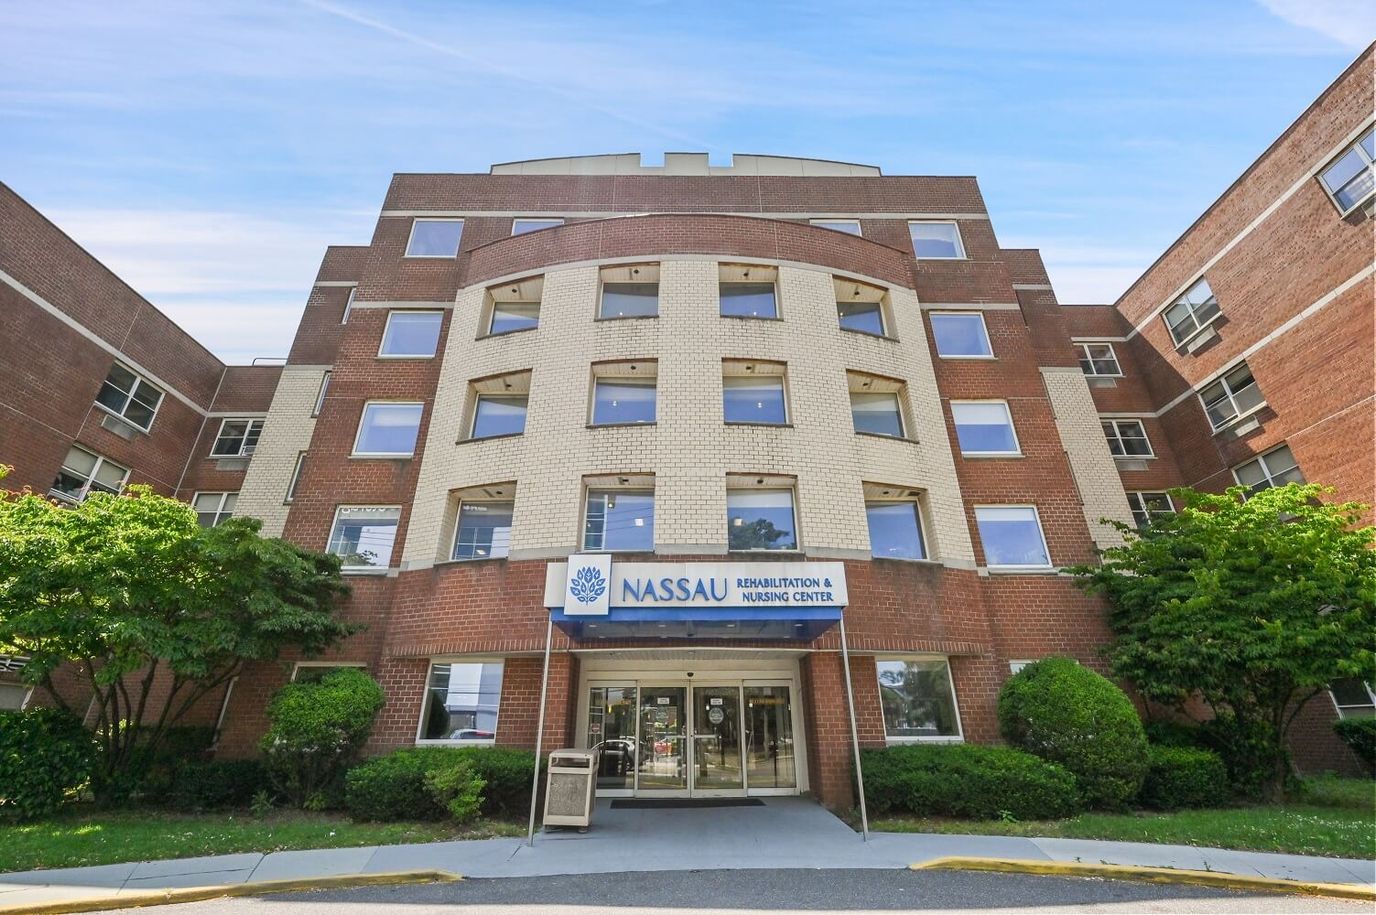
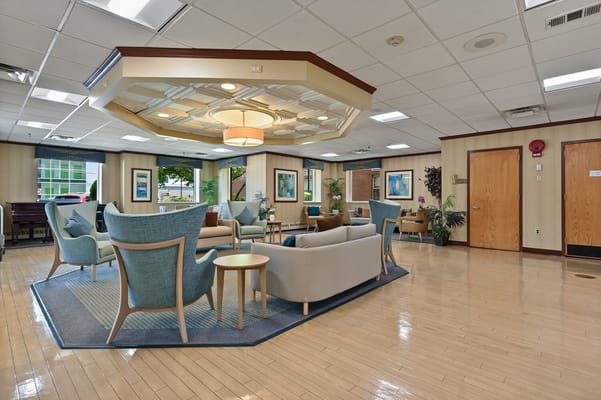
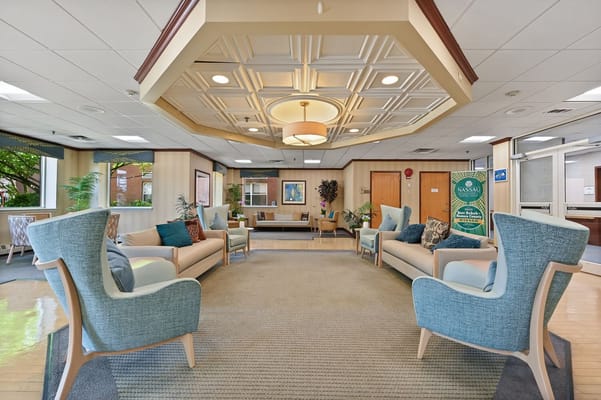
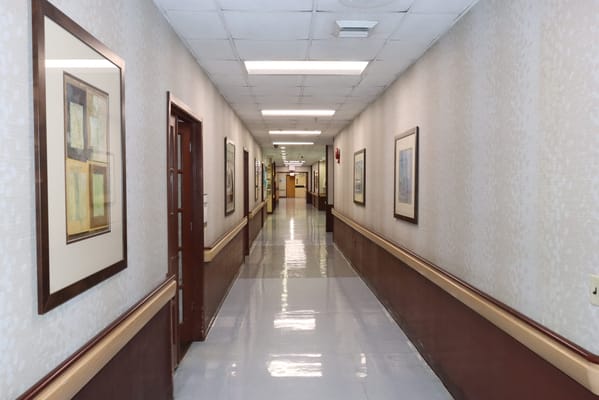
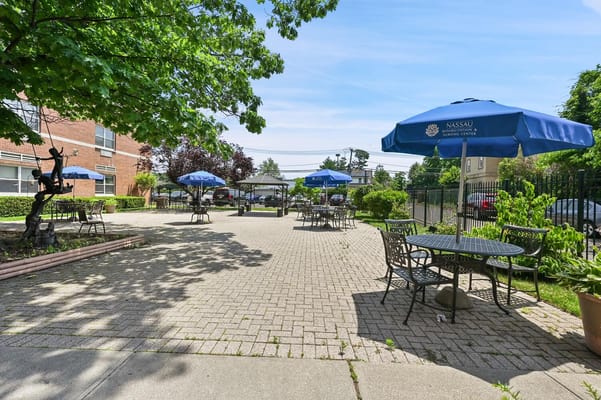
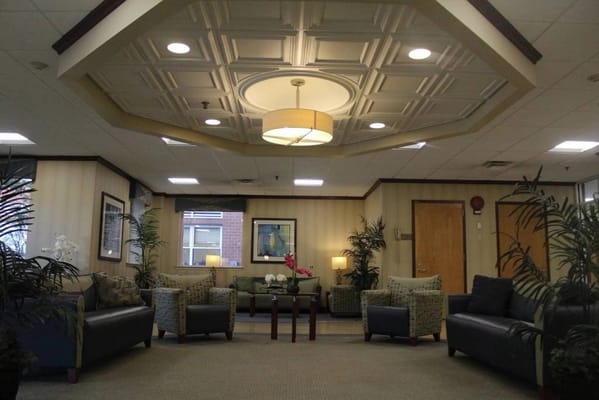
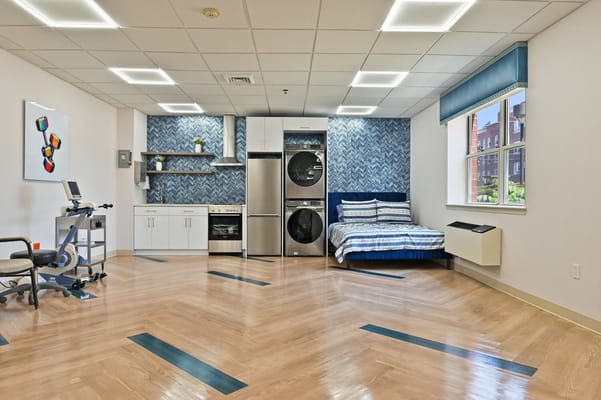
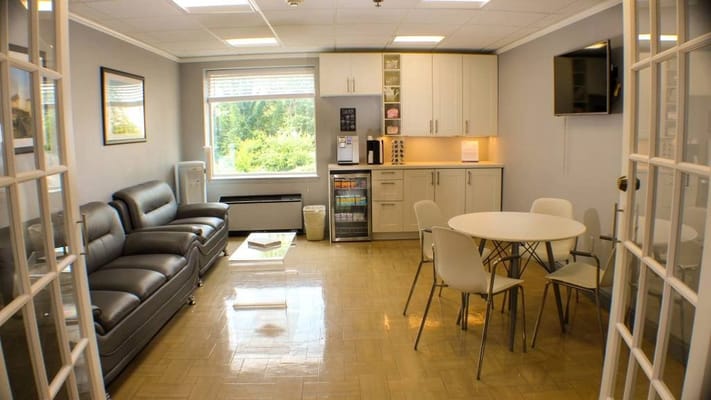
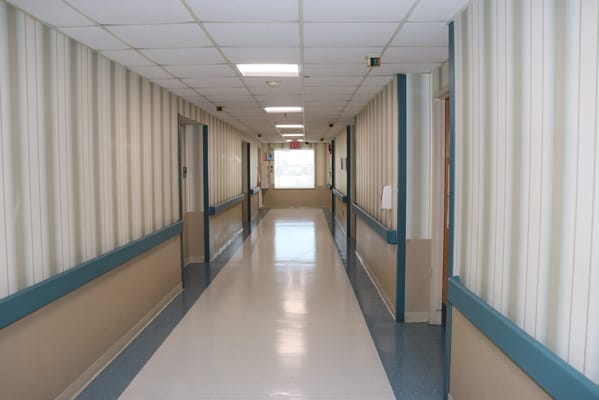
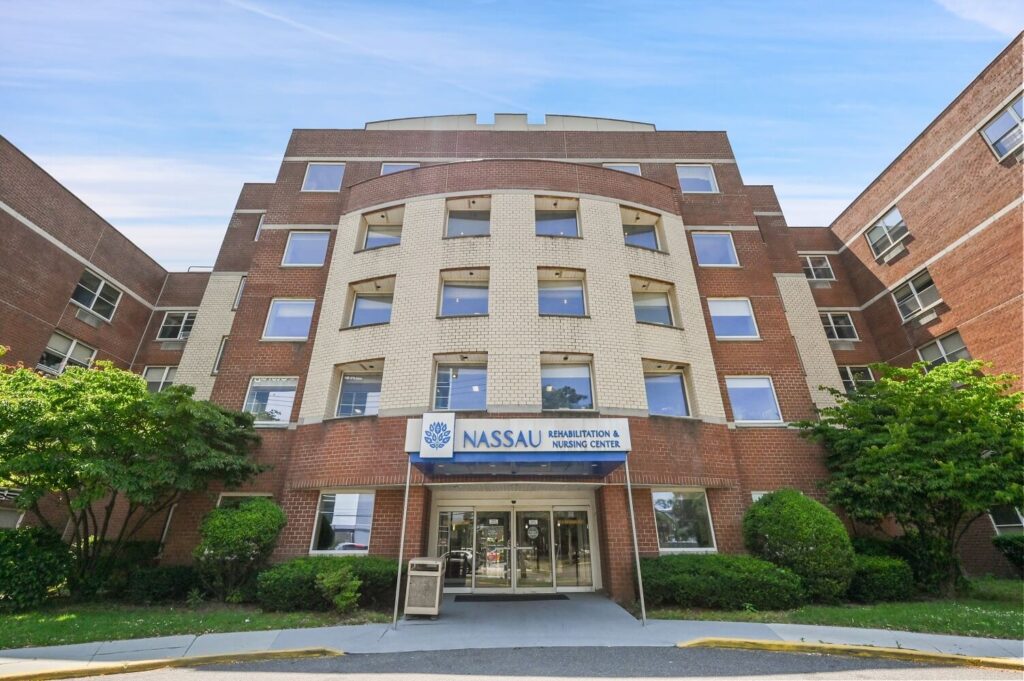
Nassau Rehabilitation & Nursing Center is an award-winning nursing home in Hempstead, NY, offering long-term care and rehabilitation. The community’s hotel-like and welcoming setting ensures older adults are treated well throughout their stay. Excellent services, including concierge, nutritious meals, and 24-hour nursing care, are also provided to enrich residents’ living experiences. Through individualized care plans, residents receive the utmost attention and care to live comfortably.

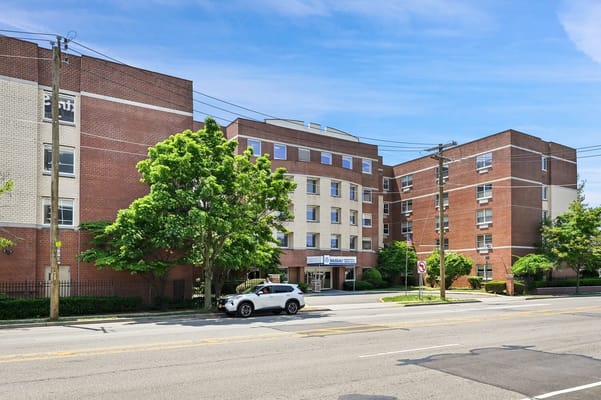
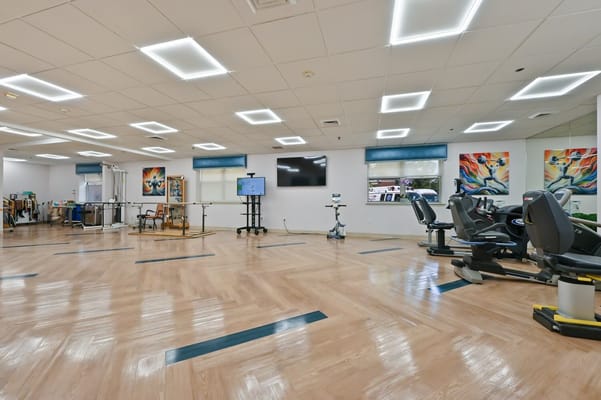
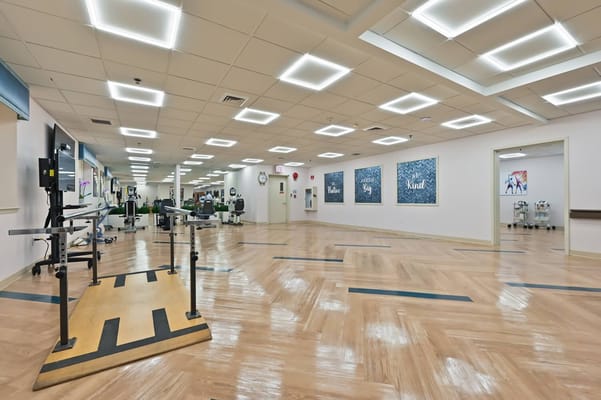
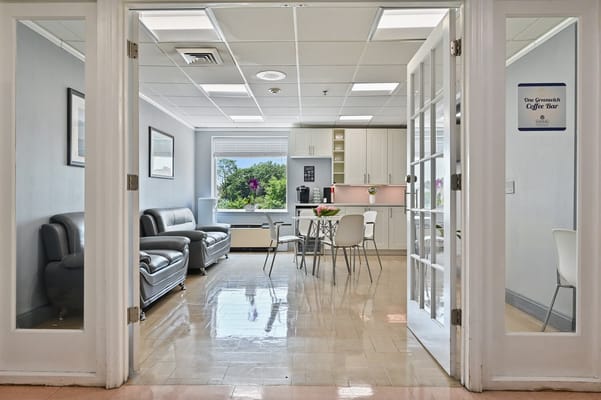
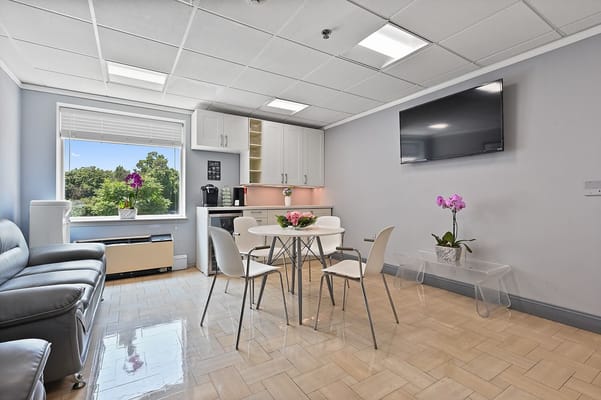
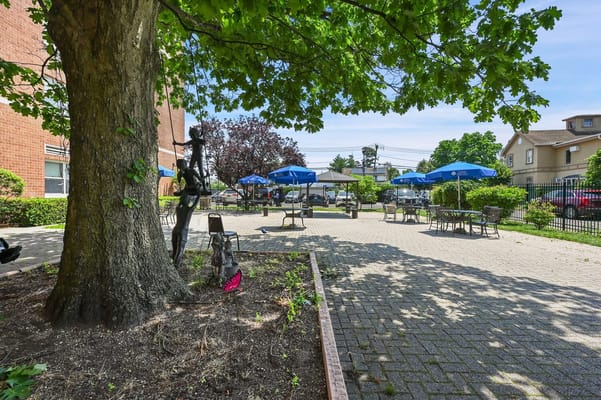
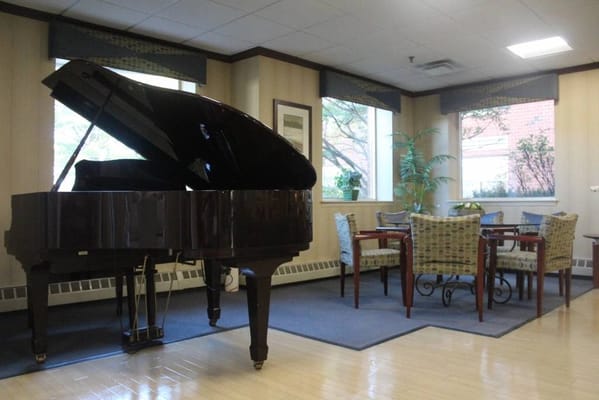
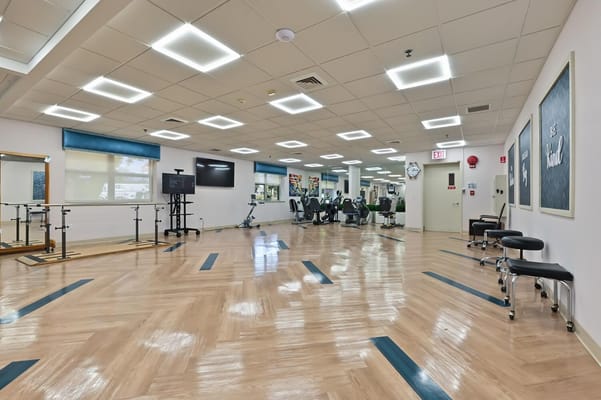
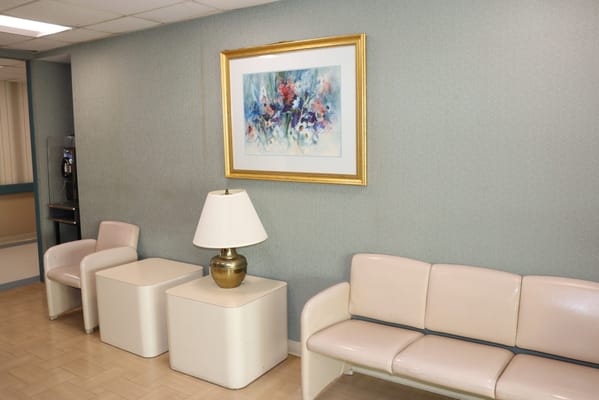
Therapeutic activities, exercises, and social events help enhance residents’ holistic well-being and gain meaningful experiences. A coffee bar, spacious lounges, and accessible rooms are among the top-notch amenities dedicated to residents’ relaxation and wellness. Residents also experience a convenient and laid-back lifestyle, as it is located in the serene residential area of Hempstead, near a bank, shops, and restaurants. This nursing home is an ideal choice for senior living in New York, especially with its commitment to older adults’ welfare.

Quality ratings

Measured by Centers for Medicare & Medicaid Services (CMS)

Overall rating Info The Overall CMS Rating combines results from health inspections, staffing levels and quality measures. Health inspections carry the most weight. Staffing and quality scores can increase or decrease the final rating based on performance compared to state and national standards.
3/5
New York average: 3.1/5
Health Inspection Info Based on the results of the facility's three most recent standard inspections and any complaint investigations. CMS reviews the number, scope, and severity of deficiencies, with more recent findings weighted more heavily.
2/5
New York average: 2.8/5
Staffing Info Measures average nursing staff hours per resident per day, including Registered Nurses (RNs) and total nursing staff. Ratings are adjusted based on the level of care residents require and are compared to state and national benchmarks.
2/5
New York average: 2.7/5
Quality Measures Info Based on clinical and physical health indicators reported to CMS, such as hospital readmissions, falls, pressure ulcers, and improvements in mobility. These measures reflect how well residents' health needs are being managed.
5/5
New York average: 4.0/5

Nursing care per resident

Info This shows how many total hours of nursing staff time are available per resident each day. Higher numbers usually mean more staff support.
2h 47m per day

This home provides 20% less nursing time per resident than the New York average.

New York average: 3h 29m per day

Staffing hours breakdown

Info Hours of care per resident per day, broken down by staff type. Data from CMS Medicare.
Staff type Facility State avg National avg
Registered Nurse (RN) Info Registered nurse hours per resident per day. 16m per day 42m per day 41m per day
Nurse Aide Info Nurse aide hours per resident per day. 2h 7m per day 2h 11m per day 2h 21m per day
Total Nursing (Weekend) Info Total number of nurse staff hours per resident per day on weekends. 2h 49m per day 3h 10m per day 3h 26m per day
Physical Therapist Info Physical therapist staff hours per resident per day. 6m per day 7m per day 4m per day
RN (Weekend) Info Registered nurse hours per resident per day on weekends. 7m per day 28m per day 29m per day

Capacity and availability

High-capacity home

May provide extensive amenities, services and programs.

Total beds 280

This home is often near full

That suggests steady demand, but availability may be limited.

Higher demand than most homes in New York
Occupancy rate 96.8%
Residents per day (avg) 280
Occupancy rate
96.8%
Residents per day (avg)
280

Who this home usually serves

TYPE OF STAY

Mostly short-term rehab stays

Most residents typically stay for a few weeks or months before returning home or moving on.

Might be optimal for
Short stays Recovery Medicare-covered care

Breakdown by payment type

Medicare

65% of new residents, usually for short-term rehab.

Typical stay 1 - 2 months

Private pay

6% of new residents, often for short stays.

Typical stay 1 - 2 years

Medicaid

29% of new residents, often for long-term daily care.

Typical stay 1 years

Finances and operations

Privately-owned community
Operated by a partnership between two or more business owners.
Home revenue
$47.9M
Profit
$1.6M
Privately-owned community Operated by a partnership between two or more business owners.
Home revenue
$47.9M
Profit
$1.6M
Payroll costs Info The portion of the home's budget spent on staff, including nurses, caregivers, and other employees who support care and operations.
$13.4M
27.9% of revenue
Other operating costs Info All remaining costs needed to run the home, such as food, utilities, building maintenance, supplies and administrative expenses.
$32.9M
Total costs $46.3M
Bed community size
280-bed community
A large-scale community that may provide a wide range of amenities, services, and structured programs.
Walk Score
Walk Score: 88 / 100
Very walkable. Most errands can be accomplished on foot, and many essentials are within a short walk.

About this community

License Details

Facility TypeNursing Home
CountyNassau

Additional Licensing Details

Inspection Rating3

Ownership & Operating Entity

Nassau Rehabilitation and Nursing Center is legally operated by Nassau Operating Company, LLC (For Profit).

Therapy & Rehabilitation

1 service
Rehabilitation Services

Staffing & Medical

1 service
24-Hour Staffing

Additional Services

3 services
Long Term Care
Rehabilitation/Ortho Rehab
Adult Day Center

Amenities & Lifestyle

7 amenities
Internet Access
Coffee Bar
Concierge Service
Therapeutic Recreation Programs
Dining Options
Spa Choices
Chiropractic Services
Specific ProgramsLong Term Care, Rehabilitation/Ortho Rehab, Adult Day Center

Dining & Nutrition

Food DescriptionChef-inspired meals exceed all daily requirements and we offer a selective menu with 3 choices every day. Our Registered Dietitians are involved in every step of the meal-planning process to ensure that the daily nutritional needs of the residents are met.
Meals IncludedYes

What does this home offer?

Housing options icon

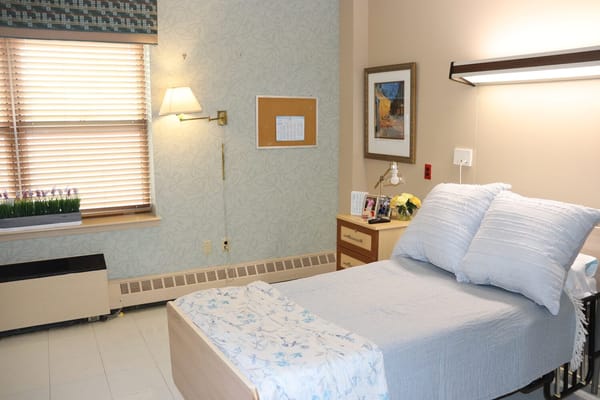
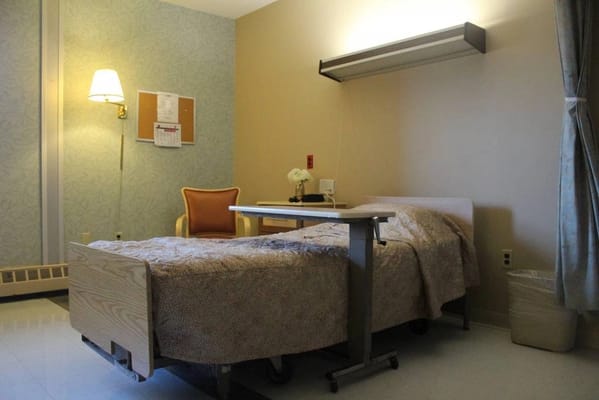
Housing Options: Private / Semi-Private Rooms

Building type icon
Building type icon

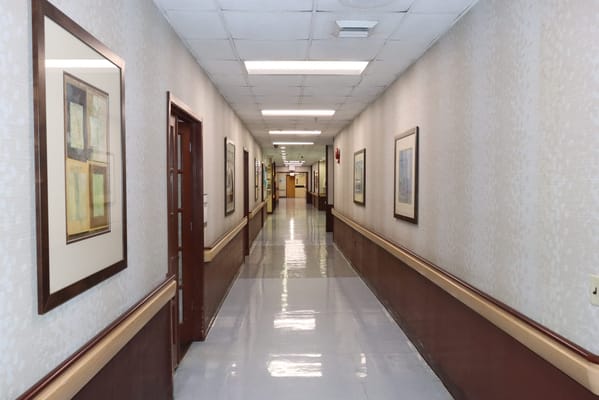
Building Type: Mid-rise

Dining services icon

Dining Services

Beauty services icon

Beauty Services

Social and recreational activities icon

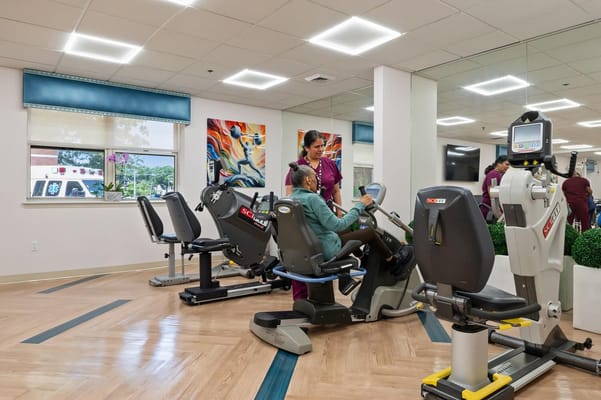
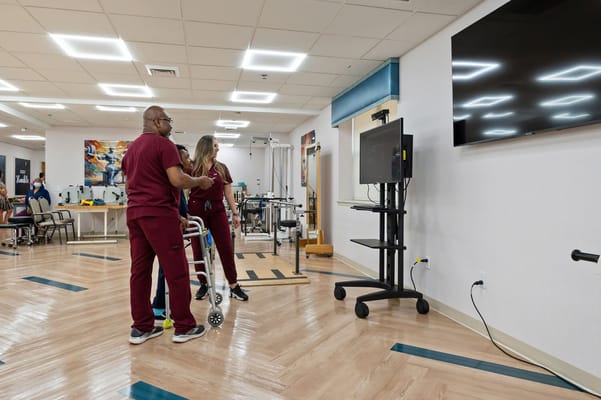
Social and Recreational Activities

On-site medical care and health services icon

On-site Medical Care and Health Services

Types of Care at Nassau Rehabilitation and Nursing Center

Assisted Living Nursing Home

Inspection History

In New York, the Department of Health, Office of Aging and Long Term Care performs unannounced onsite inspections to monitor compliance with state and federal healthcare regulations.

5 inspections

4 with citations, 1 without citations

10 on-site complaint investigations

New York average: 9 inspections (5 with citations), 15 on-site complaint investigations

54 complaints

19 complaints per 100 occupied beds

New York average: 49.9 complaints per 100 occupied beds

Formal expressions of dissatisfaction or concern made by residents, or their families regarding various aspects of the care, services, and environment provided.

New York average: 79 complaints

Latest inspection

Date May 8, 2025
Abbreviated Survey

20 total citations

14 health citations 6 life safety citations

Citations indicate regulatory violations. A higher number implies the facility had several areas requiring improvement.

New York average: 29 citations

New York average: 20 health citations

New York average: 4 life safety citations

41 deficiencies

Deficiencies indicate regulatory issues. A higher number implies the facility had several areas requiring improvement.

New York average: 22 deficiencies

Health Inspection History

Inspections
Total health inspections 4

New York average 3.6


Last Health inspection on May 2025

Total health citations 14

New York average 18.5

Citations per inspection
3.5

New York average 5.05


Health citations are formal notices following inspections when they fail to comply with safety and care standards.

13 of 14 citations resulted from standard inspections; and 1 of 14 resulted from complaint investigations.

Breakdown of citation severity (last 3 years)
Critical Health citations More info 1
400% worse than New York average

New York average: 0.2


Serious Health citations More info 0
100% better than New York average

New York average: 0.2

1 critical citation More info New York average: 0.2

0 serious citations More info New York average: 0.2

12 moderate citations More info New York average: 17.4

1 minor citation More info New York average: 0.7
Citations history (last 3 years)
Nutrition critical citation Info Issues related to food quality, meal service, and resident's nutritional needs. May 08, 2025
Corrected

Administration moderate citation Info Issues related to how the facility is managed, including policies, procedures, and compliance with regulations. Apr 28, 2025
Corrected

Pharmacy moderate citation Info Issues related to medication management, including how drugs are stored, administered, and monitored. Apr 28, 2025
Corrected

Quality of Care moderate citation Info Issues related to how well residents receive appropriate treatment and support for their medical and daily care needs. Apr 28, 2025
Corrected

Compare Nursing Homes around Hempstead The information below is reported by the New York State Department of Health.

2 facilities compared · CMS & NY Dept. of Health data · Updated Apr 2026

Filter by care type
Nassau Rehabilitation and Nursing Center
AL

Assisted Living A licensed, long-term care setting for seniors or individuals with disabilities who need help with daily activities — like bathing, dressing, and medication management — but not 24-hour skilled nursing. Offers housing, meals, and around-the-clock support while aiming to maximize resident independence.

NH

Nursing Home Licensed facility providing 24/7 skilled nursing care for residents with complex, ongoing medical needs. Staffed by RNs, LPNs, and CNAs. Inspected and star-rated annually by CMS. Accepts Medicare (short-term rehab) and Medicaid (long-term care).

Hempstead
280
96.8%
+10%
2.78
-51%
-22%
1
14
3.5
1
280
-
88
Blobstein, Jacob
$47.5M
$13.4M
28.1%
335787
Hempstead Park Nursing Home
-
NH

Nursing Home Licensed facility providing 24/7 skilled nursing care for residents with complex, ongoing medical needs. Staffed by RNs, LPNs, and CNAs. Inspected and star-rated annually by CMS. Accepts Medicare (short-term rehab) and Medicaid (long-term care).

AL

Assisted Living A licensed, long-term care setting for seniors or individuals with disabilities who need help with daily activities — like bathing, dressing, and medication management — but not 24-hour skilled nursing. Offers housing, meals, and around-the-clock support while aiming to maximize resident independence.

Hempstead
251
-
-
-
-
-
-
-
-
0
0
0.0
0
-
-
-
-
-
-
-
-

Places of interest near Nassau Rehabilitation and Nursing Center

Address 0.3 mile from city center — 5.68 miles to nearest hospital (Long Island Jewish Medical Center)

Calculate Travel Distance to Nassau Rehabilitation and Nursing Center

Add your location

Address

Staffing Data (Q2 2025)

This data corresponds to Q2 2025 and is based on CMS Payroll-Based Journal.

Total staff 264
Employees 204
Contractors 60
Staff to resident ratio 0.99:1
466% better than New York average

New York average ratio: 0.18:1

Avg staff/day 141
Average shift 7.4 hours
0% compared with New York average

New York average: 7.7 hours

Total staff hours (quarter) 95,011
Nursing staff breakdown
Registered Nurse

Manages medical care and health needs.

Total count 16
Average shift length Info Average shift length. Calculated as total hours divided by days worked and average staff per day. 7.7 hours

This role is partially covered by contractors.

Licensed Practical Nurse

Assists with medical care and medications.

Total count 52
Average shift length Info Average shift length. Calculated as total hours divided by days worked and average staff per day. 7.8 hours

This role is partially covered by contractors.

Certified Nursing Assistant

Helps with daily care and mobility.

Total count 141
Average shift length Info Average shift length. Calculated as total hours divided by days worked and average staff per day. 7.4 hours

This role is partially covered by contractors.

Contractor staffing

Total hours from contractors

17.1%

16,210 contractor hours this quarter

Licensed Practical Nurse: 26 Physical Therapy Aide: 9 Respiratory Therapy Technician: 8 Physical Therapy Assistant: 5 Speech Language Pathologist: 4 Qualified Social Worker: 3 Administrator: 2 Certified Nursing Assistant: 1 Registered Nurse: 1 Therapeutic Recreation Specialist: 1
Staff by category
Certified Nursing Assistant140114153,52691100%7.4
Licensed Practical Nurse26265217,68391100%7.8
Registered Nurse151164,54791100%7.7
Physical Therapy Aide0993,2566976%6.9
Respiratory Therapy Technician0883,1757684%8.1
Other Dietary Services Staff7072,85791100%7.4
Clinical Nurse Specialist6062,3588998%7.3
Mental Health Service Worker4041,7306673%7.6
Physical Therapy Assistant0551,4197684%6.9
Speech Language Pathologist0441,2136673%6.3
Occupational Therapy Aide3039817178%6.9
Administrator1238526571%5.5
Nurse Practitioner1014556571%7
Dietitian1014355864%7.5
Therapeutic Recreation Specialist0114095864%7.1
Qualified Social Worker0331162022%4.1
141 Certified Nursing Assistant
% of Days 100%
52 Licensed Practical Nurse
% of Days 100%
16 Registered Nurse
% of Days 100%
9 Physical Therapy Aide
% of Days 76%
8 Respiratory Therapy Technician
% of Days 84%
7 Other Dietary Services Staff
% of Days 100%
6 Clinical Nurse Specialist
% of Days 98%
4 Mental Health Service Worker
% of Days 73%
5 Physical Therapy Assistant
% of Days 84%
4 Speech Language Pathologist
% of Days 73%
3 Occupational Therapy Aide
% of Days 78%
3 Administrator
% of Days 71%
1 Nurse Practitioner
% of Days 71%
1 Dietitian
% of Days 64%
1 Therapeutic Recreation Specialist
% of Days 64%
3 Qualified Social Worker
% of Days 22%

Facility Characteristics

Source: CMS Long-Term Care Facility Characteristics (Data as of Jan 2026)

Total census
266 residents
Residents by payment source
Medicare
37 residents (13.9%)
Medicaid
192 residents (72.2%)
Private pay or other
37 residents (13.9%)
Programs & Services
Residents' Group

Residents meet regularly to discuss policies, care quality, and activities

Active Resident Council

Organized group of residents that meets regularly to discuss facility policies, quality of life, and activities.

Quality of care over time

These measures show how residents usually do over time at this home, based on health outcomes and preventive care.

High-risk clinical events score Info A composite score based on pressure ulcers, falls with injury, weight loss, walking ability decline, and activities of daily living decline. 7.4
24% better than New York average

New York average: 9.8

Functional decline score Info A composite score based on activities of daily living decline, walking ability decline, and incontinence. 11.1
39% better than New York average

New York average: 18.1

Long-stay resident measures
Significantly above average New York avg: 4.3 Info CMS star rating based on long-stay quality measure performance. 5 stars = significantly above average, 1 star = significantly below average.
Need for Help with Daily Activities Increased Info Percent of long-stay residents whose need for help with daily activities has increased 11.9%
28% better than New York average

New York average: 16.4%

Walking Ability Worsened Info Percent of long-stay residents whose ability to move independently worsened 12.8%
23% better than New York average

New York average: 16.6%

Low Risk Residents with Bowel/Bladder Incontinence Info Percent of low risk long-stay residents who lose control of their bowels or bladder 8.7%
59% better than New York average

New York average: 21.4%

Falls with Major Injury Info Percent of long-stay residents experiencing one or more falls with major injury 0.6%
79% better than New York average

New York average: 3.0%

High Risk Residents with Pressure Ulcers Info Percent of long-stay high risk residents with pressure ulcers 5.3%
26% better than New York average

New York average: 7.2%

Urinary Tract Infection Info Percent of long-stay residents with a urinary tract infection 0.6%
54% better than New York average

New York average: 1.4%

Lost Too Much Weight Info Percent of long-stay residents who lose too much weight 6.6%
9% worse than New York average

New York average: 6.1%

Depressive Symptoms Info Percent of long-stay residents who have depressive symptoms 91.4%
405% worse than New York average

New York average: 18.1%

Antipsychotic Use Info Percent of long-stay residents who received an antipsychotic medication 12.0%
5% better than New York average

New York average: 12.6%

Pneumococcal Vaccine Info Percent of long-stay residents assessed and appropriately given the pneumococcal vaccine 95.4%
In line with New York average

New York average: 91.4%

Influenza Vaccine Info Percent of long-stay residents assessed and appropriately given the seasonal influenza vaccine 95.5%
In line with New York average

New York average: 95.2%

Hospitalizations per 1,000 days Info Number of hospitalizations per 1,000 long-stay resident days. 1.49
13% better than New York average

New York average: 1.71

ED visits per 1,000 days Info Number of outpatient emergency department visits per 1,000 long-stay resident days. 1.41
In line with New York average

New York average: 1.35

Short-stay resident measures
Significantly above average New York avg: 3.7 Info CMS star rating based on short-stay quality measure performance. 5 stars = much above average, 1 star = much below average.
Pneumococcal Vaccine Info Percent of short-stay residents assessed and appropriately given the pneumococcal vaccine 43.9%
43% worse than New York average

New York average: 76.6%

Antipsychotic medication increase Info Percent of short-stay residents who newly received an antipsychotic medication 1.6%
23% worse than New York average

New York average: 1.3%

Influenza Vaccine Info Percent of short-stay residents assessed and appropriately given the seasonal influenza vaccine 61.3%
22% worse than New York average

New York average: 78.8%

Re-hospitalized after SNF stay Info Percentage of short-stay residents who were re-hospitalized after their nursing home admission. 19.7%
In line with New York average

New York average: 20.6%

Emergency department visits Info Percentage of short-stay residents who had an outpatient emergency department visit. 7.6%
22% better than New York average

New York average: 9.7%

Falls with major injury Info Percentage of SNF residents who experience falls with major injury during their stay. 2.1%
169% worse than New York average

New York average: 0.8%

Ability to care for self at discharge Info Percentage of residents at or above expected ability to care for themselves at discharge. 43.4%
19% worse than New York average

New York average: 53.7%

Successful return to home or community Info Rate of successful return to home or community from a skilled nursing facility. 55.7%
10% better than New York average

New York average: 50.6%

Penalties and fines

Federal penalties imposed by CMS for regulatory violations, including civil money penalties (fines) and denials of payment for new Medicare/Medicaid admissions.

Source: CMS Penalties Database (Data as of Jan 2026)

Total fines amount $16K
76% lower than New York average

New York average: $66K

Number of fines 1
51% fewer fines than New York average

New York average: 2.0

Payment Denials Info Serious action where Medicare and/or Medicaid temporarily stops payments for new residents until issues are fixed. 0
100% fewer payment denials than New York average

New York average: 0.1

Fines amount comparison
This facility $16K
New York average $66K
Penalty History

Penalties are imposed by CMS for violations of federal nursing home regulations.

Civil Money Penalty Info Fines imposed for noncompliance, which can be assessed per day or per instance of violation. Apr 28, 2025
$16K

Last updated: Jan 2026

Guides for Better Senior Living

Care Cost Calculator: See Prices in Your Area

Nursing Home Data Explorer

Don’t Wait Too Long: 7 Red Flag Signs Your Parent Needs Assisted Living Now

The True Cost of Assisted Living in 2025 – And How Families Are Paying For It

Understanding Senior Living Costs: Pricing Models, Discounts & Financial Assistance

Financial Aid for New York Seniors

Get financial aid guidance

Community First Choice Option

NY Medicaid CFCO

Age 65+ or disabled, New York resident, Medicaid- eligible, care need (not necessarily nursing home level).

~$2,829/month (300% FBR, individual).

$30,182 (individual, higher due to NY Medicaid expansion).

Higher asset limit; urban density increases demand.

Expanded In-Home Services for the Elderly Program (EISEP)

NY EISEP

Age 60+, New York resident, at risk of decline but not nursing home level.

~$2,500/month (individual, varies).

$15,000 (individual).

Cost-sharing required above certain income; urban/rural balance.

Senior Citizen Rent Increase Exemption (SCRIE)

NY SCRIE

Age 62+, NYC resident, live in rent-controlled/stabilized apartment, spend >1/3 of income on rent.

$50,000/year (household).

No strict asset cap, but income-focused eligibility.

Limited to NYC’s rent-regulated units; high demand in urban areas.

Senior Citizen Homeowners’ Exemption (SCHE)

NY SCHE

Age 65+, NYC resident, own and live in a 1-3 family home, co-op, or condo.

$58,399/year (household).

No strict asset cap, income-driven eligibility.

Applies only in NYC; excludes large apartment buildings.

New York Foundation for Senior Citizens (NYFSC) Home Sharing Program

NYFSC Home Sharing

One participant must be 60+ (host or guest), NYC resident, able to share living space.

No strict limit, but targets those needing cost relief.

Not applicable; focus on housing need.

Primarily NYC-focused; limited slots due to demand.