Occupancy rate
21%
Tennessee average: 72%

We arrange tours, appointments, and even moving support so you don’t have to
Thank you for your interest!
Our team will be in touch shortly to help with next steps.
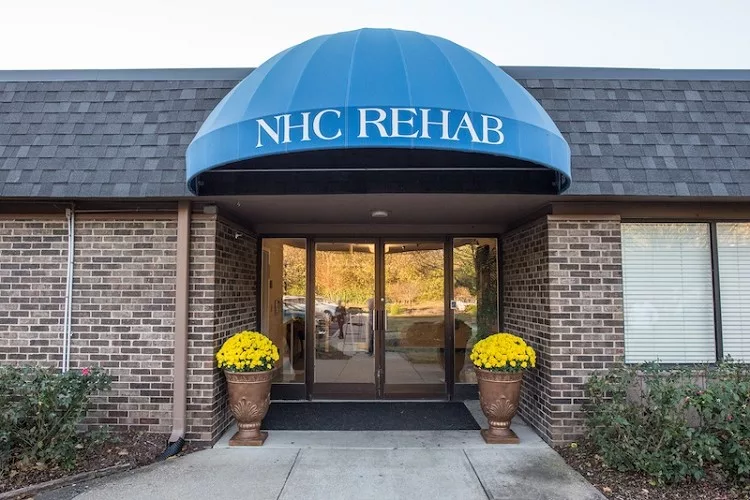
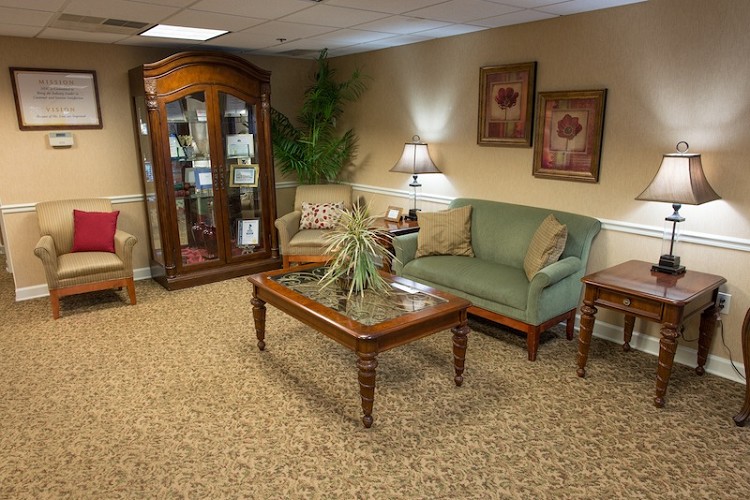
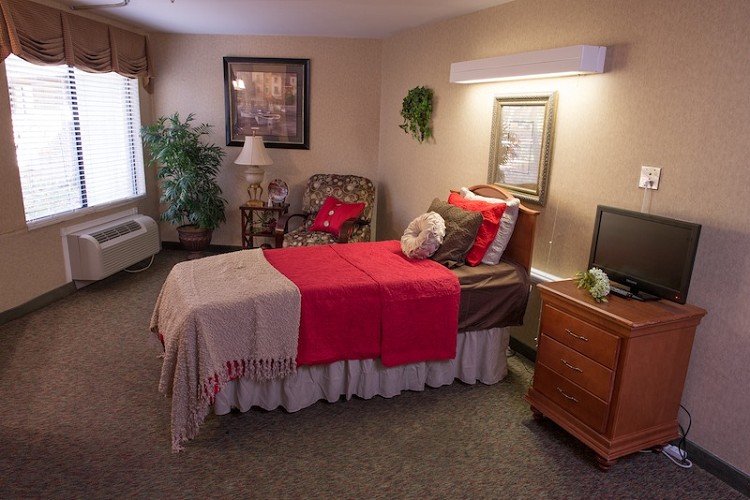
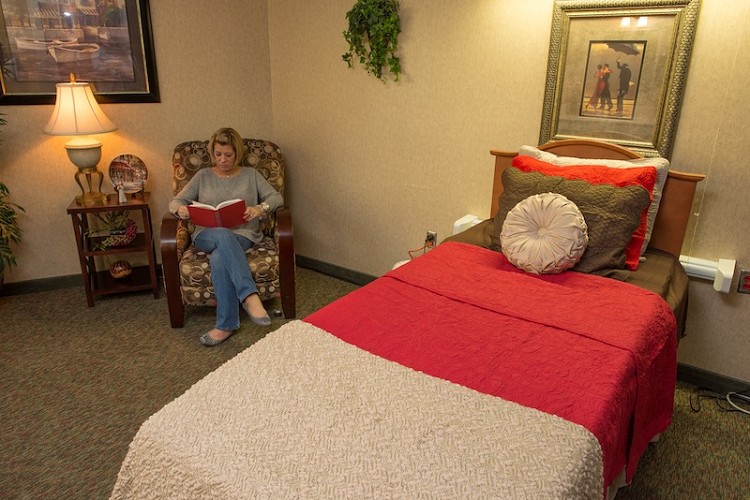
Nhc Healthcare in Franklin is an 80-bed, 24-hour skilled nursing healthcare center known for its reliability and expert team. With specialized physicians, nurse practitioners, therapists, and dedicated nursing staff, they ensure comprehensive care for residents. The facility boasts chef-approved meals curated by a dietitian and provides on-site rehabilitation and therapy services to enhance residents’ well-being. Daily assistance with personal living activities is a key offering, providing seniors with the support they need.
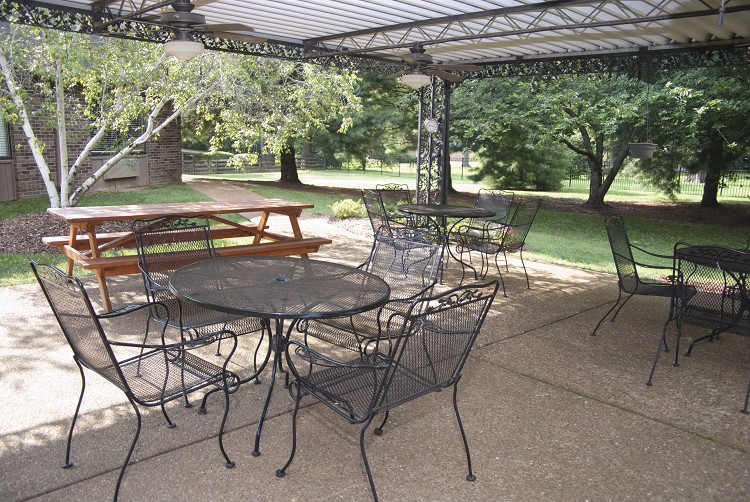
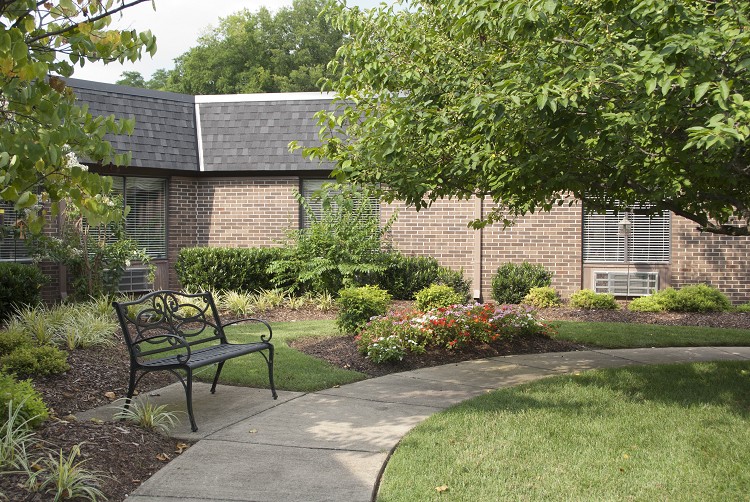
This community goes beyond the basics, offering a range of amenities and activities to enrich the lives of residents. From religious services and gardening areas to a beauty and barbershop, entertainment, housekeeping, and laundry services, NHC HealthCare strives to create a vibrant and comfortable environment for seniors. With a focus on both skilled nursing and the overall senior living experience, this facility stands as a reliable choice for those seeking quality care and an engaging community.
May offer a more intimate, personalized care environment.
Occupancy is moderate, suggesting balanced demand.
Residents typically stay for brief periods, with frequent admissions and discharges throughout the year.
27% of new residents, usually for short-term rehab.
66% of new residents, often for short stays.
7% of new residents, often for long-term daily care.
Tennessee average: 72%
NHC HealthCare in Franklin is legally operated by NHC HealthCare/Franklin, LLC, and administrated by Chelsey Foster Norris.
Key information about the people who lead and staff this community.
In Tennessee, the Department of Health, Division of Health Care Facilities performs unannounced inspections and investigations to ensure facilities provide high-quality resident care.
2 routine inspections
3 with issues
1 without issues
Tennessee average: 9 complaint visits
Deficiencies indicate regulatory issues. A higher number implies the facility had several areas requiring improvement.
Tennessee average: 17 deficiencies
Tennessee average 3.5
Last Health inspection on Oct 2025
Tennessee average 15.4
Tennessee average 4.39
Health citations are formal notices following inspections when they fail to comply with safety and care standards.
8 of 9 citations resulted from standard inspections; and 1 of 9 resulted from complaint investigations.
Tennessee average: 1.1
Tennessee average: 0.6
Data sourced from CMS Health Deficiencies reports. Citation severity codes range from A (least serious) to L (most serious). Immediate Jeopardy (J-L) citations indicate situations where the facility's noncompliance has placed residents at risk of death or serious harm.
Assisted Living A licensed, long-term care setting for seniors or individuals with disabilities who need help with daily activities — like bathing, dressing, and medication management — but not 24-hour skilled nursing. Offers housing, meals, and around-the-clock support while aiming to maximize resident independence.
Nursing Home Licensed facility providing 24/7 skilled nursing care for residents with complex, ongoing medical needs. Staffed by RNs, LPNs, and CNAs. Inspected and star-rated annually by CMS. Accepts Medicare (short-term rehab) and Medicaid (long-term care).
Respite Care Short-term temporary care — days to weeks — to give family caregivers a break. Full care provided during the stay. Often used after hospitalization or to trial a facility before a permanent placement decision.
Nursing Home Licensed facility providing 24/7 skilled nursing care for residents with complex, ongoing medical needs. Staffed by RNs, LPNs, and CNAs. Inspected and star-rated annually by CMS. Accepts Medicare (short-term rehab) and Medicaid (long-term care).
Assisted Living A licensed, long-term care setting for seniors or individuals with disabilities who need help with daily activities — like bathing, dressing, and medication management — but not 24-hour skilled nursing. Offers housing, meals, and around-the-clock support while aiming to maximize resident independence.
Home Care Professional care delivered in the person's own home — from companionship and errands to skilled nursing and therapy. Allows seniors to age in place. Medicare covers skilled home health when medically necessary.
Memory Care Secured, specialized care for people living with Alzheimer's or dementia. Staff trained in cognitive impairment, with higher staff-to-resident ratios and an environment designed to reduce confusion and wandering risk.
Nursing Home Licensed facility providing 24/7 skilled nursing care for residents with complex, ongoing medical needs. Staffed by RNs, LPNs, and CNAs. Inspected and star-rated annually by CMS. Accepts Medicare (short-term rehab) and Medicaid (long-term care).
Assisted Living A licensed, long-term care setting for seniors or individuals with disabilities who need help with daily activities — like bathing, dressing, and medication management — but not 24-hour skilled nursing. Offers housing, meals, and around-the-clock support while aiming to maximize resident independence.
![]() 1.6 miles from city center — 0.31 miles to nearest hospital (GracePointe Healthcare)
1.6 miles from city center — 0.31 miles to nearest hospital (GracePointe Healthcare)
![]() 216 Fairground St, Franklin, TN 37064
216 Fairground St, Franklin, TN 37064
Add your location
This data corresponds to Q2 2025 and is based on CMS Payroll-Based Journal.
Tennessee average ratio: 1.79:1
Tennessee average: 8.3 hours
Manages medical care and health needs.
No contractors work on this role.
Assists with medical care and medications.
No contractors work on this role.
Helps with daily care and mobility.
No contractors work on this role.
Total hours from contractors
62 contractor hours this quarter
| Certified Nursing Assistant | 46 | 0 | 46 | 13,342 | 91 | 100% | 10.3 |
| Licensed Practical Nurse | 18 | 0 | 18 | 6,267 | 91 | 100% | 10 |
| Registered Nurse | 14 | 0 | 14 | 2,988 | 90 | 99% | 10.6 |
| Mental Health Service Worker | 3 | 1 | 4 | 1,140 | 65 | 71% | 6.9 |
| Clinical Nurse Specialist | 3 | 0 | 3 | 995 | 67 | 74% | 8.3 |
| Speech Language Pathologist | 2 | 0 | 2 | 836 | 67 | 74% | 7 |
| Physical Therapy Aide | 3 | 0 | 3 | 684 | 73 | 80% | 6 |
| Physical Therapy Assistant | 7 | 0 | 7 | 659 | 68 | 75% | 4.9 |
| Administrator | 1 | 0 | 1 | 480 | 60 | 66% | 8 |
| Nurse Practitioner | 1 | 0 | 1 | 480 | 60 | 66% | 8 |
| Respiratory Therapy Technician | 7 | 0 | 7 | 450 | 66 | 73% | 4.1 |
| Dietitian | 1 | 0 | 1 | 423 | 53 | 58% | 8 |
| Respiratory Therapist | 2 | 0 | 2 | 399 | 54 | 59% | 7.4 |
| Occupational Therapy Aide | 2 | 0 | 2 | 263 | 46 | 51% | 5.7 |
| Qualified Activities Professional | 1 | 0 | 1 | 176 | 27 | 30% | 6.5 |
| RN Director of Nursing | 1 | 0 | 1 | 146 | 34 | 37% | 4.3 |
| Qualified Social Worker | 1 | 0 | 1 | 122 | 20 | 22% | 6.1 |
| Dental Services Staff | 1 | 0 | 1 | 56 | 43 | 47% | 1.3 |
| Occupational Therapy Assistant | 0 | 1 | 1 | 18 | 3 | 3% | 5.8 |
| Other Physician | 0 | 1 | 1 | 1 | 3 | 3% | 0.3 |
Source: CMS Long-Term Care Facility Characteristics (Data as of Jan 2026)
Residents meet regularly to discuss policies, care quality, and activities
State-approved Nurse Aide Training and Competency Evaluation Program on-site
Organized group of residents that meets regularly to discuss facility policies, quality of life, and activities.
Data sourced from CMS Long-Term Care Facility Characteristics quarterly report. Payer mix reflects the current resident census by primary payment source.
These measures show how residents usually do over time at this home, based on health outcomes and preventive care.
Tennessee average: 10.5
Tennessee average: 19.5
Tennessee average: 16.0%
Tennessee average: 21.7%
Tennessee average: 20.7%
Tennessee average: 3.7%
Tennessee average: 5.4%
Tennessee average: 2.1%
Tennessee average: 6.3%
Tennessee average: 11.0%
Tennessee average: 16.5%
Tennessee average: 89.9%
Tennessee average: 94.5%
Tennessee average: 1.58
Tennessee average: 1.57
Tennessee average: 79.7%
Tennessee average: 1.7%
Tennessee average: 79.8%
Tennessee average: 22.2%
Tennessee average: 11.2%
Tennessee average: 0.8%
Tennessee average: 53.7%
Tennessee average: 50.6%
Quality measures are calculated from Minimum Data Set (MDS) assessments. For most measures, lower percentages indicate better care quality.
Historical financial and operational data for NHC HealthCare in Franklin based on CMS SNF Cost Reports.
Loading trend charts...
Care Cost Calculator: See Prices in Your Area
Nursing Home Data Explorer
Don’t Wait Too Long: 7 Red Flag Signs Your Parent Needs Assisted Living Now
The True Cost of Assisted Living in 2025 – And How Families Are Paying For It
Understanding Senior Living Costs: Pricing Models, Discounts & Financial Assistance

Touring a community? Use this expert-backed checklist to stay organized, ask the right questions, and find the perfect fit.
We'll send you a PDF version of the touring checklist.