North Auburn Rehabilitation & Health Center

Nursing Home

North Auburn Rehabilitation & Health Center

2830 I St NE, Auburn, WA 98002 View Map
Nursing Home
icon
Care Cost Calculator: See Prices in Your Area Care Cost Calculator: See Prices in Your Area icon
Overview of North Auburn Rehabilitation & Health Center

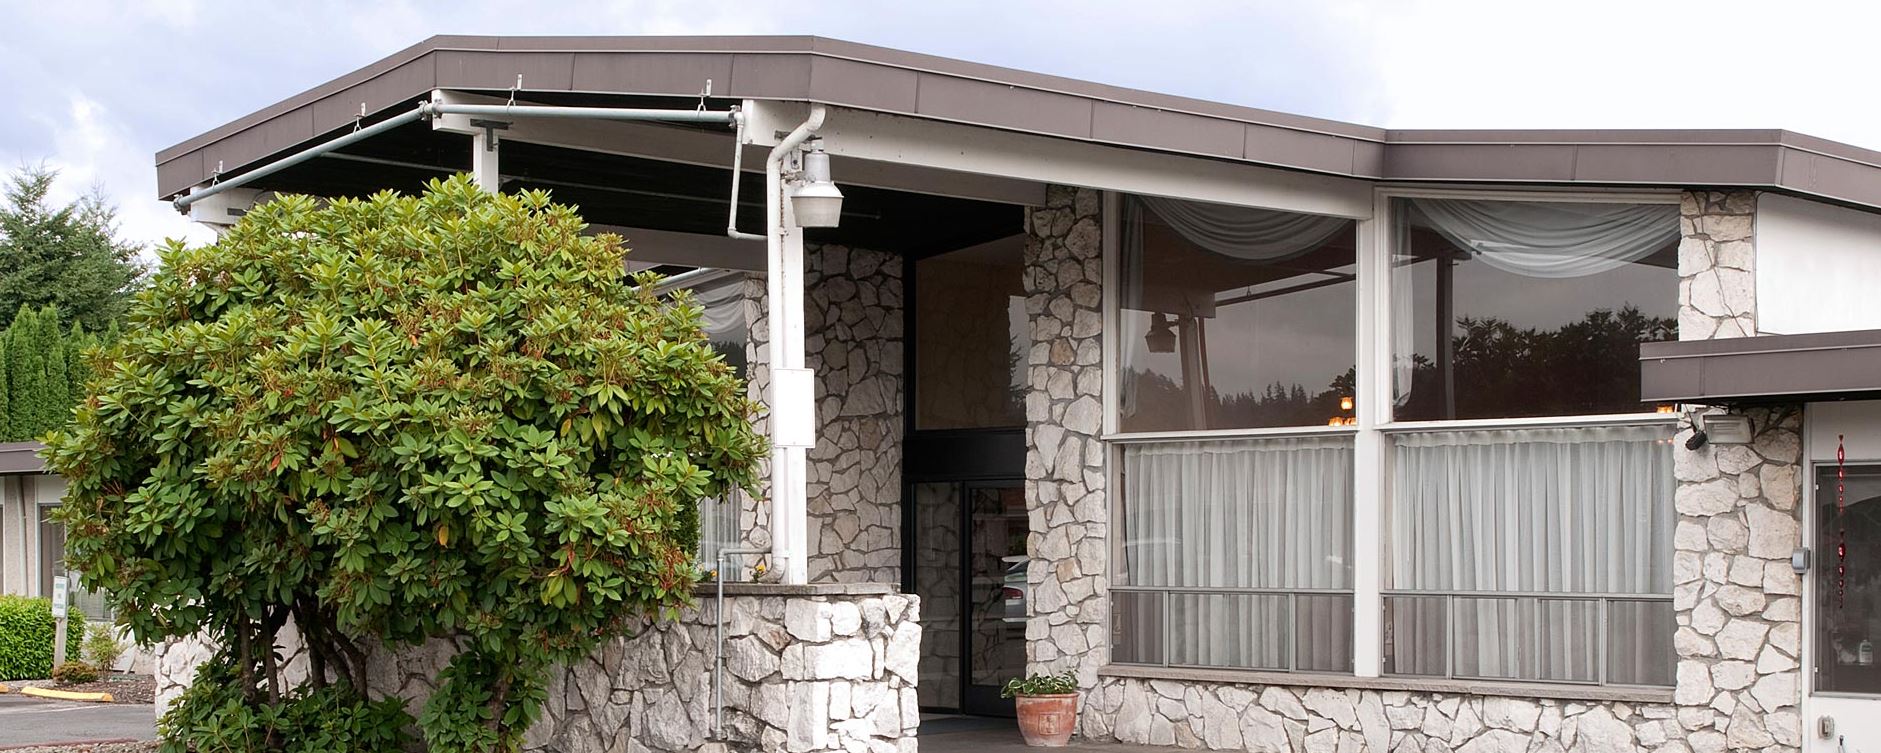
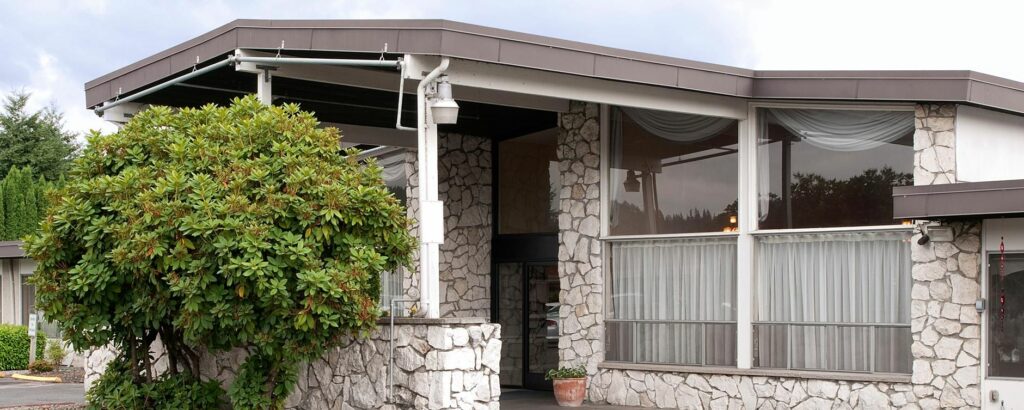
North Auburn Rehabilitation & Health Center is a leading provider of long-term skilled nursing care and short-term rehabilitation solutions, offering a full continuum of services and care focused around each individual in today’s ever-changing health care environment. The center, which has been serving the entire Puget Sound region since 1967, is conveniently located in a quiet residential neighborhood near a variety of shopping centers and community parks, and is next door to Parkside Retirement and Assisted Living Community, with Auburn Regional Medical Center just two miles away.

North Auburn Rehabilitation & Health Center is Medicare and Medicaid certified, ensuring that it meets the highest standards of care. The center offers a range of healthcare services, including short-term care, traditional/long-term care, post-operative care, and respiratory services. To help instill confidence that health and well-being will be maintained after discharge, North Auburn Rehabilitation & Health Center’s Extend to Home program provides a home wellness plan that includes regular follow-up with patients to assist in a smooth transition home and/or offer additional assistance after discharge. During a patient’s stay, therapists provide training and tips on how to continue the rehabilitation and strengthening process at home, while nurses give instruction on how to successfully manage any ongoing medical needs. The staff also educates patients on community resources and other safety considerations.

(253) 561-8100

Managed by Rose Jumawan

Executive Director

Rose Jumawan serves as the Executive Director at North Auburn Rehabilitation & Health Center, where she leads with a warm and respectful approach, treating every resident like family. She is committed to attentive care and fostering a welcoming community environment.

Quality ratings

Measured by Centers for Medicare & Medicaid Services (CMS)

Overall rating Info Official CMS rating based on health inspections, staffing and quality measures.
3/5
Washington average: 3.2/5
Health Inspection Info Official CMS rating based on deficiencies found during state health inspections.
2/5
Washington average: 2.8/5
Staffing Info Official CMS rating based on nurse staffing hours per resident per day.
4/5
Washington average: 3.4/5
Quality Measures Info Official CMS rating based on clinical outcomes for residents.
5/5
Washington average: 3.9/5

Nursing care per resident

Info Average daily nursing hours per resident (adjusted for acuity). Higher values indicate more nursing time per resident.
4h 20m per day

This home provides 3% more nursing time per resident than the state average.

Washington average: 4h 13m per day

Staffing hours breakdown

Info Hours of care per resident per day, broken down by staff type. Data from CMS Medicare.
Staff type Facility State avg National avg
Registered Nurse (RN) Info Registered nurse hours per resident per day. 50m per day 53m per day 41m per day
LPN / LVN Info Licensed Practical Nurse / Licensed Vocational Nurse hours per resident per day. 45m per day 49m per day 52m per day
Nurse Aide Info Nurse aide hours per resident per day. 2h 43m per day 2h 41m per day 2h 21m per day
Total Nursing (Weekend) Info Total number of nurse staff hours per resident per day on weekends. 3h 40m per day 3h 47m per day 3h 26m per day
Physical Therapist Info Physical therapist staff hours per resident per day. 5m per day 5m per day 4m per day
RN (Weekend) Info Registered nurse hours per resident per day on weekends. 30m per day 38m per day 29m per day

Capacity and availability

Medium-capacity home

Offers a balance of services and community atmosphere.

Total beds 125

This home usually has availability

Lower occupancy suggests more openings may be available.

Lower demand than the Washington average
Occupancy rate 57.9%
Residents per day (avg) 65
Occupancy rate
57.9%
Residents per day (avg)
65

Who this home usually serves

TYPE OF STAY

Primarily short stays

Residents typically stay for brief periods, with frequent admissions and discharges throughout the year.

Might be optimal for
Post-acute recovery Temporary care Transitional stays

Breakdown by payment type

Medicare

18% of new residents, usually for short-term rehab.

Typical stay 1 - 2 months

Private pay

67% of new residents, often for short stays.

Typical stay 26 days

Medicaid

15% of new residents, often for long-term daily care.

Typical stay 1 years

Finances and operations

Proprietary home
Corporation
Home revenue
$12.0M
Profit
$1.2M
Proprietary home Corporation
Home revenue
$12,017,394.00
Profit
$1,155,299.00
Payroll costs Info The portion of the home's budget spent on staff, including nurses, caregivers, and other employees who support care and operations.
$4.5M
37.4% of revenue
Other operating costs Info All remaining costs needed to run the home, such as food, utilities, building maintenance, supplies and administrative expenses.
$6.4M
Total costs $10.9M
Years in operation
37 years in operation
A longer operating history, which may indicate experience navigating regulations and delivering ongoing care.
Walk Score
Walk Score: 58 / 100
Moderately walkable. Some errands can be accomplished on foot, with a mix of nearby amenities.

Staffing

Key information about the people who lead and staff this community.

Leadership

Contact: Ms. Allison Jenkins, Administrator

What does this home offer?

Building type icon
Building type icon

Building Type: Single-story

Fitness and recreation icon

Fitness and Recreation

Types of Care at North Auburn Rehabilitation & Health Center

Nursing Home

Compare Nursing Homes around Tacoma

The information below is reported by the Washington Department of Social and Health Services, Residential Care Services.
North Auburn Rehabilitation & Health Center
SNF

Nursing Homes 24/7 care needed

Auburn
125
No
58
DENOR, JOSEPH
57.9%
$11,488,771.00
$4,492,033.00
39.1%
64.50
3/5
4.3347
2/5
4/5
5/5
3
100
5
-46%
+3%
-20%

Places of interest near North Auburn Rehabilitation & Health Center

Address 16.6 miles from city center — 5.8 miles to nearest hospital (St. Francis Hospital)

Address 2830 I St NE, Auburn, WA 98002

Calculate Travel Distance to North Auburn Rehabilitation & Health Center

Add your location

Address

Staffing Data

Source: CMS Payroll-Based Journal (Q2 2025)

95
Total Staff
92
Employees
3
Contractors
30,873
Total Hours (Quarter)
41
Avg Staff/Day
8.3
Avg Shift (hrs)
Nursing Staff Breakdown
Role Count Avg Shift (hrs) Uses Contractors?
Registered Nurse79.9 No
Licensed Practical Nurse139.6 No
Certified Nursing Assistant448.3 No
Staff by Category
Administration
2 staff
6.8hs shift avg
Nursing Staff
64 staff
8.7hs shift avg
Physicians & Practitioners
13 staff
7.9hs shift avg
Therapy Services
11 staff
5.3hs shift avg
Activities & Recreation
0 staff
0hs shift avg
Social Services
1 staff
1.5hs shift avg
Dietary Services
2 staff
7.3hs shift avg
Other Services
2 staff
8.2hs shift avg
Contractor Analysis
0.2%
of total hours from contractors
58 contractor hours this quarter
Occupational Therapy Assistant: 2 Medical Director: 1
Role Employees Contractors Total Staff Total Hours Days Worked % of Days Avg Shift (hrs)
Certified Nursing Assistant4404417,78391100%8.3
Licensed Practical Nurse130134,28491100%9.6
Registered Nurse7072,66891100%9.9
Clinical Nurse Specialist9091,7137684%7.9
Dental Services Staff1015356369%8.5
Administrator1015126470%8
Respiratory Therapy Technician2024956268%8
Mental Health Service Worker1014886167%8
Dietitian1014776774%7.1
Other Dietary Services Staff1014736369%7.5
Nurse Practitioner4043764651%8.2
Speech Language Pathologist1013705560%6.7
Physical Therapy Aide2023626571%5.6
Physical Therapy Assistant3031624853%3.3
Occupational Therapy Aide1011062123%5
Occupational Therapy Assistant022343437%1
Medical Director011241516%1.6
Qualified Social Worker10113910%1.5

Health Inspection History

Inspections
Total health inspections 8

Washington average 7.8


Last Health inspection on Apr 2025

Total health citations 100
Citations per inspection
12.5

Health citations are formal notices following inspections when they fail to comply with safety and care standards.

89 of 100 citations resulted from standard inspections; 7 of 100 resulted from complaint investigations; and 4 of 100 came from combined inspections (standard and complaint).

Breakdown of citation severity (last 3 years)
Critical Health citations More info 3
900% worse than Washington average

Washington average: 0.3


Serious Health citations More info 2
18% worse than Washington average

Washington average: 1.7

3 critical citations More info Washington average: 0.3

2 serious citations More info Washington average: 1.7

95 moderate citations More info Washington average: 46.3

0 minor citations More info Washington average: 0.5
Citations history (last 3 years)
Infection Control moderate citation Apr 21, 2025
Corrected

Nutrition moderate citation Apr 21, 2025
Corrected

Pharmacy moderate citation Apr 21, 2025
Corrected

Pharmacy moderate citation Apr 21, 2025
Corrected

Facility Characteristics

Source: CMS Long-Term Care Facility Characteristics (Data as of Jan 2026)

Ownership: For-Profit LLC
Part of: Caldera Care LLC
Resident Census by Payment Source
64 Total Residents
Medicare 5 (7.8%)
Medicaid 56 (87.5%)
Private Pay/Other 3 (4.7%)
Programs & Services
Residents' Group
Family Engagement

Active councils help families stay involved in care decisions and facility operations.

Quality of care over time

These measures show how residents usually do over time at this home, based on health outcomes and preventive care.

High-risk clinical events score Info A composite score based on pressure ulcers, falls with injury, weight loss, walking ability decline, and activities of daily living decline. 6.6
34% better than Washington average

Washington average: 10.0

Functional decline score Info A composite score based on activities of daily living decline, walking ability decline, and incontinence. 10.9
48% better than Washington average

Washington average: 20.9

Long-stay resident measures
Need for Help with Daily Activities Increased Info Percent of long-stay residents whose need for help with daily activities has increased 7.8%
53% better than Washington average

Washington average: 16.4%

Walking Ability Worsened Info Percent of long-stay residents whose ability to move independently worsened 7.3%
66% better than Washington average

Washington average: 21.8%

Low Risk Residents with Bowel/Bladder Incontinence Info Percent of low risk long-stay residents who lose control of their bowels or bladder 17.5%
28% better than Washington average

Washington average: 24.3%

Falls with Major Injury Info Percent of long-stay residents experiencing one or more falls with major injury 1.8%
30% better than Washington average

Washington average: 2.6%

High Risk Residents with Pressure Ulcers Info Percent of long-stay high risk residents with pressure ulcers 12.3%
151% worse than Washington average

Washington average: 4.9%

Urinary Tract Infection Info Percent of long-stay residents with a urinary tract infection 1.8%
5% worse than Washington average

Washington average: 1.7%

Lost Too Much Weight Info Percent of long-stay residents who lose too much weight 3.7%
36% better than Washington average

Washington average: 5.8%

Depressive Symptoms Info Percent of long-stay residents who have depressive symptoms 0.5%
97% better than Washington average

Washington average: 16.2%

Antipsychotic Use Info Percent of long-stay residents who received an antipsychotic medication 11.2%
22% better than Washington average

Washington average: 14.5%

Pneumococcal Vaccine Info Percent of long-stay residents assessed and appropriately given the pneumococcal vaccine 97.7%
In line with Washington average

Washington average: 96.2%

Influenza Vaccine Info Percent of long-stay residents assessed and appropriately given the seasonal influenza vaccine 90.2%
In line with Washington average

Washington average: 93.8%

Short-stay resident measures
Pneumococcal Vaccine Info Percent of short-stay residents assessed and appropriately given the pneumococcal vaccine 86.3%
In line with Washington average

Washington average: 88.1%

Antipsychotic medication increase Info Percent of short-stay residents who newly received an antipsychotic medication 2.1%
46% worse than Washington average

Washington average: 1.4%

Influenza Vaccine Info Percent of short-stay residents assessed and appropriately given the seasonal influenza vaccine 66.3%
19% worse than Washington average

Washington average: 82.0%

Re-hospitalized after SNF stay Info Percentage of short-stay residents who were re-hospitalized after their nursing home admission. 17.4%
13% better than Washington average

Washington average: 19.9%

Emergency department visits Info Percentage of short-stay residents who had an outpatient emergency department visit. 9.7%
27% better than Washington average

Washington average: 13.2%

Falls with major injury Info Percentage of SNF residents who experience falls with major injury during their stay. 0.0%
100% better than Washington average

Washington average: 0.8%

Ability to care for self at discharge Info Percentage of residents at or above expected ability to care for themselves at discharge. 84.6%
58% better than Washington average

Washington average: 53.7%

Successful return to home or community Info Rate of successful return to home or community from a skilled nursing facility. 60.6%
20% better than Washington average

Washington average: 50.6%

Penalties and fines

Federal penalties imposed by CMS for regulatory violations, including civil money penalties (fines) and denials of payment for new Medicare/Medicaid admissions.

Source: CMS Penalties Database (Data as of Jan 2026)

Total fines amount $54K
34% lower than Washington average

Washington average: $82K

Number of fines 2
8% more fines than Washington average

Washington average: 1.8

Payment Denials Info Serious action where Medicare and/or Medicaid temporarily stops payments for new residents until issues are fixed. 0
100% fewer payment denials than Washington average

Washington average: 0.3

Fines amount comparison
This facility $54K
Washington average $82K
Penalty History

Penalties are imposed by CMS for violations of federal nursing home regulations.

Civil Money Penalty Info Fines imposed for noncompliance, which can be assessed per day or per instance of violation. Dec 14, 2023
$12K
Civil Money Penalty Info Fines imposed for noncompliance, which can be assessed per day or per instance of violation. May 26, 2023
$42K

Last updated: Jan 2026

Guides for Better Senior Living

Care Cost Calculator: See Prices in Your Area

Nursing Home Data Explorer

Don’t Wait Too Long: 7 Red Flag Signs Your Parent Needs Assisted Living Now

The True Cost of Assisted Living in 2025 – And How Families Are Paying For It

Understanding Senior Living Costs: Pricing Models, Discounts & Financial Assistance

Financial Aid for Washington Seniors

Get financial aid guidance

Community Options Program Entry System (COPES)

WA Medicaid COPES

Age 65+ or disabled, Washington resident, Medicaid-eligible, nursing home-level care need.

~$2,829/month (300% FBR, individual).

$2,000 (individual), $3,000 (couple).

High demand in urban areas (e.g., Seattle).

Washington Family Caregiver Support Program

WA NFCSP

Caregiver of someone 60+ (or with dementia), Washington resident.

No strict limit; prioritizes low-income.

Not applicable.

High urban demand; rural outreach.

Community First Choice (CFC)

Washington Community First Choice

Age 65+ (or disabled 18+), WA resident, Medicaid-eligible, need help with 2+ ADLs/IADLs.

~$2,829/month; QIT optional.

$2,000 (individual), $3,000 (couple).

Broader than COPES; serves ~20,000; self-directed option.

Older Americans Act (OAA) Services

Washington OAA Services

Age 60+, WA resident; no income/asset limits.

None; donations encouraged.

Not assessed.

13 AAAs; includes Meals on Wheels; rural focus.

Medicare Savings Program (MSP)

Washington Medicare Savings Program

Age 65+ or disabled, WA resident, Medicare Part A/B.

~$2,510/month (QMB), ~$3,380/month (SLMB), ~$3,598/month (QI)—individual.

$9,430 (individual), $14,130 (couple).

Includes Extra Help for Part D; no waitlist.

Low-Income Home Energy Assistance Program (LIHEAP)

Washington LIHEAP

Age 60+ prioritized, WA resident, low-income household.

~$3,970/month (185% FPL).

Not assessed.

Covers gas, electric, wood; emergency aid available.

Senior Community Service Employment Program (SCSEP)

Washington SCSEP

Age 55+, unemployed, low-income, WA resident.

~$1,983/month (125% FPL).

Not specified.

Priority for veterans, rural residents; AARP partnership.

VA Aid and Attendance (A&A) and Housebound Benefits

Washington VA Aid and Attendance/Housebound

Age 65+ or disabled veteran/spouse, WA resident, wartime service, ADL help (A&A) or homebound.

Net income < ~$1,984/month (veteran with dependent, A&A); pension offsets income.

~$155,356 (net worth).

High veteran use; supports rural/urban needs.

Senior Citizens Property Tax Exemption

Washington Senior Property Tax Exemption

Age 61+ or disabled retiree, WA resident, homeowner, income-based.

~$45,000-$70,000/year (varies by county, e.g., King: $70,000).

Not assessed; home value cap varies (~$250,000-$400,000).

Saves ~$500-$1,500/year; offered statewide.

Senior Farmers’ Market Nutrition Program (SFMNP)

Washington SFMNP

Age 60+, WA resident, low-income.

~$2,322/month (185% FPL).

Not assessed.

Vouchers (~$80/season); serves ~20,000 via AAAs.

Who we are

Your Senior Care Partner, Every Step of the Way

We help families find affordable senior communities and unlock same day discounts, Medicaid, and Medicare options tailored to your needs.

Contact us Today