Occupancy rate
89%

We arrange tours, appointments, and even moving support so you don’t have to


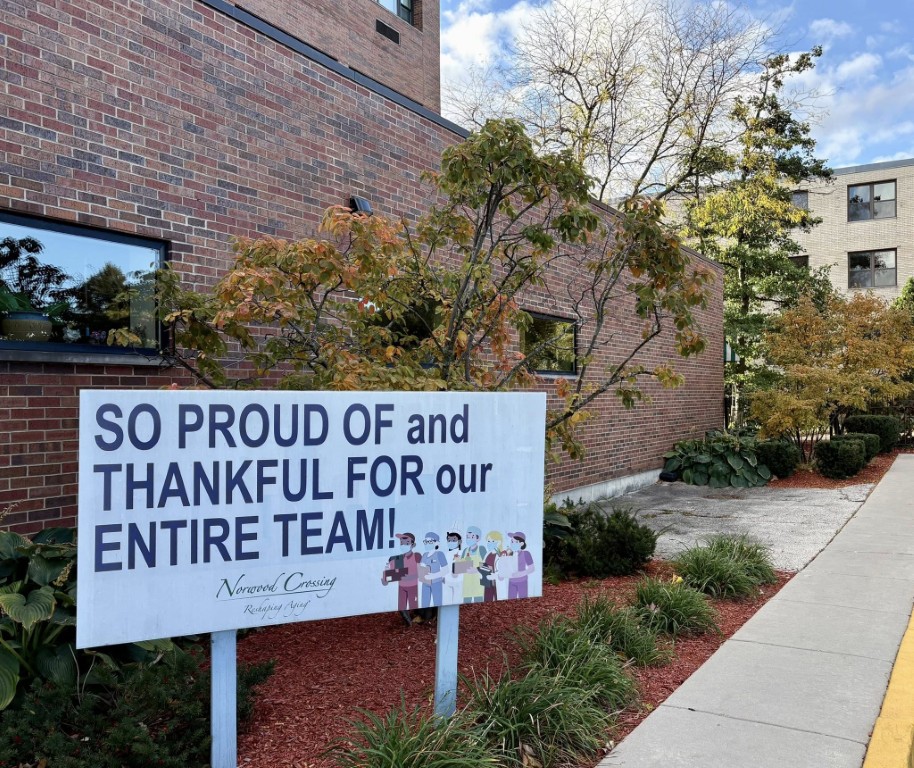

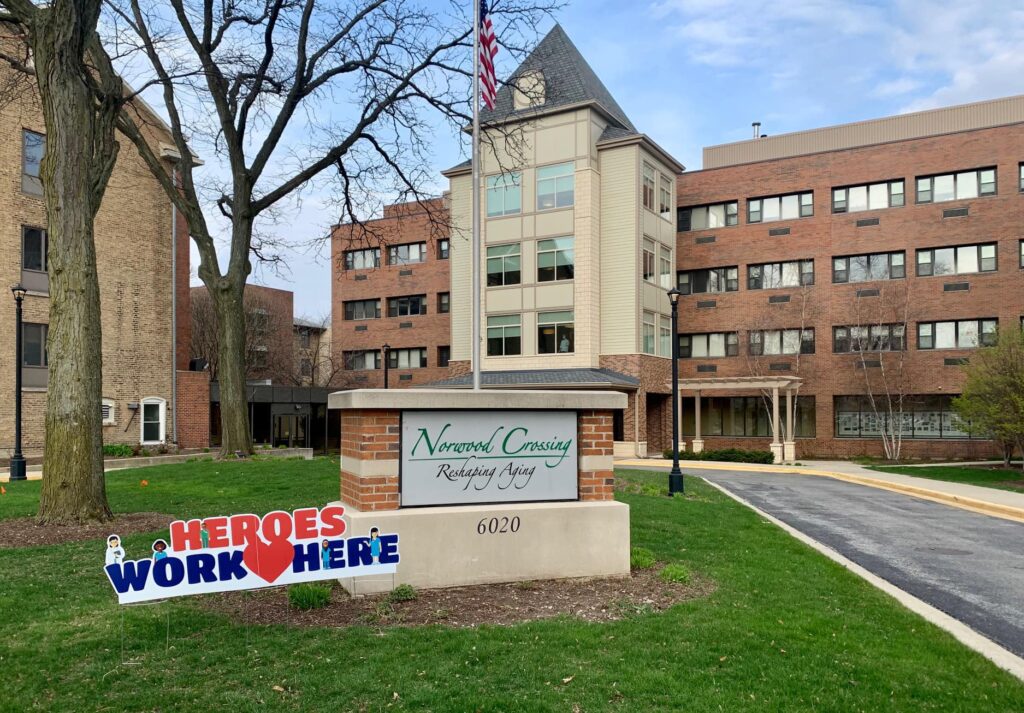
Norwood Crossing is a non-profit nursing home in Chicago, IL, that offers a wide range of care options, including assisted living, memory care, skilled nursing, rehabilitation, and respite care. Promoting a home-like atmosphere, the community ensures older adults are treated like family. Nutritious meals, recreational activities, and household services are also offered, ensuring older adults experience maintenance-free living. Through individualized care options, the community strives to help residents thrive in their later years.
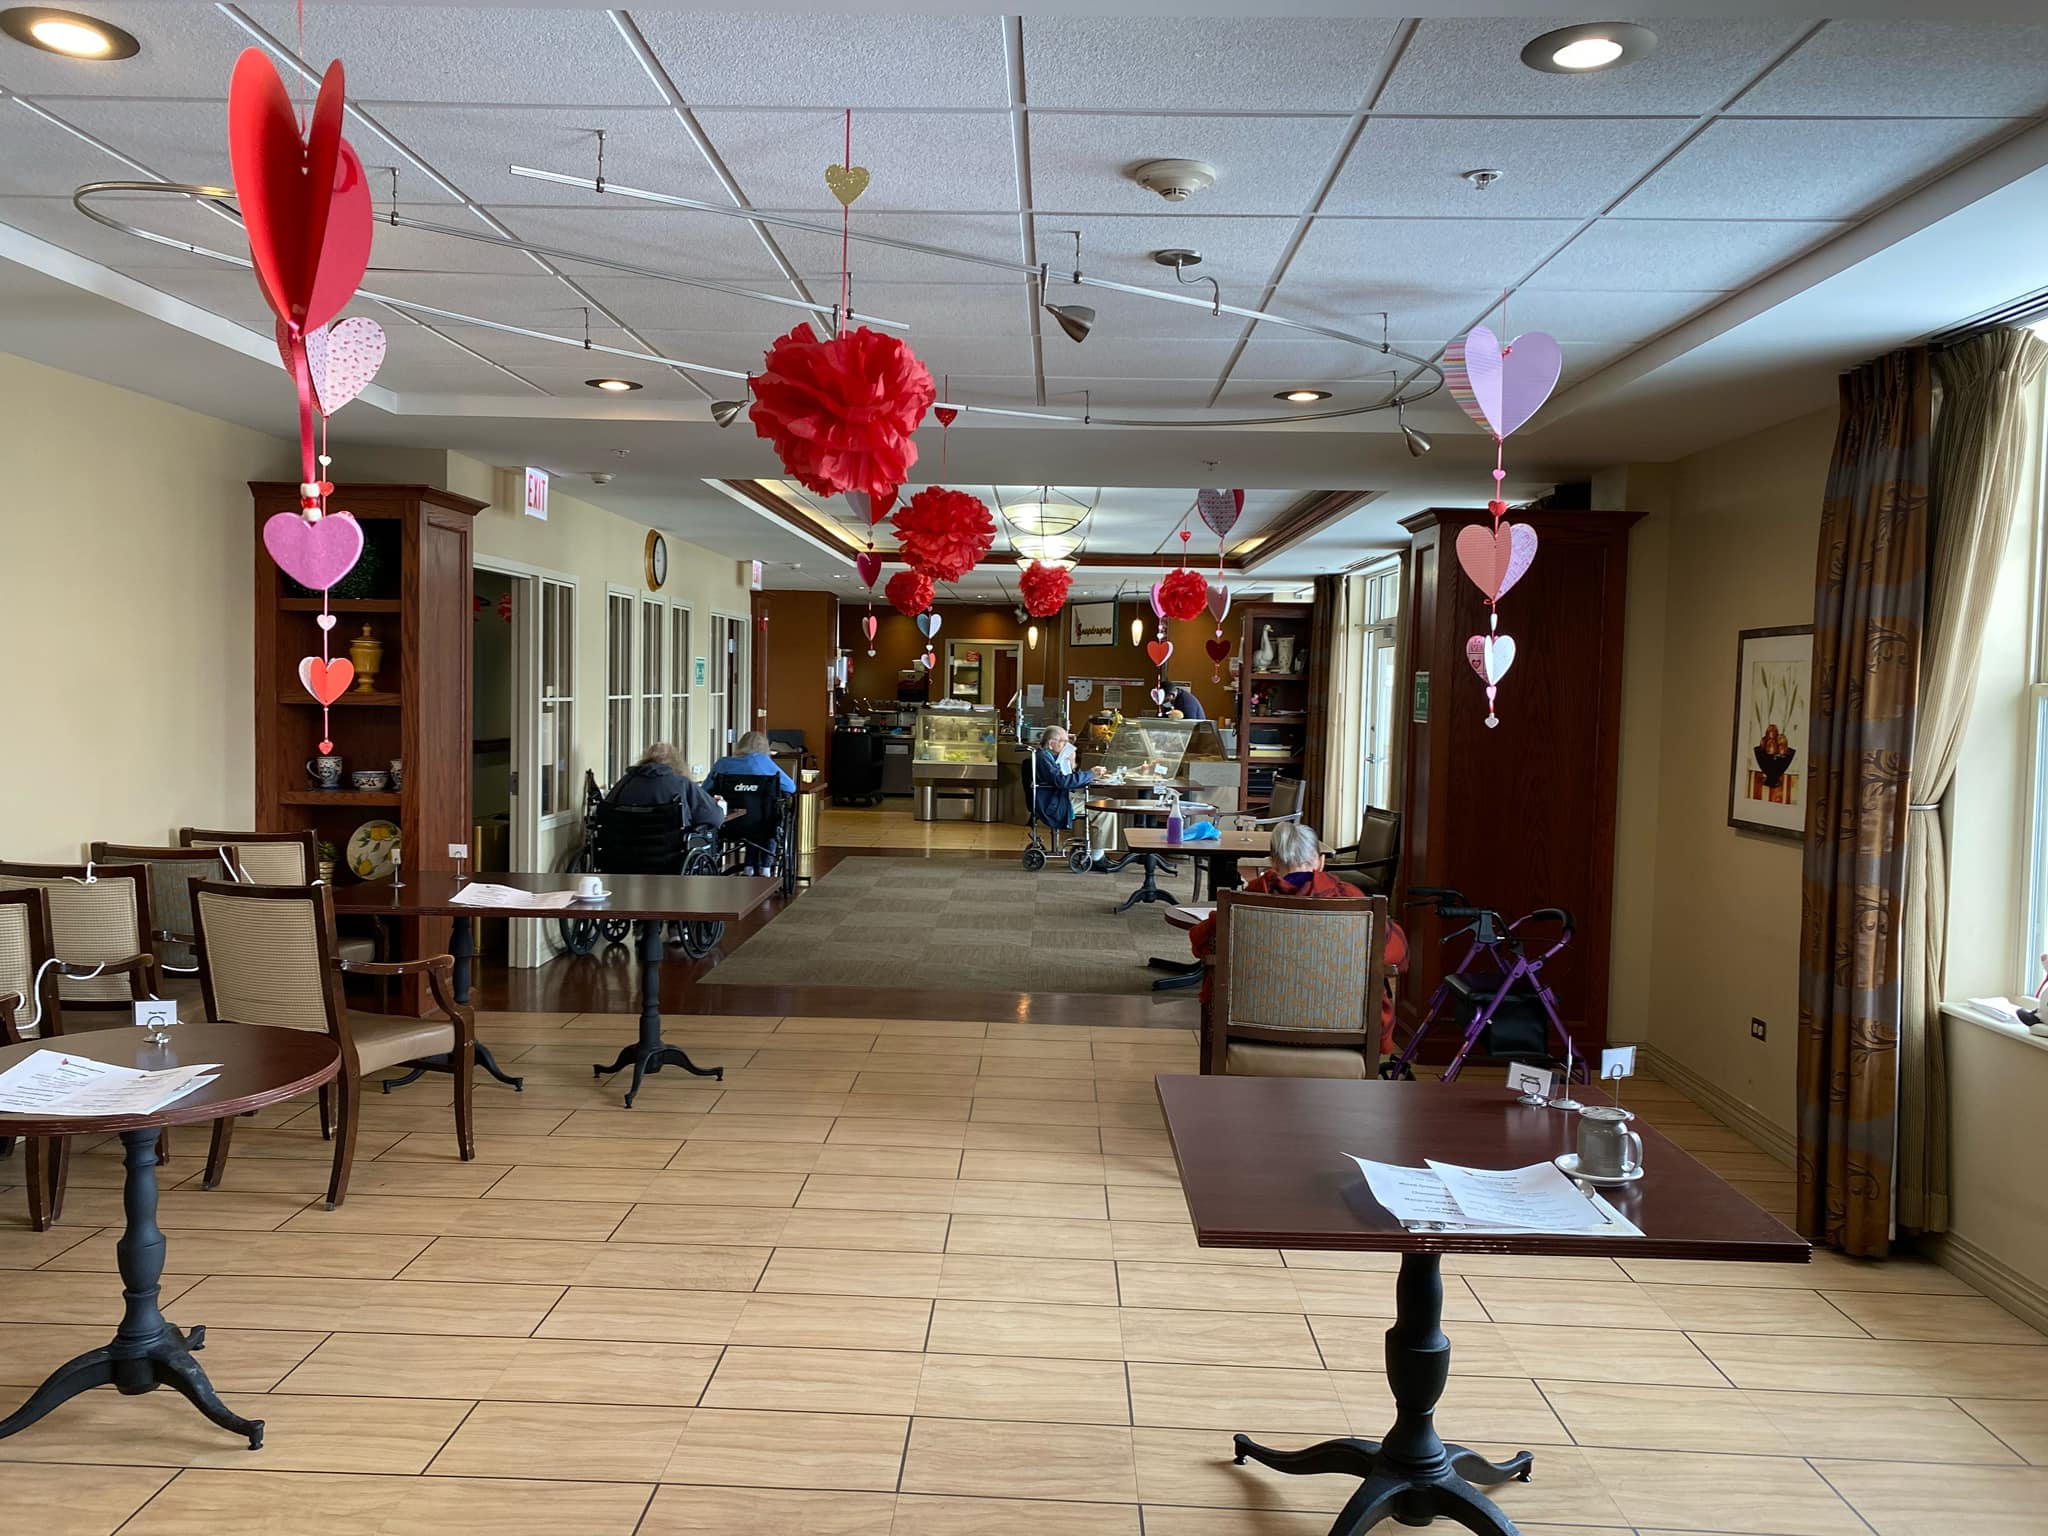
Fun games, light exercises, and social events are just some of the activities that residents can participate in for leisure and wellness. Cozy living spaces, accessible hallways, and lively gathering areas make the community an ideal retirement option. With its ideal location along North Avondale Avenue, near public transportation and restaurants, residents gain easy access to their necessities and leisure. As one of the best options for retirement in Illinois, this nursing home has comprehensive care options and extensive amenities dedicated to older adults’ welfare.
 Official CMS rating based on health inspections, staffing and quality measures.
Official CMS rating based on deficiencies found during state health inspections.
Official CMS rating based on nurse staffing hours per resident per day.
Official CMS rating based on clinical outcomes for residents.
Average daily nursing hours per resident (adjusted for acuity). Higher values indicate more nursing time per resident.
Official CMS rating based on health inspections, staffing and quality measures.
Official CMS rating based on deficiencies found during state health inspections.
Official CMS rating based on nurse staffing hours per resident per day.
Official CMS rating based on clinical outcomes for residents.
Average daily nursing hours per resident (adjusted for acuity). Higher values indicate more nursing time per resident.
May offer a more intimate, personalized care environment.
Occupancy is moderate, suggesting balanced demand.
Most residents typically stay for a few weeks or months before returning home or moving on.
68% of new residents, usually for short-term rehab.
23% of new residents, often for short stays.
9% of new residents, often for long-term daily care.
The portion of the home's budget spent on staff, including nurses, caregivers, and other employees who support care and operations.
All remaining costs needed to run the home, such as food, utilities, building maintenance, supplies and administrative expenses.
Norwood Crossing is legally operated by NORWOOD CROSSING ASSOCIATION.
Housing Options: Studio / 1 Bed / 2 Bed
Building Type: Mid-rise
Dining Services
Transportation Services
Social and Recreational Activities
Exercise Programs

On-site Medical Care and Health Services
In Illinois, the Department of Public Health, Office of Health Care Regulation conducts annual unannounced surveys to assess compliance with state and federal healthcare facility standards.
1 visits/inspections triggered by complaints
The most recent inspection on May 22, 2025, was a complaint investigation in which the facility was found to be in compliance with applicable assisted living and shared housing regulations. The prior inspection on January 8, 2025, also found the facility in compliance during the annual licensure survey. There were no deficiencies cited in either report, and no enforcement actions or fines were listed in the available reports. Complaint investigations have not resulted in substantiated issues. The inspection history shows consistent compliance with regulatory requirements.
Illinois average 10.4
Last Health inspection on Feb 2025
Health citations are formal notices following inspections when they fail to comply with safety and care standards.
24 of 29 citations resulted from standard inspections; and 5 of 29 resulted from complaint investigations.
Illinois average: 0.7
Illinois average: 3.6
Data sourced from CMS Health Deficiencies reports. Citation severity codes range from A (least serious) to L (most serious). Immediate Jeopardy (J-L) citations indicate situations where the facility's noncompliance has placed residents at risk of death or serious harm.
Nursing Home 24/7 care needed
Assisted Living For seniors needing help with daily tasks but not full-time nursing.
Memory Care Specialized care for those with Memory Loss, Alzheimer's, or dementia, ensuring safety and support.
Respite Care
Assisted Living For seniors needing help with daily tasks but not full-time nursing.
Independent Living For self-sufficient seniors seeking community and minimal assistance.
Memory Care Specialized care for those with Memory Loss, Alzheimer's, or dementia, ensuring safety and support.
Nursing Homes 24/7 care needed
Assisted Living For seniors needing help with daily tasks but not full-time nursing.
Hospice Care
Memory Care Specialized care for those with Memory Loss, Alzheimer's, or dementia, ensuring safety and support.
Assisted Living For seniors needing help with daily tasks but not full-time nursing.
Independent Living For self-sufficient seniors seeking community and minimal assistance.
Memory Care Specialized care for those with Memory Loss, Alzheimer's, or dementia, ensuring safety and support.
Nursing Homes 24/7 care needed
Assisted Living For seniors needing help with daily tasks but not full-time nursing.
Independent Living For self-sufficient seniors seeking community and minimal assistance.
Respite Care
![]() 12.1 miles from city center
12.1 miles from city center
![]() 6016 N Nina Ave, Chicago, IL 60631
6016 N Nina Ave, Chicago, IL 60631
Add your location
Source: CMS Payroll-Based Journal (Q2 2025)
| Role ⓘ | Count ⓘ | Avg Shift (hrs) ⓘ | Uses Contractors? ⓘ |
|---|---|---|---|
| Registered Nurse | 68 | 8 | Yes |
| Licensed Practical Nurse | 2 | 6.6 | No |
| Certified Nursing Assistant | 160 | 8.5 | Yes |
| Role ⓘ | Employees ⓘ | Contractors ⓘ | Total Staff ⓘ | Total Hours ⓘ | Days Worked ⓘ | % of Days ⓘ | Avg Shift (hrs) ⓘ |
|---|---|---|---|---|---|---|---|
| Certified Nursing Assistant | 73 | 87 | 160 | 27,031 | 91 | 100% | 8.5 |
| Registered Nurse | 38 | 30 | 68 | 12,883 | 91 | 100% | 8 |
| Other Dietary Services Staff | 8 | 0 | 8 | 2,877 | 91 | 100% | 7.5 |
| Clinical Nurse Specialist | 4 | 0 | 4 | 1,736 | 81 | 89% | 7.5 |
| Speech Language Pathologist | 0 | 6 | 6 | 1,132 | 70 | 77% | 7.5 |
| Physical Therapy Aide | 0 | 6 | 6 | 1,107 | 68 | 75% | 7.5 |
| Licensed Practical Nurse | 2 | 0 | 2 | 899 | 82 | 90% | 6.6 |
| Mental Health Service Worker | 2 | 0 | 2 | 878 | 70 | 77% | 7.4 |
| Respiratory Therapy Technician | 0 | 2 | 2 | 543 | 66 | 73% | 8.1 |
| Physical Therapy Assistant | 0 | 2 | 2 | 525 | 65 | 71% | 7.9 |
| Dietitian | 1 | 1 | 2 | 491 | 64 | 70% | 7.3 |
| Administrator | 1 | 0 | 1 | 488 | 66 | 73% | 7.4 |
| Qualified Social Worker | 0 | 1 | 1 | 482 | 61 | 67% | 7.9 |
| Occupational Therapy Aide | 1 | 0 | 1 | 480 | 64 | 70% | 7.5 |
| Medical Director | 0 | 1 | 1 | 208 | 26 | 29% | 8 |
| Occupational Therapy Assistant | 0 | 3 | 3 | 57 | 46 | 51% | 1.1 |
Source: CMS Long-Term Care Facility Characteristics (Data as of Jan 2026)
Residents meet regularly to discuss policies, care quality, and activities
Organized group of residents that meets regularly to discuss facility policies, quality of life, and activities.
Data sourced from CMS Long-Term Care Facility Characteristics quarterly report. Payer mix reflects the current resident census by primary payment source.
These measures show how residents usually do over time at this home, based on health outcomes and preventive care.
Illinois average: 9.7
Illinois average: 18.6
Illinois average: 15.5%
Illinois average: 18.4%
Illinois average: 21.6%
Illinois average: 3.4%
Illinois average: 5.3%
Illinois average: 1.8%
Illinois average: 6.5%
Illinois average: 48.1%
Illinois average: 20.2%
Illinois average: 89.2%
Illinois average: 91.6%
Illinois average: 68.3%
Illinois average: 2.3%
Illinois average: 63.0%
Quality measures are calculated from Minimum Data Set (MDS) assessments. For most measures, lower percentages indicate better care quality.
Federal penalties imposed by CMS for regulatory violations, including civil money penalties (fines) and denials of payment for new Medicare/Medicaid admissions.
Source: CMS Penalties Database (Data as of Jan 2026)
Illinois average: $143K
Illinois average: 3.0
Illinois average: 1.1
Penalties are imposed by CMS for violations of federal nursing home regulations.
Last updated: Jan 2026
Historical financial and operational data for Norwood Crossing based on CMS SNF Cost Reports.
Loading trend charts...
Care Cost Calculator: See Prices in Your Area
Nursing Home Data Explorer
Don’t Wait Too Long: 7 Red Flag Signs Your Parent Needs Assisted Living Now
The True Cost of Assisted Living in 2025 – And How Families Are Paying For It
Understanding Senior Living Costs: Pricing Models, Discounts & Financial Assistance
Touring a community? Use this expert-backed checklist to stay organized, ask the right questions, and find the perfect fit.
We'll send you a PDF version of the touring checklist.