Explore Open Rooms
1 Contact details
2 What type of senior care service are you looking for?
3 What budget do you have in mind for senior care?
4 How soon do you need to find care?
5 Additional details

Thank you for your interest!

Our team will be in touch shortly to help with next steps.

Nursing Home in Calvert City

CMS overall rating Info The Overall CMS Rating combines results from health inspections, staffing levels and quality measures. Health inspections carry the most weight. Staffing and quality scores can increase or decrease the final rating based on performance compared to state and national standards.

Oakview Nursing and Rehabilitation Center

Overview of Oakview Nursing and Rehabilitation Center

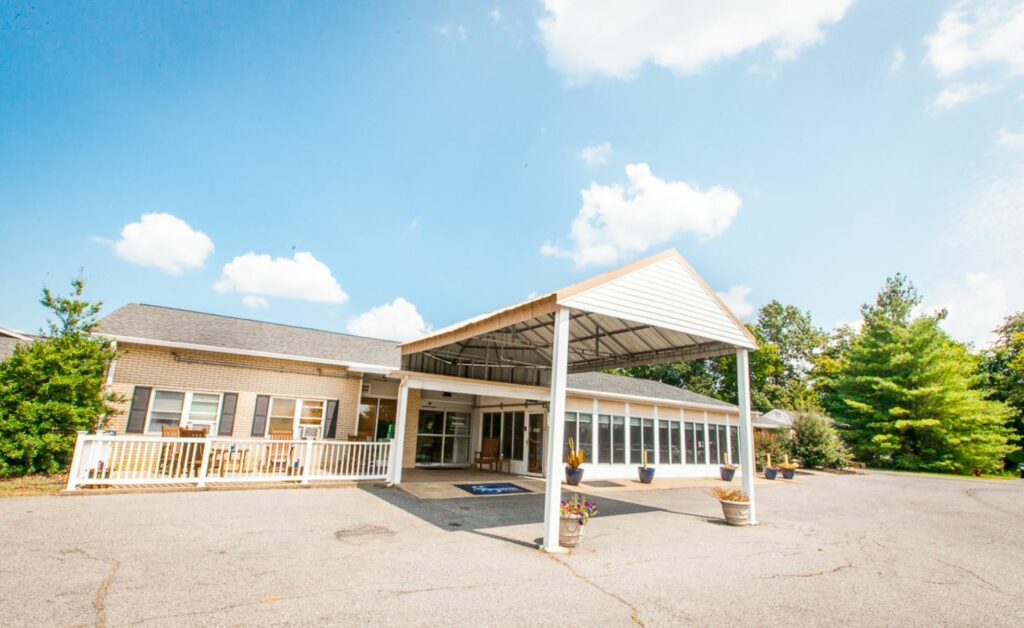
Set in Calvert City, KY, Oakview Nursing and Rehabilitation Center is a trusted senior care provider that aims to redefine the healthcare industry through resident centered healthcare services. These include a variety of clinical services, such as short-term care, long-term care, advanced wound care, palliative care, hospice care, dementia care, and advanced disease management care. A registered nurse is available 24-hour to meet residents’ needs anytime of the day.

Oakview Nursing and Rehabilitation Center ensures their residents are living their life to the fullest while they recover with their many life enrichment programs. Here, residents enjoy going on vacations and regular outings, volunteer opportunities, participating in hobby clubs, or the annual Signature Olympics events, and resident art shows. The community also features an array of interesting amenities, including internet learning, a beauty shop, bereavement accommodations, 24-hour pharmacy, full-time chaplain, and their annual Hall of Fame Café Event.

(270) 898-6288

Quality ratings

Measured by Centers for Medicare & Medicaid Services (CMS)

Overall rating Info The Overall CMS Rating combines results from health inspections, staffing levels and quality measures. Health inspections carry the most weight. Staffing and quality scores can increase or decrease the final rating based on performance compared to state and national standards.
2/5
Kentucky average: 2.8/5
Health Inspection Info Based on the results of the facility's three most recent standard inspections and any complaint investigations. CMS reviews the number, scope, and severity of deficiencies, with more recent findings weighted more heavily.
2/5
Kentucky average: 2.9/5
Staffing Info Measures average nursing staff hours per resident per day, including Registered Nurses (RNs) and total nursing staff. Ratings are adjusted based on the level of care residents require and are compared to state and national benchmarks.
3/5
Kentucky average: 2.4/5
Quality Measures Info Based on clinical and physical health indicators reported to CMS, such as hospital readmissions, falls, pressure ulcers, and improvements in mobility. These measures reflect how well residents' health needs are being managed.
4/5
Kentucky average: 2.9/5

Nursing care per resident

Info This shows how many total hours of nursing staff time are available per resident each day. Higher numbers usually mean more staff support.
4h 5m per day

This home provides 18% more nursing time per resident than the Kentucky average.

Kentucky average: 3h 27m per day

Staffing hours breakdown

Info Hours of care per resident per day, broken down by staff type. Data from CMS Medicare.
Staff type Facility State avg National avg
Registered Nurse (RN) Info Registered nurse hours per resident per day. 42m per day 46m per day 41m per day
Nurse Aide Info Nurse aide hours per resident per day. 2h 0m per day 2h 25m per day 2h 21m per day
Total Nursing (Weekend) Info Total number of nurse staff hours per resident per day on weekends. 3h 9m per day 3h 29m per day 3h 26m per day
Physical Therapist Info Physical therapist staff hours per resident per day. 4m per day 4m per day 4m per day
RN (Weekend) Info Registered nurse hours per resident per day on weekends. 16m per day 31m per day 29m per day

Capacity and availability

Medium-capacity home

Offers a balance of services and community atmosphere.

Total beds 100

This home usually has availability

Lower occupancy suggests more openings may be available.

Lower demand than the Kentucky average
Occupancy rate 80%
Residents per day (avg) 79
Occupancy rate
80%
Residents per day (avg)
79

Who this home usually serves

TYPE OF STAY

Mostly short-term rehab stays

Most residents typically stay for a few weeks or months before returning home or moving on.

Might be optimal for
Short stays Recovery Medicare-covered care

Breakdown by payment type

Medicare

47% of new residents, usually for short-term rehab.

Typical stay 1 months

Private pay

33% of new residents, often for short stays.

Typical stay 2 - 3 months

Medicaid

20% of new residents, often for long-term daily care.

Typical stay 1 - 2 years

Finances and operations

Privately-owned community
Operated by a partnership between two or more business owners.
Home revenue
$10.1M
Operating loss
-$1.5M
Privately-owned community Operated by a partnership between two or more business owners.
Home revenue
$10.1M
Operating loss
-$1.5M
Payroll costs Info The portion of the home's budget spent on staff, including nurses, caregivers, and other employees who support care and operations.
$2.7M
26.9% of revenue
Other operating costs Info All remaining costs needed to run the home, such as food, utilities, building maintenance, supplies and administrative expenses.
$8.8M
Total costs $11.5M
Bed community size
100-bed community
A larger shared setting that may offer more common spaces and organized community services.
Years in operation
1 year in operation
A newer community that may feature more recent facilities and programs.
Walk Score
Walk Score: 10 / 100
Car-dependent. Most errands require a car, with limited nearby walkable options.

About this community

Occupancy

Occupancy rate
80%
In line with Kentucky average
Occupied beds
80 / 100
Average residents 80 per day

License Details

Facility TypeLong Term Care (nursing Facility)
IssuanceMarch 1, 2025
ExpirationFebruary 28, 2026
CountyMARSHALL

Additional Licensing Details

License Number100330

Ownership & Operating Entity

Oakview Nursing and Rehabilitation Center is legally operated by Lp Calvert City, Llc, and administrated by Melissa.

Type Of Units

NF (Nursing Facility)
100 units
Total beds
100 units

What does this home offer?

Accepts Medicaid icon

Accept Medicaid: Yes

Housing options icon

Housing Options: Private Rooms

Building type icon
Building type icon

Building Type: Single-story

Transportation services icon

Transportation Services

Types of Care at Oakview Nursing and Rehabilitation Center

Nursing Home Memory Care

Inspection History

In Kentucky, the Cabinet for Health and Family Services, Office of Inspector General is the regulatory authority that conducts inspections and investigates complaints in all long-term care homes.

3 visits/inspections

Latest inspection

Date September 25, 2025
Plan Of Correction

15 deficiencies

Deficiencies indicate regulatory issues. A higher number implies the facility had several areas requiring improvement.

Kentucky average: 6 deficiencies

Inspection Report Summary for Oakview Nursing and Rehabilitation Center

The most recent inspection on September 25, 2025, found the facility in substantial compliance with no deficiencies noted. Earlier inspections also showed no deficiencies, indicating consistent adherence to regulatory standards. There were no complaint investigations or enforcement actions listed in the available reports. The facility has maintained compliance across all surveys. This suggests a stable pattern of meeting required regulations over time.

Health Inspection History

Inspections
Total health inspections 2

Kentucky average 2.9


Last Health inspection on Jun 2024

Total health citations 16

Kentucky average 13.5

Citations per inspection
8

Kentucky average 4.4


Health citations are formal notices following inspections when they fail to comply with safety and care standards.

14 of 16 citations resulted from standard inspections; and 2 of 16 resulted from complaint investigations.

Breakdown of citation severity (last 3 years)
Critical Health citations More info 2
82% worse than Kentucky average

Kentucky average: 1.1


Serious Health citations More info 0
100% better than Kentucky average

Kentucky average: 0.6

2 critical citations More info Kentucky average: 1.1

0 serious citations More info Kentucky average: 0.6

14 moderate citations More info Kentucky average: 11.6

0 minor citations More info Kentucky average: 0.1
Citations history (last 3 years)
Environmental moderate citation Info Issues related to building safety, cleanliness, maintenance, and overall living conditions. Jun 13, 2024
Corrected

Infection Control moderate citation Info Issues related to preventing and controlling infections, including hygiene practices and safety protocols. Jun 13, 2024
Corrected

Nutrition moderate citation Info Issues related to food quality, meal service, and resident's nutritional needs. Jun 13, 2024
Corrected

Quality of Care critical citation Info Issues related to how well residents receive appropriate treatment and support for their medical and daily care needs. Jun 13, 2024
Corrected

Compare Nursing Homes around Calvert City The information below is reported by the Kentucky Cabinet for Health and Family Services, Office of Inspector General.

1 facility compared · CMS & KY Dept. of Health data · Updated Apr 2026

Filter by care type
Oakview Nursing and Rehabilitation Center
NH

Nursing Home Licensed facility providing 24/7 skilled nursing care for residents with complex, ongoing medical needs. Staffed by RNs, LPNs, and CNAs. Inspected and star-rated annually by CMS. Accepts Medicare (short-term rehab) and Medicaid (long-term care).

Calvert City
100
77.6%
-5%
4.08
-49%
+9%
2
16
8.0
2
79
-
10
Bullock, Stacey
$10.0M
$2.7M
26.9%
185195

Places of interest near Oakview Nursing and Rehabilitation Center

Address 7.6 miles from city center

Calculate Travel Distance to Oakview Nursing and Rehabilitation Center

Add your location

Address

Staffing Data (Q2 2025)

This data corresponds to Q2 2025 and is based on CMS Payroll-Based Journal.

Total staff 228
Employees 129
Contractors 99
Staff to resident ratio 3.00:1
71% better than Kentucky average

Kentucky average ratio: 1.75:1

Avg staff/day 41
Average shift 8.7 hours
0% compared with Kentucky average

Kentucky average: 8.5 hours

Total staff hours (quarter) 32,512
Nursing staff breakdown
Registered Nurse

Manages medical care and health needs.

Total count 12
Average shift length Info Average shift length. Calculated as total hours divided by days worked and average staff per day. 10.9 hours

No contractors work on this role.

Licensed Practical Nurse

Assists with medical care and medications.

Total count 63
Average shift length Info Average shift length. Calculated as total hours divided by days worked and average staff per day. 9.5 hours

This role is partially covered by contractors.

Certified Nursing Assistant

Helps with daily care and mobility.

Total count 101
Average shift length Info Average shift length. Calculated as total hours divided by days worked and average staff per day. 9.2 hours

This role is partially covered by contractors.

Contractor staffing

Total hours from contractors

9.8%

3,199 contractor hours this quarter

Certified Nursing Assistant: 52 Licensed Practical Nurse: 43 Occupational Therapy Assistant: 2 Medication Aide/Technician: 1 Medical Director: 1
Staff by category
Certified Nursing Assistant495210114,54491100%9.2
Licensed Practical Nurse2043637,36091100%9.5
Registered Nurse120121,5937886%10.9
Clinical Nurse Specialist140141,4486774%7.5
RN Director of Nursing6061,3027380%7.9
Qualified Social Worker5051,2696875%7.5
Medication Aide/Technician1126635965%11
Other Dietary Services Staff4045916470%7.8
Physical Therapy Assistant2025357178%6.8
Nurse Practitioner2025186167%7.9
Speech Language Pathologist3034906470%7.4
Administrator2024886167%8
Dietitian1014645965%7.9
Mental Health Service Worker2024055257%7.5
Respiratory Therapy Technician4043815965%6.1
Physical Therapy Aide2023765864%6.5
Occupational Therapy Assistant022511921%2.7
Medical Director011361719%2.1
101 Certified Nursing Assistant
% of Days 100%
63 Licensed Practical Nurse
% of Days 100%
12 Registered Nurse
% of Days 86%
14 Clinical Nurse Specialist
% of Days 74%
6 RN Director of Nursing
% of Days 80%
5 Qualified Social Worker
% of Days 75%
2 Medication Aide/Technician
% of Days 65%
4 Other Dietary Services Staff
% of Days 70%
2 Physical Therapy Assistant
% of Days 78%
2 Nurse Practitioner
% of Days 67%
3 Speech Language Pathologist
% of Days 70%
2 Administrator
% of Days 67%
1 Dietitian
% of Days 65%
2 Mental Health Service Worker
% of Days 57%
4 Respiratory Therapy Technician
% of Days 65%
2 Physical Therapy Aide
% of Days 64%
2 Occupational Therapy Assistant
% of Days 21%
1 Medical Director
% of Days 19%

Facility Characteristics

Source: CMS Long-Term Care Facility Characteristics (Data as of Jan 2026)

Total census
76 residents
Residents by payment source
Medicare
4 residents (5.3%)
Medicaid
59 residents (77.6%)
Private pay or other
13 residents (17.1%)
Programs & Services
Residents' Group

Residents meet regularly to discuss policies, care quality, and activities

Active Resident Council

Organized group of residents that meets regularly to discuss facility policies, quality of life, and activities.

Quality of care over time

These measures show how residents usually do over time at this home, based on health outcomes and preventive care.

High-risk clinical events score Info A composite score based on pressure ulcers, falls with injury, weight loss, walking ability decline, and activities of daily living decline. 15.3
46% worse than Kentucky average

Kentucky average: 10.5

Functional decline score Info A composite score based on activities of daily living decline, walking ability decline, and incontinence. 28.2
49% worse than Kentucky average

Kentucky average: 18.9

Long-stay resident measures
Below average Kentucky avg: 3.6 Info CMS star rating based on long-stay quality measure performance. 5 stars = significantly above average, 1 star = significantly below average.
Need for Help with Daily Activities Increased Info Percent of long-stay residents whose need for help with daily activities has increased 29.3%
74% worse than Kentucky average

Kentucky average: 16.8%

Walking Ability Worsened Info Percent of long-stay residents whose ability to move independently worsened 35.7%
82% worse than Kentucky average

Kentucky average: 19.6%

Low Risk Residents with Bowel/Bladder Incontinence Info Percent of low risk long-stay residents who lose control of their bowels or bladder 19.7%
In line with Kentucky average

Kentucky average: 20.5%

Falls with Major Injury Info Percent of long-stay residents experiencing one or more falls with major injury 2.1%
44% better than Kentucky average

Kentucky average: 3.8%

High Risk Residents with Pressure Ulcers Info Percent of long-stay high risk residents with pressure ulcers 5.2%
10% better than Kentucky average

Kentucky average: 5.8%

Urinary Tract Infection Info Percent of long-stay residents with a urinary tract infection 1.1%
42% better than Kentucky average

Kentucky average: 1.9%

Lost Too Much Weight Info Percent of long-stay residents who lose too much weight 4.1%
40% better than Kentucky average

Kentucky average: 6.8%

Depressive Symptoms Info Percent of long-stay residents who have depressive symptoms 9.1%
37% better than Kentucky average

Kentucky average: 14.3%

Antipsychotic Use Info Percent of long-stay residents who received an antipsychotic medication 31.5%
102% worse than Kentucky average

Kentucky average: 15.6%

Pneumococcal Vaccine Info Percent of long-stay residents assessed and appropriately given the pneumococcal vaccine 87.8%
7% worse than Kentucky average

Kentucky average: 93.9%

Influenza Vaccine Info Percent of long-stay residents assessed and appropriately given the seasonal influenza vaccine 90.8%
6% worse than Kentucky average

Kentucky average: 96.2%

Hospitalizations per 1,000 days Info Number of hospitalizations per 1,000 long-stay resident days. 1.94
In line with Kentucky average

Kentucky average: 1.87

ED visits per 1,000 days Info Number of outpatient emergency department visits per 1,000 long-stay resident days. 2.08
5% better than Kentucky average

Kentucky average: 2.19

Short-stay resident measures
Above average Kentucky avg: 2.3 Info CMS star rating based on short-stay quality measure performance. 5 stars = much above average, 1 star = much below average.
Pneumococcal Vaccine Info Percent of short-stay residents assessed and appropriately given the pneumococcal vaccine 84.9%
In line with Kentucky average

Kentucky average: 83.7%

Antipsychotic medication increase Info Percent of short-stay residents who newly received an antipsychotic medication 0.7%
66% better than Kentucky average

Kentucky average: 1.9%

Influenza Vaccine Info Percent of short-stay residents assessed and appropriately given the seasonal influenza vaccine 91.6%
9% better than Kentucky average

Kentucky average: 83.6%

Re-hospitalized after SNF stay Info Percentage of short-stay residents who were re-hospitalized after their nursing home admission. 20.6%
16% better than Kentucky average

Kentucky average: 24.5%

Emergency department visits Info Percentage of short-stay residents who had an outpatient emergency department visit. 20.5%
47% worse than Kentucky average

Kentucky average: 13.9%

Falls with major injury Info Percentage of SNF residents who experience falls with major injury during their stay. 0.0%
100% better than Kentucky average

Kentucky average: 0.8%

Ability to care for self at discharge Info Percentage of residents at or above expected ability to care for themselves at discharge. 83.0%
55% better than Kentucky average

Kentucky average: 53.7%

Successful return to home or community Info Rate of successful return to home or community from a skilled nursing facility. 49.2%
In line with Kentucky average

Kentucky average: 50.6%

Penalties and fines

Federal penalties imposed by CMS for regulatory violations, including civil money penalties (fines) and denials of payment for new Medicare/Medicaid admissions.

Source: CMS Penalties Database (Data as of Jan 2026)

Total fines amount $16K
75% lower than Kentucky average

Kentucky average: $63K

Number of fines 2
13% fewer fines than Kentucky average

Kentucky average: 2.3

Payment Denials Info Serious action where Medicare and/or Medicaid temporarily stops payments for new residents until issues are fixed. 0
100% fewer payment denials than Kentucky average

Kentucky average: 0.3

Fines amount comparison
This facility $16K
Kentucky average $63K
Penalty History

Penalties are imposed by CMS for violations of federal nursing home regulations.

Civil Money Penalty Info Fines imposed for noncompliance, which can be assessed per day or per instance of violation. Jun 13, 2024
$8K
Civil Money Penalty Info Fines imposed for noncompliance, which can be assessed per day or per instance of violation. Jun 13, 2024
$8K

Last updated: Jan 2026

Guides for Better Senior Living

Care Cost Calculator: See Prices in Your Area

Nursing Home Data Explorer

Don’t Wait Too Long: 7 Red Flag Signs Your Parent Needs Assisted Living Now

The True Cost of Assisted Living in 2025 – And How Families Are Paying For It

Understanding Senior Living Costs: Pricing Models, Discounts & Financial Assistance

Financial Aid for Kentucky Seniors

Get financial aid guidance

Home and Community Based Waiver

Kentucky Medicaid HCB Waiver

Age 65+ or disabled, Kentucky resident, Medicaid-eligible, nursing home-level care need.

~$2,829/month (300% FBR, individual).

$2,000 (individual), $3,000 (couple).

Rural focus; waitlists possible.

Hart-Supported Living Program

KY Hart-Supported Living

Age 65+ or disabled, Kentucky resident.

No strict limit; prioritizes low-income.

Not applicable.

Competitive grants; limited availability.

Kentucky Homecare Program

Kentucky Homecare Program

Age 60+, Kentucky resident, at risk of nursing home placement, not eligible for Medicaid waivers.

No strict limit; prioritizes low-income (~$24,980/year individual).

Not assessed; need-based focus.

15 AAAs; rural focus; not in nursing homes.

Medicare Savings Program (MSP)

Kentucky Medicare Savings Program

Age 65+ or disabled, Kentucky resident, Medicare Part A/B.

~$2,510/month (QMB), ~$3,380/month (SLMB), ~$3,598/month (QI)—individual.

$9,430 (individual), $14,130 (couple).

Three tiers; no waitlist; auto Extra Help for Part D.

National Family Caregiver Support Program (NFCSP) Respite

Kentucky NFCSP Respite Care

Caregivers of 60+ needing care or 55+ caregivers of others; Kentucky resident; functional needs (2+ ADLs).

Prioritizes ~$24,980/year (individual); no strict cap.

Not assessed; need-based.

15 AAAs; prioritizes low-income, rural caregivers.

Kentucky Family Caregiver Program

Kentucky Family Caregiver Program

Grandparents (often 55+) as primary caregivers to grandchildren under 18, Kentucky resident, not on Kinship Care.

~$31,225/year (individual); varies by AAA.

Not strictly assessed; need-based.

Max $1,500/year; statewide via AAAs.

Senior Community Service Employment Program (SCSEP)

Kentucky SCSEP

Age 55+, unemployed, low-income, Kentucky resident.

~$1,983/month (125% FPL).

Not specified; income-focused.

Priority for veterans, rural residents.

VA Aid and Attendance (A&A) and Housebound Benefits

Kentucky VA Aid and Attendance/Housebound

Age 65+ or disabled veteran/spouse, Kentucky resident, wartime service, need for ADL help (A&A) or homebound.

Net income < ~$1,984/month (veteran with dependent, A&A); pension offsets income.

~$155,356 (net worth limit).

High veteran demand in rural areas.