Park Avenue Health Center

Nursing Home
Overview of Park Avenue Health Center

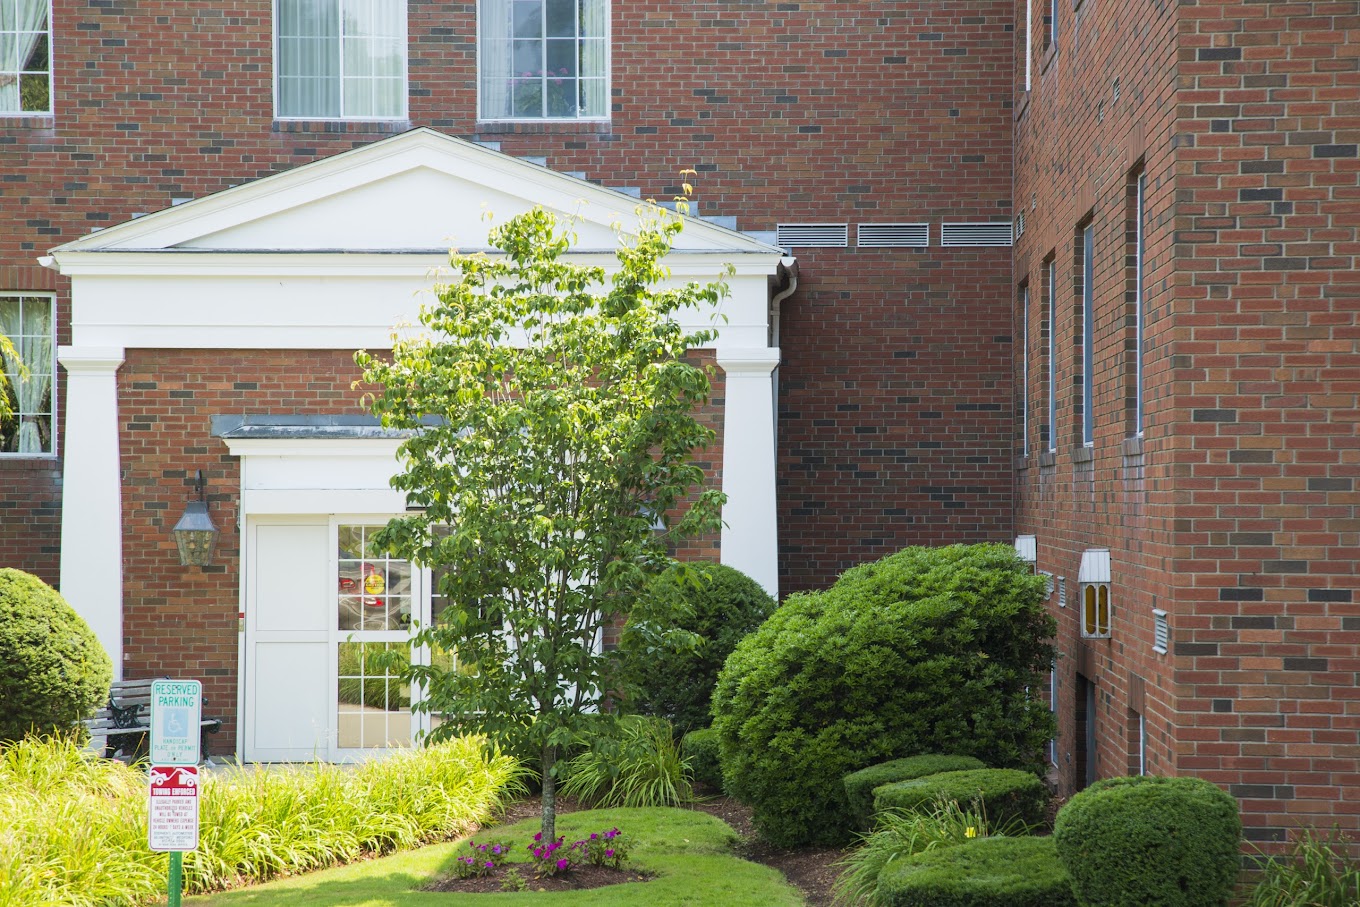
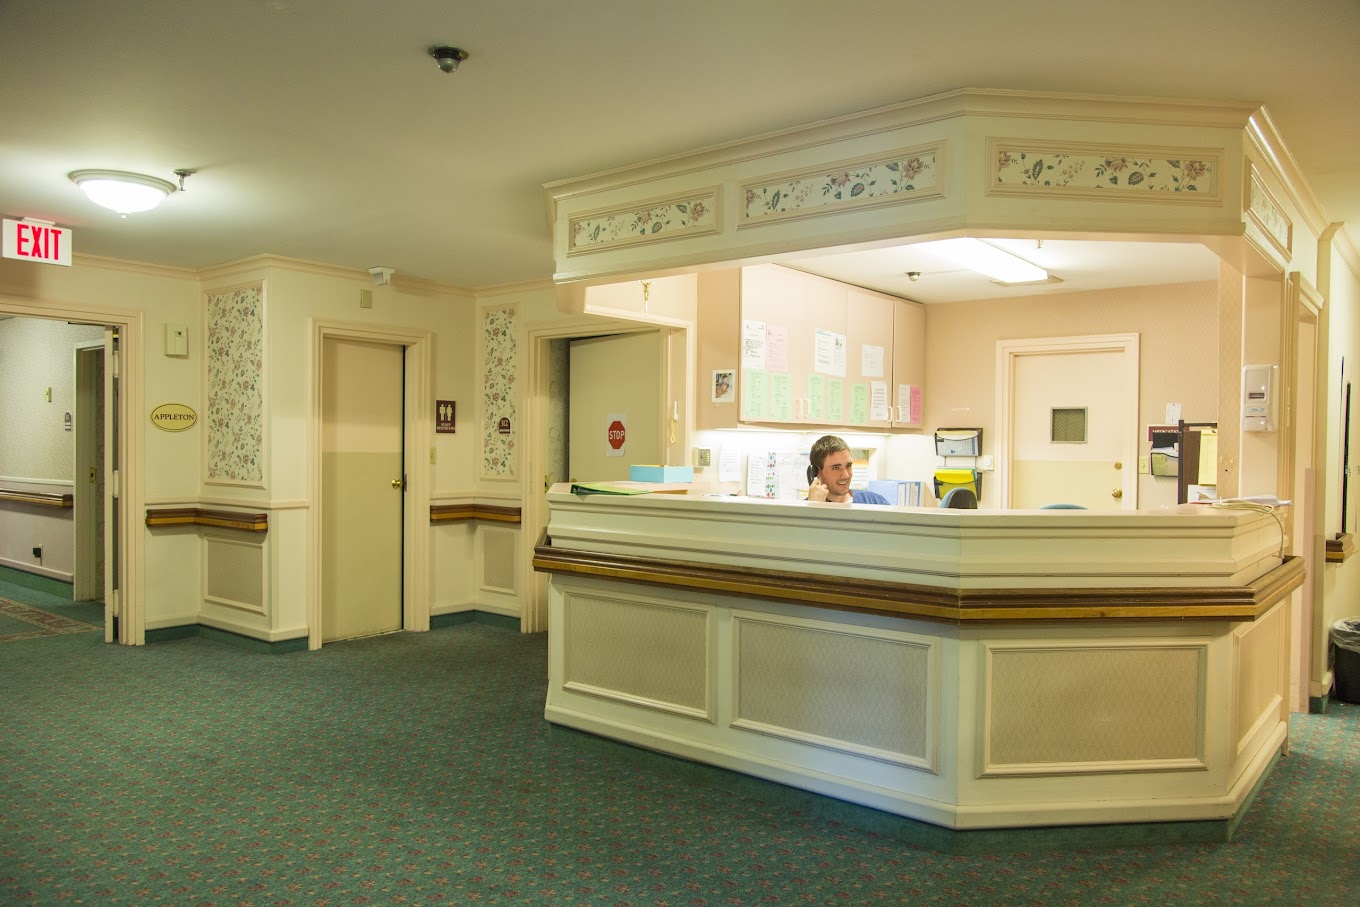
Dedicated to improving residents’ quality of life, Park Avenue Health Center is an extraordinary senior living community in Arlington, MA, providing short-term care. The community works well with residents to craft care plans according to their needs and preferences. Guiding residents in every step of retirement, the community provides social services to ensure they maximize their available resources.

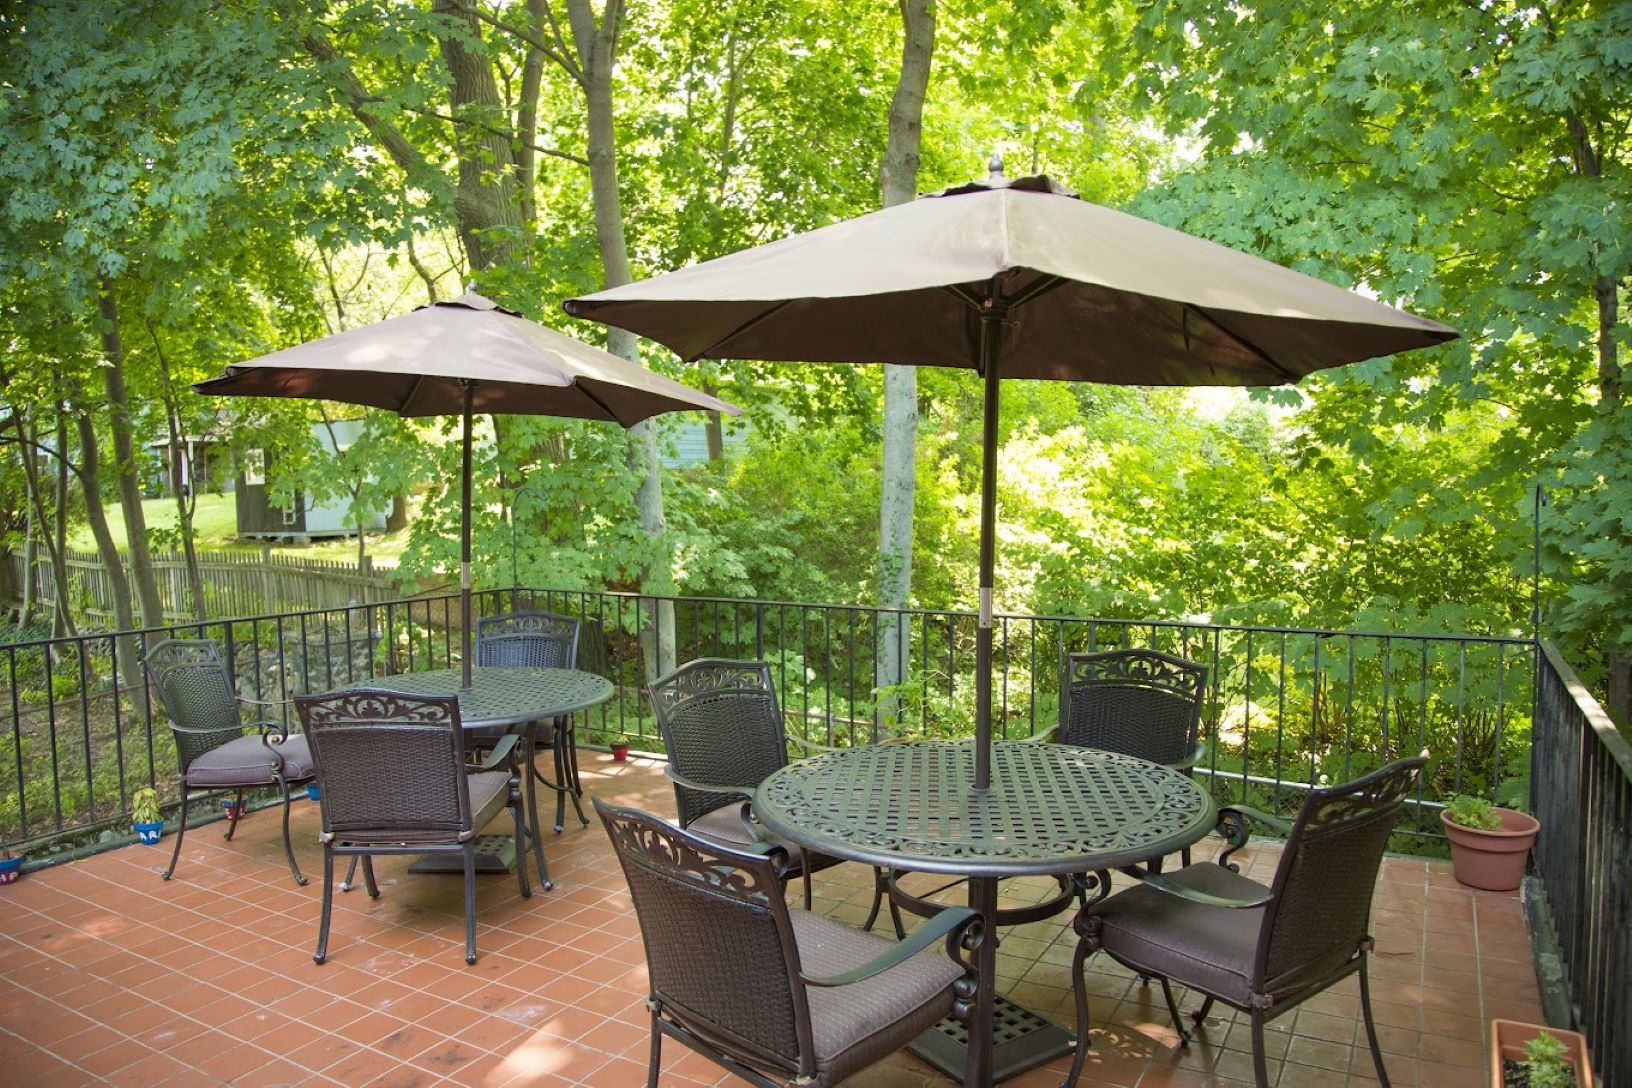
Physical, speech, and occupational therapies are also provided for residents to get better and jump back into their lives easily. Do not worry about meal preparations with dining options catering to each resident’s dietary needs and tastes. The community goes above and beyond to provide a safe place where residents spend their golden years without worries.

(781) 648-9530

Managed by Jerry Labelle

Administrator

Jerry Labelle serves as the Administrator at Park Avenue Healthcare, leading the community with a commitment to the vision and mission of the facility. He works alongside a team of dedicated professionals to ensure high-quality care and services for residents.

Quality ratings

Measured by Centers for Medicare & Medicaid Services (CMS)

Overall rating Info Official CMS rating based on health inspections, staffing and quality measures.
1/5
Massachusetts average: 2.9/5
Health Inspection Info Official CMS rating based on deficiencies found during state health inspections.
1/5
Massachusetts average: 2.8/5
Staffing Info Official CMS rating based on nurse staffing hours per resident per day.
3/5
Massachusetts average: 3.0/5
Quality Measures Info Official CMS rating based on clinical outcomes for residents.
1/5
Massachusetts average: 3.2/5

Nursing care per resident

Info Average daily nursing hours per resident (adjusted for acuity). Higher values indicate more nursing time per resident.
3h 41m per day

This home provides 6% less nursing time per resident than the state average.

Massachusetts average: 3h 56m per day

Staffing hours breakdown

Info Hours of care per resident per day, broken down by staff type. Data from CMS Medicare.
Staff type Facility State avg National avg
Registered Nurse (RN) Info Registered nurse hours per resident per day. 51m per day 39m per day 41m per day
LPN / LVN Info Licensed Practical Nurse / Licensed Vocational Nurse hours per resident per day. 36m per day 58m per day 52m per day
Nurse Aide Info Nurse aide hours per resident per day. 2h 11m per day 2h 16m per day 2h 21m per day
Total Nursing (Weekend) Info Total number of nurse staff hours per resident per day on weekends. 3h 28m per day 3h 27m per day 3h 26m per day
Physical Therapist Info Physical therapist staff hours per resident per day. 4m per day 4m per day 4m per day
RN (Weekend) Info Registered nurse hours per resident per day on weekends. 41m per day 28m per day 29m per day

Capacity and availability

This home usually has limited availability

Occupancy is moderate, suggesting balanced demand.

Similar demand to the Massachusetts average
Occupancy rate 91%
Residents per day (avg) 77
Occupancy rate
91%
Residents per day (avg)
77

Who this home usually serves

TYPE OF STAY

Mostly short-term rehab stays

Most residents typically stay for a few weeks or months before returning home or moving on.

Might be optimal for
Short stays Recovery Medicare-covered care

Breakdown by payment type

Medicare

52% of new residents, usually for short-term rehab.

Typical stay 25 days

Private pay

34% of new residents, often for short stays.

Typical stay 2 months

Medicaid

14% of new residents, often for long-term daily care.

Typical stay 1 - 2 years

Finances and operations

Proprietary home
Partnership
Home revenue
$14.8M
Operating loss
-$778.0K
Proprietary home Partnership
Home revenue
$14,835,154.00
Operating loss
$-777,978.00
Payroll costs Info The portion of the home's budget spent on staff, including nurses, caregivers, and other employees who support care and operations.
$5.5M
36.7% of revenue
Other operating costs Info All remaining costs needed to run the home, such as food, utilities, building maintenance, supplies and administrative expenses.
$10.2M
Total costs $15.6M
Years in operation
11 years in operation
A community with a solid operating history and experience delivering ongoing care.
Walk Score
Walk Score: 40 / 100
Somewhat walkable. A few nearby services may be reachable on foot, but most trips require transportation.
BBB Rating
BBB Rating: A+ (Not Accredited)
An independent rating from the Better Business Bureau based on factors such as complaint history, transparency, and business practices.
How BBB ratings work

About this community

Staffing

Key information about the people who lead and staff this community.

Leadership

Contact: Mr. Katrina Greenhalgh, Administrator

Staff Composition

Total Employees
5
Full-Time Employees
5

Care Services

Nursing Services
Rehabilitation Services
Skilled Nursing
Licensed Nurses/CNAs
24-Hour Staffing
Short-Term Rehab

All Levels of Care

Skilled Nursing
Rehabilitation

Amenities & Lifestyle

Cable and flat-screen TVs
complimentary wireless internet
recreational activities
special dining events
weekly dog-therapy visits
air conditioning
large dayrooms
newspaper delivery
on-site beauty salon
on-site laundry service.

Programs & Activities

Specific Programs
Planning of Care, Short-Term Care, Rehabilitation, Physician Services, Social Services, Lifestyle & Amenities, Meals & Nutrition

Dining & Nutrition

Food Description
Individualized meals are prepared for every resident, with three delicious and well-balanced meals daily.
Meals Included
Yes

What does this home offer?

Accepts Medicaid icon

Accept Medicaid: Yes, Accept

Total residents icon

Total Residents: 89 Residents

Housing options icon

Housing Options: Private / Semi-Private Rooms

Building type icon
Building type icon

Building Type: Single-story

Types of Care at Park Avenue Health Center

Nursing Home
Contact Park Avenue Health Center

Compare Nursing Homes around Arlington

The information below is reported by the Massachusetts Executive Office of Elder Affairs and Department of Public Health.
Park Avenue Health Center
AL

Assisted Living For seniors needing help with daily tasks but not full-time nursing.

IL

Independent Living For self-sufficient seniors seeking community and minimal assistance.

MC

Memory Care Specialized care for those with Memory Loss, Alzheimer's, or dementia, ensuring safety and support.

SNF

Nursing Homes 24/7 care needed

Arlington
89
No
A+
40
PARK AVENUE SNF OPERATIONS LLC
91.0%
$14,790,302.00
$5,451,718.00
36.9%
76.70
1/5
3.6789
1/5
3/5
1/5
3
46
5
+96%
-6%
+11%
Private / Semi-Private Rooms

Places of interest near Park Avenue Health Center

Address 1.7 miles from city center

Address 146 Park Ave, Arlington, MA 02476

Calculate Travel Distance to Park Avenue Health Center

Add your location

Address

Staffing Data

Source: CMS Payroll-Based Journal (Q2 2025)

193
Total Staff
87
Employees
106
Contractors
33,399
Total Hours (Quarter)
47
Avg Staff/Day
7.8
Avg Shift (hrs)
Nursing Staff Breakdown
Role Count Avg Shift (hrs) Uses Contractors?
Registered Nurse497.3 Yes
Licensed Practical Nurse267.8 Yes
Certified Nursing Assistant778 Yes
Staff by Category
Administration
3 staff
8.1hs shift avg
Nursing Staff
156 staff
7.9hs shift avg
Physicians & Practitioners
5 staff
8.2hs shift avg
Therapy Services
22 staff
7.5hs shift avg
Activities & Recreation
0 staff
0hs shift avg
Social Services
2 staff
3.3hs shift avg
Dietary Services
3 staff
7.4hs shift avg
Other Services
2 staff
7.6hs shift avg
Contractor Analysis
14.1%
of total hours from contractors
4,701 contractor hours this quarter
Speech Language Pathologist: 2 Respiratory Therapy Technician: 1 Certified Nursing Assistant: 35 Licensed Practical Nurse: 20 Registered Nurse: 36 Physical Therapy Assistant: 3 Administrator: 1 RN Director of Nursing: 1 Mental Health Service Worker: 1 Qualified Social Worker: 2 Occupational Therapy Assistant: 2 Medical Director: 1 Physical Therapy Aide: 1
Role Employees Contractors Total Staff Total Hours Days Worked % of Days Avg Shift (hrs)
Certified Nursing Assistant42357715,06591100%8
Registered Nurse1336494,68791100%7.3
Physical Therapist110113,36291100%7.7
Licensed Practical Nurse620263,35291100%7.8
RN Director of Nursing3141,1628492%9.2
Other Dietary Services Staff2028828897%7.2
Occupational Therapy Aide2027976470%8
Administrator1125286571%8
Physical Therapy Assistant0335256167%8
Nurse Practitioner2025126470%8
Mental Health Service Worker1125036470%7.6
Dietitian1014956369%7.9
Respiratory Therapy Technician0114876167%8
Clinical Nurse Specialist3034164448%8.5
Speech Language Pathologist0223695156%6.9
Qualified Social Worker0221263741%3.3
Physical Therapy Aide011681415%4.8
Occupational Therapy Assistant022352629%1.3
Medical Director0113033%10

Health Inspection History

Inspections
Total health inspections 7

Massachusetts average 4.5


Last Health inspection on Aug 2025

Total health citations 46
Citations per inspection
6.57

Health citations are formal notices following inspections when they fail to comply with safety and care standards.

42 of 46 citations resulted from standard inspections; and 4 of 46 resulted from complaint investigations.

Breakdown of citation severity (last 3 years)
Critical Health citations More info 4
1233% worse than Massachusetts average

Massachusetts average: 0.3


Serious Health citations More info 1
33% better than Massachusetts average

Massachusetts average: 1.5

4 critical citations More info Massachusetts average: 0.3

1 serious citation More info Massachusetts average: 1.5

41 moderate citations More info Massachusetts average: 29.7

0 minor citations More info Massachusetts average: 1.3
Citations history (last 3 years)
Nursing Services moderate citation Aug 28, 2025
Corrected

Quality of Care serious citation Apr 29, 2025
Corrected

Care Planning moderate citation Mar 19, 2025
Corrected

Quality of Care critical citation Nov 19, 2024
Corrected

Facility Characteristics

Source: CMS Long-Term Care Facility Characteristics (Data as of Jan 2026)

Ownership: For-Profit LLC
Resident Census by Payment Source
83 Total Residents
Medicare 10 (12%)
Medicaid 55 (66.3%)
Private Pay/Other 18 (21.7%)
Programs & Services
Residents' Group
Family Engagement

Active councils help families stay involved in care decisions and facility operations.

Quality of care over time

These measures show how residents usually do over time at this home, based on health outcomes and preventive care.

High-risk clinical events score Info A composite score based on pressure ulcers, falls with injury, weight loss, walking ability decline, and activities of daily living decline. 17.7
73% worse than Massachusetts average

Massachusetts average: 10.2

Functional decline score Info A composite score based on activities of daily living decline, walking ability decline, and incontinence. 32.3
62% worse than Massachusetts average

Massachusetts average: 20.0

Long-stay resident measures
Need for Help with Daily Activities Increased Info Percent of long-stay residents whose need for help with daily activities has increased 39.3%
111% worse than Massachusetts average

Massachusetts average: 18.7%

Walking Ability Worsened Info Percent of long-stay residents whose ability to move independently worsened 30.9%
60% worse than Massachusetts average

Massachusetts average: 19.3%

Low Risk Residents with Bowel/Bladder Incontinence Info Percent of low risk long-stay residents who lose control of their bowels or bladder 26.8%
21% worse than Massachusetts average

Massachusetts average: 22.1%

Falls with Major Injury Info Percent of long-stay residents experiencing one or more falls with major injury 5.0%
38% worse than Massachusetts average

Massachusetts average: 3.6%

High Risk Residents with Pressure Ulcers Info Percent of long-stay high risk residents with pressure ulcers 6.3%
35% worse than Massachusetts average

Massachusetts average: 4.7%

Urinary Tract Infection Info Percent of long-stay residents with a urinary tract infection 1.5%
28% better than Massachusetts average

Massachusetts average: 2.1%

Lost Too Much Weight Info Percent of long-stay residents who lose too much weight 7.1%
37% worse than Massachusetts average

Massachusetts average: 5.2%

Depressive Symptoms Info Percent of long-stay residents who have depressive symptoms 1.7%
84% better than Massachusetts average

Massachusetts average: 10.7%

Antipsychotic Use Info Percent of long-stay residents who received an antipsychotic medication 10.8%
47% better than Massachusetts average

Massachusetts average: 20.3%

Pneumococcal Vaccine Info Percent of long-stay residents assessed and appropriately given the pneumococcal vaccine 86.5%
6% worse than Massachusetts average

Massachusetts average: 91.9%

Influenza Vaccine Info Percent of long-stay residents assessed and appropriately given the seasonal influenza vaccine 96.4%
In line with Massachusetts average

Massachusetts average: 94.8%

Hospitalizations per 1,000 days Info Number of hospitalizations per 1,000 long-stay resident days. 3.40
83% worse than Massachusetts average

Massachusetts average: 1.86

ED visits per 1,000 days Info Number of outpatient emergency department visits per 1,000 long-stay resident days. 2.99
94% worse than Massachusetts average

Massachusetts average: 1.54

Short-stay resident measures
Pneumococcal Vaccine Info Percent of short-stay residents assessed and appropriately given the pneumococcal vaccine 36.6%
52% worse than Massachusetts average

Massachusetts average: 76.7%

Antipsychotic medication increase Info Percent of short-stay residents who newly received an antipsychotic medication 1.5%
17% worse than Massachusetts average

Massachusetts average: 1.3%

Influenza Vaccine Info Percent of short-stay residents assessed and appropriately given the seasonal influenza vaccine 42.0%
46% worse than Massachusetts average

Massachusetts average: 77.7%

Re-hospitalized after SNF stay Info Percentage of short-stay residents who were re-hospitalized after their nursing home admission. 17.9%
31% better than Massachusetts average

Massachusetts average: 25.8%

Emergency department visits Info Percentage of short-stay residents who had an outpatient emergency department visit. 13.9%
18% worse than Massachusetts average

Massachusetts average: 11.8%

Falls with major injury Info Percentage of SNF residents who experience falls with major injury during their stay. 2.3%
192% worse than Massachusetts average

Massachusetts average: 0.8%

Ability to care for self at discharge Info Percentage of residents at or above expected ability to care for themselves at discharge. 41.5%
23% worse than Massachusetts average

Massachusetts average: 53.7%

Successful return to home or community Info Rate of successful return to home or community from a skilled nursing facility. 44.7%
12% worse than Massachusetts average

Massachusetts average: 50.6%

Penalties and fines

Federal penalties imposed by CMS for regulatory violations, including civil money penalties (fines) and denials of payment for new Medicare/Medicaid admissions.

Source: CMS Penalties Database (Data as of Jan 2026)

Total fines amount $114K
58% higher than Massachusetts average

Massachusetts average: $72K

Number of fines 3
75% more fines than Massachusetts average

Massachusetts average: 1.7

Payment Denials Info Serious action where Medicare and/or Medicaid temporarily stops payments for new residents until issues are fixed. 0
100% fewer payment denials than Massachusetts average

Massachusetts average: 0.1

Fines amount comparison
This facility $114K
Massachusetts average $72K
Penalty History

Penalties are imposed by CMS for violations of federal nursing home regulations.

Civil Money Penalty Info Fines imposed for noncompliance, which can be assessed per day or per instance of violation. Apr 29, 2025
$13K
Civil Money Penalty Info Fines imposed for noncompliance, which can be assessed per day or per instance of violation. Nov 7, 2024
$17K
Civil Money Penalty Info Fines imposed for noncompliance, which can be assessed per day or per instance of violation. Oct 11, 2023
$84K

Last updated: Jan 2026

Guides for Better Senior Living

Care Cost Calculator: See Prices in Your Area

Nursing Home Data Explorer

Don’t Wait Too Long: 7 Red Flag Signs Your Parent Needs Assisted Living Now

The True Cost of Assisted Living in 2025 – And How Families Are Paying For It

Understanding Senior Living Costs: Pricing Models, Discounts & Financial Assistance

Financial Aid for Massachusetts Seniors

Get financial aid guidance

Home Care Program

MassHealth Home Care

Age 60+, Massachusetts resident, at risk of nursing home placement.

~$1,500/month (individual, varies by region).

$2,000 (individual, excludes home, car).

Coordinated through Aging Services Access Points (ASAPs); high demand in urban areas.

Frail Elder Waiver

Massachusetts Medicaid FE Waiver

Age 65+, Massachusetts resident, Medicaid-eligible, nursing home-level care need.

~$2,829/month (300% FBR, individual).

$2,000 (individual), $3,000 (couple).

Requires clinical eligibility determination.

Senior Care Options (SCO)

Massachusetts Senior Care Options

Age 65+, Massachusetts resident, eligible for MassHealth (Medicare optional), nursing home-level care need.

~$2,829/month (300% FBR, individual); QIT allowed.

$2,000 (individual), $3,000 (couple) (excludes home up to $713,000, car).

Not available in Dukes/Nantucket Counties; multiple SCO providers (e.g., CCA, Tufts).

Medicare Savings Program (MSP)

Massachusetts Medicare Savings Program (MassHealth Buy-In)

Age 65+ or disabled, Massachusetts resident, Medicare Part A/B.

~$2,510/month (QMB), ~$3,380/month (SLMB), ~$3,598/month (QI)—individual.

$9,430 (individual), $14,130 (couple).

Three tiers; no waitlist; includes Extra Help for Part D.

National Family Caregiver Support Program (NFCSP) Respite

Massachusetts NFCSP Respite Care

Caregivers of 60+ needing care or 55+ caregivers of others; Massachusetts resident; functional needs (2+ ADLs).

Prioritizes ~$24,980/year (individual); no strict cap.

Not assessed; need-based.

27 ASAPs; prioritizes low-income, rural caregivers.

Prescription Advantage

Massachusetts Prescription Advantage

Age 65+ or disabled, Massachusetts resident, enrolled in Medicare Part D (or ineligible for Medicare).

No strict limit; copays vary by income (~$24,980-$75,000/year individual).

Not assessed.

Supplements Medicare Part D; no enrollment fee for low-income.

Senior Community Service Employment Program (SCSEP)

Massachusetts SCSEP

Age 55+, unemployed, low-income, Massachusetts resident.

~$1,983/month (125% FPL).

Not specified; income-focused.

Priority for veterans, rural residents; AARP partnership.

VA Aid and Attendance (A&A) and Housebound Benefits

Massachusetts VA Aid and Attendance/Housebound

Age 65+ or disabled veteran/spouse, Massachusetts resident, wartime service, need for ADL help (A&A) or homebound.

Net income < ~$1,984/month (veteran with dependent, A&A); pension offsets income.

~$155,356 (net worth limit).

High veteran demand statewide.

Who we are

Your Senior Care Partner, Every Step of the Way

We help families find affordable senior communities and unlock same day discounts, Medicaid, and Medicare options tailored to your needs.

Contact us Today
Tour Icon
Planning a tour? Check our touring checklist.
Chat Icon
Thinking of living here? We can help you speak to a current resident