Peabody Retirement Community

Independent Living Home
Overview of Peabody Retirement Community

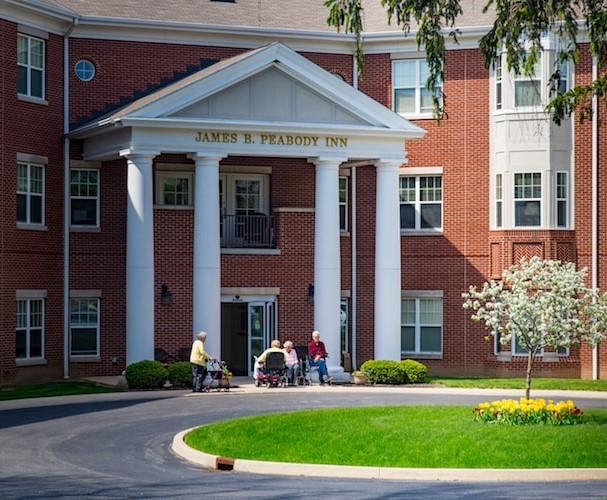
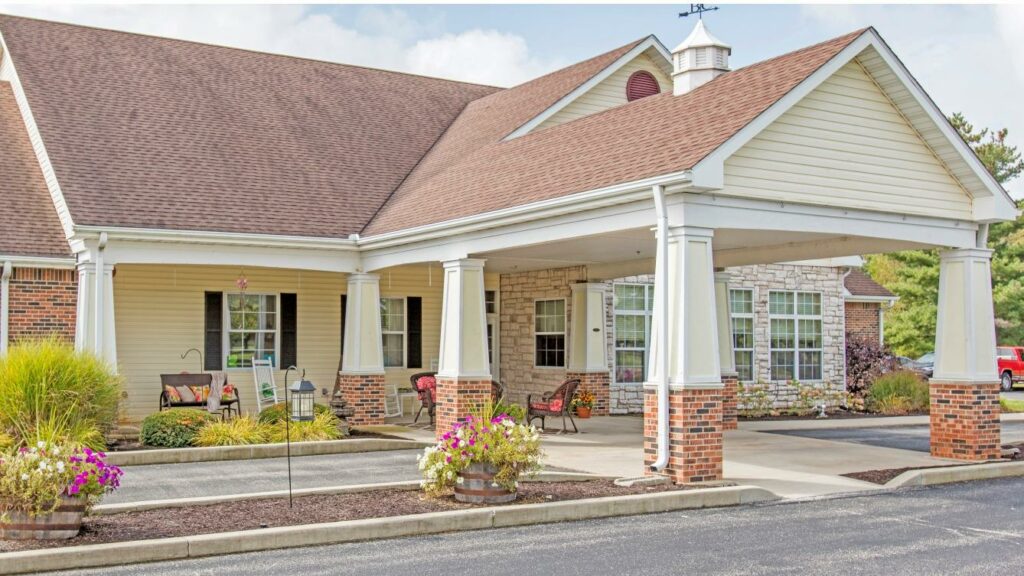
Set in the neighborhood of North Manchester, IN, Peabody Retirement Community is a well-established senior living community, offering a wide range of services for independent living, assisted living, memory care, and long-term care. The community features an array of beautifully designed accommodations that cater to residents’ unique lifestyle. Residents here are provided with all the care they need to continue aging gracefully, from assistance with daily living activities to specialized rehabilitation and therapy services.

The community ensures residents are at complete ease with the convenience of having most of their chores done for them. A wellness center is available to provide residents various programs for their well-being and a vibrant range of activities to keep them active and entertained. Restaurant-style dining with savory dishes and flexible dining options are offered to complete residents’ fulfilling living experience, ensuring they are always energized and healthy to take on a vibrant day.

(260) 982-8616

Quality ratings

Measured by Centers for Medicare & Medicaid Services (CMS)

Overall rating Info Official CMS rating based on health inspections, staffing and quality measures.
3/5
Indiana average: 3.1/5
Health Inspection Info Official CMS rating based on deficiencies found during state health inspections.
2/5
Indiana average: 2.8/5
Staffing Info Official CMS rating based on nurse staffing hours per resident per day.
2/5
Indiana average: 2.5/5
Quality Measures Info Official CMS rating based on clinical outcomes for residents.
5/5
Indiana average: 4.1/5

Nursing care per resident

Info Average daily nursing hours per resident (adjusted for acuity). Higher values indicate more nursing time per resident.
3h 38m per day

This home provides 6% more nursing time per resident than the state average.

Indiana average: 3h 26m per day

Capacity and availability

High-capacity home

May provide extensive amenities, services and programs.

Total beds 336

This home usually has availability

Lower occupancy suggests more openings may be available.

Lower demand than the Indiana average
Occupancy rate 54.4%
Residents per day (avg) 176
Occupancy rate
54.4%
Residents per day (avg)
176

Who this home usually serves

TYPE OF STAY

Primarily short stays

Residents typically stay for brief periods, with frequent admissions and discharges throughout the year.

Might be optimal for
Post-acute recovery Temporary care Transitional stays

Breakdown by payment type

Medicare

22% of new residents, usually for short-term rehab.

Typical stay 1 - 2 months

Private pay

67% of new residents, often for short stays.

Typical stay 6 - 7 months

Medicaid

11% of new residents, often for long-term daily care.

Typical stay 3 years

Finances and operations

Governmental home
County
Home revenue
$31.6M
Operating deficit
-$97.5K
Governmental home County
Home revenue
$31,629,207.00
Operating deficit
$-97,453.00
Payroll costs Info The portion of the home's budget spent on staff, including nurses, caregivers, and other employees who support care and operations.
$9.9M
31.2% of revenue
Other operating costs Info All remaining costs needed to run the home, such as food, utilities, building maintenance, supplies and administrative expenses.
$21.9M
Total costs $31.7M
Bed community size
336-bed community
A large-scale community that may provide a wide range of amenities, services, and structured programs.
Years in operation
13 years in operation
A community with a solid operating history and experience delivering ongoing care.
Walk Score
Walk Score: 22 / 100
Car-dependent. Most errands require a car, with limited nearby walkable options.
BBB Rating
BBB Rating: A+ (Not Accredited)
An independent rating from the Better Business Bureau based on factors such as complaint history, transparency, and business practices.
How BBB ratings work

About this community

Occupancy Rate
68%
Occupied Beds
227 of 336
Percentage of available beds currently in use by residents.
Facility Type
MIXED FACILITY (NURSING + RESIDENTIAL CARE)
License Date
January 10, 2024
License Expiration
September 30, 2025

Additional licensing details

License number: 24-000485-1
CMS Certification Number: 155655

Ownership & operating entity

Peabody Retirement Community is legally operated by WOODLAWN HOSPITAL, and administrated by KATIE ROBINSON.

Profit status: OTHER

Type Of Units

SNF/NF (Combined)
192 units
Residential
144 units
Total beds
336 units

Staffing

Key information about the people who lead and staff this community.

Leadership

Medical Director: Rutvik Patel
Director of Nursing: SHARON SCOTT-BELLINGER
Contact: Dr. Ann M Moore

Contact Information

Fax: (260) 982-8657

What does this home offer?

Accepts Medicaid icon

Accept Medicaid: Yes, Accept

Pets allowed icon
Pets allowed icon

Pets Allowed: Yes, Pets Allowed

Building type icon
Building type icon

Building Type: 3-story

Transportation services icon

Transportation Services

Fitness and recreation icon

Fitness and Recreation

Dining services icon

Three Meals Per Day

Types of Care at Peabody Retirement Community

Independent Living Assisted Living Memory Care
Contact Peabody Retirement Community

Inspection History

In Indiana, the Department of Health, Division of Long Term Care is the primary regulatory body that performs onsite inspections and quality of care reviews for all licensed facilities.

11 visits/inspections

24 visits/inspections triggered by complaints

Results

6 with citations

5 without citations

7 complaints

Formal expressions of dissatisfaction or concern made by residents, or their families regarding various aspects of the care, services, and environment provided.

Latest inspection

Date:June 12, 2025
Type:Re Inspection

43 total citations

Citations indicate regulatory violations. A higher number implies the facility had several areas requiring improvement.

55 deficiencies

Deficiencies indicate regulatory issues. A higher number implies the facility had several areas requiring improvement.

Compare Independent Living around Wabash

The information below is reported by the Indiana Department of Health, Division of Long Term Care.
Peabody Retirement Community
AL

Assisted Living For seniors needing help with daily tasks but not full-time nursing.

IL

Independent Living For self-sufficient seniors seeking community and minimal assistance.

MC

Memory Care Specialized care for those with Memory Loss, Alzheimer's, or dementia, ensuring safety and support.

SNF

Nursing Homes 24/7 care needed

North Manchester
393
Yes
A+
22
THE ESTELLE PEABODY MEMORIAL HOME OF THE SYNOD OF LINCOLN TRAILS OF UN
67.6%
$30,861,106.00
$9,864,303.00
32%
176.10
3/5
3.6268
2/5
2/5
5/5
4
33
3
-51%
+6%
-3%
Bickford of Wabash
AL

Assisted Living For seniors needing help with daily tasks but not full-time nursing.

IL

Independent Living For self-sufficient seniors seeking community and minimal assistance.

MC

Memory Care Specialized care for those with Memory Loss, Alzheimer's, or dementia, ensuring safety and support.

SNF

Nursing Homes 24/7 care needed

Wabash
-
Yes
-
8
-
-
-
-
-
-
-
-
-
-
-
-
-
-
-
-
-

Living Spaces & Floor Plans

Peabody Retirement Community8
Peabody Retirement Community5
Peabody Retirement Community6
Peabody Retirement Community7

Places of interest near Peabody Retirement Community

Address 0.8 miles from city center

Address 400 W 7th St, North Manchester, IN 46962

Calculate Travel Distance to Peabody Retirement Community

Add your location

Address

Staffing Data

Source: CMS Payroll-Based Journal (Q2 2025)

366
Total Staff
242
Employees
124
Contractors
78,168
Total Hours (Quarter)
100
Avg Staff/Day
8.6
Avg Shift (hrs)
Nursing Staff Breakdown
Role Count Avg Shift (hrs) Uses Contractors?
Registered Nurse179.2 Yes
Licensed Practical Nurse439.5 Yes
Certified Nursing Assistant1558.9 Yes
Staff by Category
Administration
4 staff
7.2hs shift avg
Nursing Staff
274 staff
9hs shift avg
Physicians & Practitioners
4 staff
7.5hs shift avg
Therapy Services
17 staff
6.1hs shift avg
Activities & Recreation
0 staff
0hs shift avg
Social Services
3 staff
7.5hs shift avg
Dietary Services
59 staff
6.7hs shift avg
Other Services
5 staff
7.6hs shift avg
Contractor Analysis
13.7%
of total hours from contractors
10,692 contractor hours this quarter
Certified Nursing Assistant: 49 Licensed Practical Nurse: 16 Medication Aide/Technician: 20 Other Dietary Services Staff: 8 Respiratory Therapy Technician: 3 Speech Language Pathologist: 6 Feeding Assistant: 2 Physical Therapy Aide: 3 Occupational Therapy Aide: 1 Occupational Therapy Assistant: 1 Registered Nurse: 6 Qualified Social Worker: 3 Medical Director: 3 Physical Therapy Assistant: 3
Role Employees Contractors Total Staff Total Hours Days Worked % of Days Avg Shift (hrs)
Certified Nursing Assistant1064915535,29091100%8.9
Medication Aide/Technician31205111,42891100%9.7
Licensed Practical Nurse27164310,65091100%9.5
Other Dietary Services Staff498575,36291100%6.6
Registered Nurse116175,29791100%9.2
RN Director of Nursing6062,5938897%7.3
Speech Language Pathologist0661,1166673%6.5
Dietitian2029616470%7.9
Dental Services Staff3039526470%7.8
Physical Therapy Aide0338976571%7.2
Clinical Nurse Specialist3035456167%7.1
Qualified Social Worker0334916470%7.5
Mental Health Service Worker1014886167%8
Administrator1014725965%8
Nurse Practitioner1014565763%8
Feeding Assistant0223766470%5.1
Occupational Therapy Aide0112765156%5.4
Medical Director0332393842%6
Respiratory Therapy Technician0331844448%4
Occupational Therapy Assistant011761112%6.9
Physical Therapy Assistant033141112%1.1
Diagnostic X-ray Services Staff101878%1.1

Health Inspection History

Inspections
Total health inspections 9

Indiana average 6


Last Health inspection on Apr 2025

Total health citations 33
Citations per inspection
3.67

Health citations are formal notices following inspections when they fail to comply with safety and care standards.

25 of 33 citations resulted from standard inspections; and 8 of 33 resulted from complaint investigations.

Breakdown of citation severity (last 3 years)
Critical Health citations More info 1
400% worse than Indiana average

Indiana average: 0.2


Serious Health citations More info 2
233% worse than Indiana average

Indiana average: 0.6

1 critical citation More info Indiana average: 0.2

2 serious citations More info Indiana average: 0.6

28 moderate citations More info Indiana average: 23.8

2 minor citations More info Indiana average: 0.4
Citations history (last 3 years)
Administration moderate citation Apr 09, 2025
Corrected

Infection Control moderate citation Apr 09, 2025
Corrected

Nutrition moderate citation Apr 09, 2025
Corrected

Quality of Care moderate citation Apr 09, 2025
Corrected

Facility Characteristics

Source: CMS Long-Term Care Facility Characteristics (Data as of Jan 2026)

Ownership: Non-Profit Corporation
Resident Census by Payment Source
176 Total Residents
Medicare 6 (3.4%)
Medicaid 116 (65.9%)
Private Pay/Other 54 (30.7%)
Programs & Services
Residents' Group
CCRC
Family Engagement

Active councils help families stay involved in care decisions and facility operations.

Quality of care over time

These measures show how residents usually do over time at this home, based on health outcomes and preventive care.

High-risk clinical events score Info A composite score based on pressure ulcers, falls with injury, weight loss, walking ability decline, and activities of daily living decline. 5.9
26% better than Indiana average

Indiana average: 8.0

Functional decline score Info A composite score based on activities of daily living decline, walking ability decline, and incontinence. 16.7
In line with Indiana average

Indiana average: 17.1

Long-stay resident measures
Need for Help with Daily Activities Increased Info Percent of long-stay residents whose need for help with daily activities has increased 7.1%
41% better than Indiana average

Indiana average: 12.0%

Walking Ability Worsened Info Percent of long-stay residents whose ability to move independently worsened 11.1%
23% better than Indiana average

Indiana average: 14.4%

Low Risk Residents with Bowel/Bladder Incontinence Info Percent of low risk long-stay residents who lose control of their bowels or bladder 31.9%
30% worse than Indiana average

Indiana average: 24.6%

Falls with Major Injury Info Percent of long-stay residents experiencing one or more falls with major injury 4.0%
In line with Indiana average

Indiana average: 3.9%

High Risk Residents with Pressure Ulcers Info Percent of long-stay high risk residents with pressure ulcers 4.1%
7% better than Indiana average

Indiana average: 4.4%

Urinary Tract Infection Info Percent of long-stay residents with a urinary tract infection 0.2%
86% better than Indiana average

Indiana average: 1.2%

Lost Too Much Weight Info Percent of long-stay residents who lose too much weight 3.4%
40% better than Indiana average

Indiana average: 5.7%

Depressive Symptoms Info Percent of long-stay residents who have depressive symptoms 8.1%
66% better than Indiana average

Indiana average: 24.1%

Antipsychotic Use Info Percent of long-stay residents who received an antipsychotic medication 16.6%
33% worse than Indiana average

Indiana average: 12.4%

Pneumococcal Vaccine Info Percent of long-stay residents assessed and appropriately given the pneumococcal vaccine 98.5%
5% better than Indiana average

Indiana average: 93.7%

Influenza Vaccine Info Percent of long-stay residents assessed and appropriately given the seasonal influenza vaccine 100.0%
5% better than Indiana average

Indiana average: 95.4%

Short-stay resident measures
Pneumococcal Vaccine Info Percent of short-stay residents assessed and appropriately given the pneumococcal vaccine 86.3%
6% better than Indiana average

Indiana average: 81.7%

Antipsychotic medication increase Info Percent of short-stay residents who newly received an antipsychotic medication 0.0%
100% better than Indiana average

Indiana average: 1.4%

Influenza Vaccine Info Percent of short-stay residents assessed and appropriately given the seasonal influenza vaccine 87.9%
11% better than Indiana average

Indiana average: 79.0%

Penalties and fines

Federal penalties imposed by CMS for regulatory violations, including civil money penalties (fines) and denials of payment for new Medicare/Medicaid admissions.

Source: CMS Penalties Database (Data as of Jan 2026)

Total fines amount $34K
23% higher than Indiana average

Indiana average: $27K

Number of fines 4
188% more fines than Indiana average

Indiana average: 1.4

Payment Denials Info Serious action where Medicare and/or Medicaid temporarily stops payments for new residents until issues are fixed. 0
100% fewer payment denials than Indiana average

Indiana average: 0.4

Fines amount comparison
This facility $34K
Indiana average $27K
Penalty History

Penalties are imposed by CMS for violations of federal nursing home regulations.

Civil Money Penalty Info Fines imposed for noncompliance, which can be assessed per day or per instance of violation. Jun 7, 2024
$12K
Civil Money Penalty Info Fines imposed for noncompliance, which can be assessed per day or per instance of violation. Apr 18, 2024
$10K
Civil Money Penalty Info Fines imposed for noncompliance, which can be assessed per day or per instance of violation. Mar 28, 2023
$3K
Civil Money Penalty Info Fines imposed for noncompliance, which can be assessed per day or per instance of violation. Mar 28, 2023
$8K

Last updated: Jan 2026

Guides for Better Senior Living

Care Cost Calculator: See Prices in Your Area

Nursing Home Data Explorer

Don’t Wait Too Long: 7 Red Flag Signs Your Parent Needs Assisted Living Now

The True Cost of Assisted Living in 2025 – And How Families Are Paying For It

Understanding Senior Living Costs: Pricing Models, Discounts & Financial Assistance

Financial Aid for Indiana Seniors

Get financial aid guidance

Aged and Disabled Waiver

Indiana Medicaid A&D Waiver

Age 65+ or disabled, Indiana resident, Medicaid-eligible, nursing home-level care need.

~$2,829/month (300% FBR, individual).

$2,000 (individual), $3,000 (couple).

Requires level-of-care determination.

CHOICE Program

Indiana CHOICE

Age 60+, Indiana resident, at risk of nursing home.

~$2,000/month (varies).

$10,000 (individual).

Limited funding; regional variation.

Residential Care Assistance Program (RCAP)

Indiana Residential Care Assistance Program

Age 65+, or blind, or disabled, Indiana resident, in approved facility, low-income or SSI recipient.

~$1,004/month (including SSI).

$2,000 (individual), $3,000 (couple).

~50 facilities statewide; per diem rate set by FSSA.

Medicare Savings Program (MSP)

Indiana Medicare Savings Program

Age 65+ or disabled, Indiana resident, Medicare Part A/B.

~$2,510/month (QMB), ~$3,380/month (SLMB), ~$3,598/month (QI)—individual.

$9,430 (individual), $14,130 (couple).

Three tiers; no waitlist.

National Family Caregiver Support Program (NFCSP) Respite

Indiana NFCSP Respite Care

Caregivers of 60+ needing care or 55+ caregivers of others; Indiana resident; functional needs (2+ ADLs).

Prioritizes ~$24,980/year (individual); no strict cap.

Not assessed; need-based.

16 AAAs; prioritizes low-income, rural caregivers.

Senior Community Service Employment Program (SCSEP)

Indiana SCSEP

Age 55+, unemployed, low-income, Indiana resident.

~$1,983/month (125% FPL).

Not specified; income-focused.

Priority for veterans, rural residents.

VA Aid and Attendance (A&A) and Housebound Benefits

Indiana VA Aid and Attendance/Housebound

Age 65+ or disabled veteran/spouse, Indiana resident, wartime service, need for ADL help (A&A) or homebound.

Net income < ~$1,984/month (veteran with dependent, A&A); pension offsets income.

~$155,356 (net worth limit).

High veteran demand statewide.

Who we are

Your Senior Care Partner, Every Step of the Way

We help families find affordable senior communities and unlock same day discounts, Medicaid, and Medicare options tailored to your needs.

Contact us Today
Tour Icon
Planning a tour? Check our touring checklist.
Chat Icon
Thinking of living here? We can help you speak to a current resident