Occupancy rate
77%
California average: 73%

We arrange tours, appointments, and even moving support so you don’t have to
Thank you for your interest!
Our team will be in touch shortly to help with next steps.


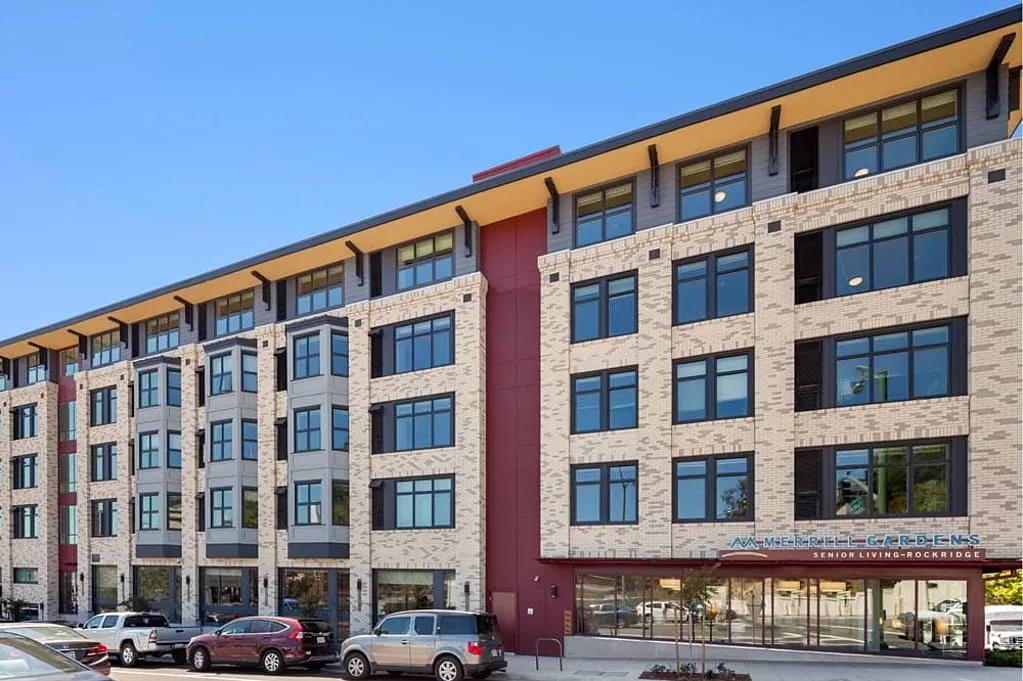
Experience award-winning care and support from Piedmont Gardens, which is ideally located in the charming neighborhood of Oakland, CA, offering a continuum of care services, including independent living, assisted living, memory care, skilled nursing, and short-stay rehabilitation. The community works hard to meet seniors’ needs and preferences with round-the-clock care from a compassionate care team. Piedmont Gardens was awarded the Best Continuing Care Community in 2024 by U.S. News, proving its exceptional quality.
With its dedication to improving seniors’ quality of life, the community conducts a lot of fun activities and exciting events. Piedmont Gardens perfectly fuses the city bustle with its serene campus, ensuring residents can easily access their needs and desires.
Myra Punla serves as the Health Services Administrator at Piedmont Gardens, overseeing the health services operations to ensure residents receive quality care. Her role is central to maintaining the community’s commitment to health and wellness.
May provide extensive amenities, services and programs.
Lower occupancy suggests more openings may be available.
Most residents typically stay for a few weeks or months before returning home or moving on.
50% of new residents, usually for short-term rehab.
49% of new residents, often for short stays.
California average: 73%
Piedmont Gardens is legally operated by HUMANGOOD & HUMANGOOD NORCAL.
Accept Medicaid: Yes, Accept
Total Residents: 94 Residents
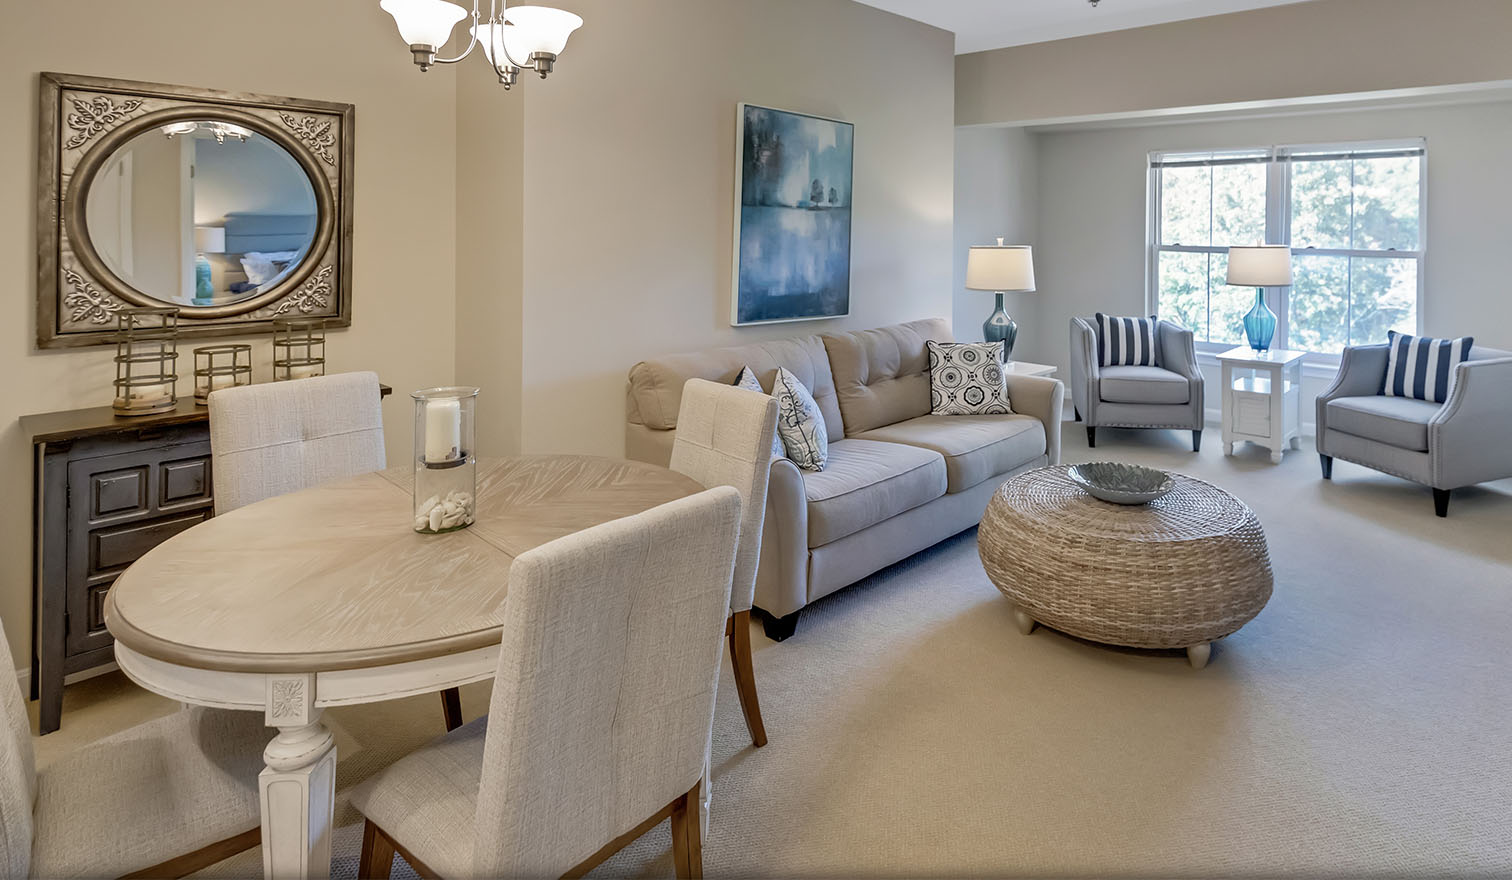
Room Sizes: 375 / 540-560 / 740-1120 / 1250 sq. ft
Housing Options: Studio / Alcove / 1 Bed / 2 Bed
Building Type: High-rise
Beauty Services

Parking Available
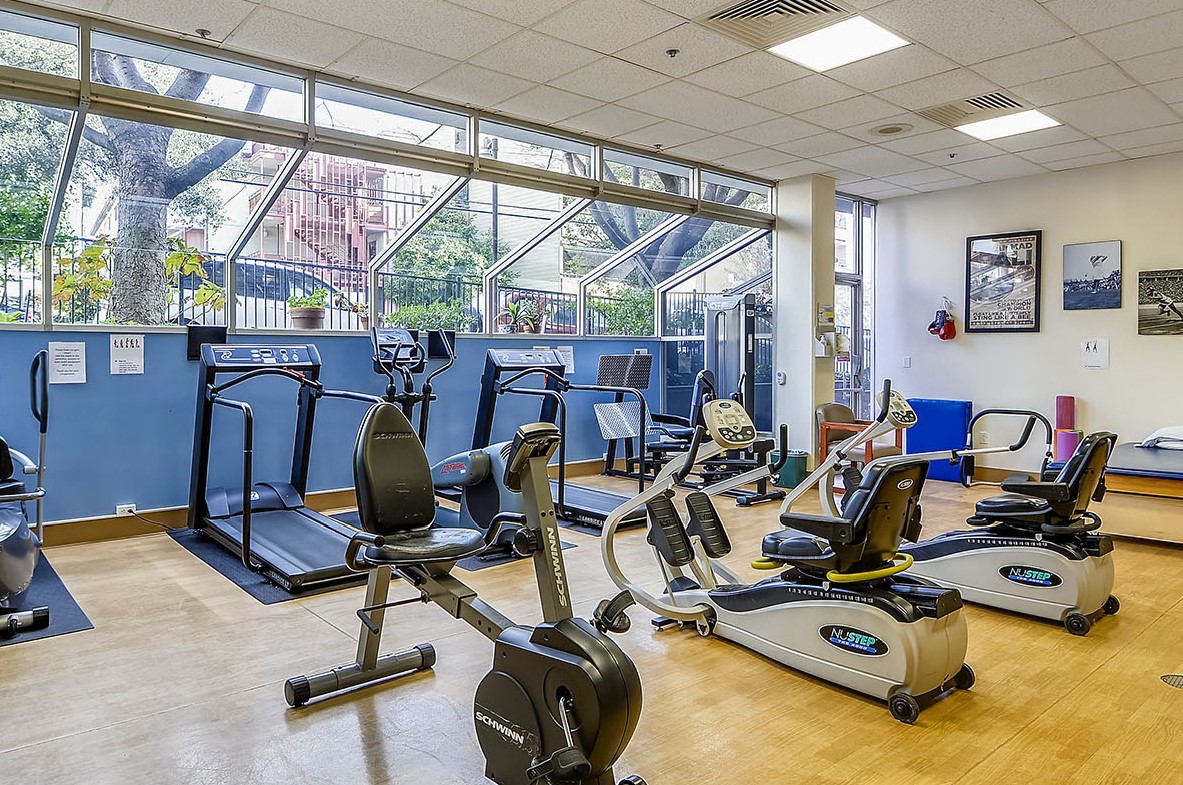
Exercise Programs
Transportation Services
Housekeeping Services
Recreational Activities
In California, the Department of Social Services (for assisted living facilities) and the Department of Public Health (for nursing homes) conduct inspections to ensure resident safety and regulatory compliance.
California average: 16 visits
4 total complaint visits
12 other visits
![]() Other visits include regulatory visits that are not routine inspections or complaint investigations, such as administrative check-ins, follow-up reviews, or licensing-related visits.
Other visits include regulatory visits that are not routine inspections or complaint investigations, such as administrative check-ins, follow-up reviews, or licensing-related visits.
13 total complaint visits
7 other visits
Investigations can have many visits.
California average: 10 complaint investigations
California average: 4 official inspections
A violation that poses an immediate risk to resident health or safety, or represents a substantial failure to comply with licensing requirements.
California average: 3 serious citations
A violation that does not pose an immediate risk to resident health or safety but requires correction to remain in compliance.
California average: 4 moderate citations
Most inspections found no deficiencies, showing a generally strong compliance record at this facility. The most recent report from September 18, 2025, was a complaint investigation that found all allegations unsubstantiated, with no deficiencies cited. Earlier complaint investigations noted isolated incidents such as a medication error and a resident injury from assistance, but these were addressed promptly and did not result in deficiencies. Several complaints were unsubstantiated, and no fines, enforcement actions, or severe findings were reported in the available records. The facility’s performance appears stable over time, with no clear pattern of worsening or recurring issues.
California average 12.5
Last Health inspection on Jan 2025
California average 50.2
California average 4.65
Health citations are formal notices following inspections when they fail to comply with safety and care standards.
11 of 13 citations resulted from standard inspections; and 2 of 13 resulted from complaint investigations.
California average: 0.4
California average: 1
Data sourced from CMS Health Deficiencies reports. Citation severity codes range from A (least serious) to L (most serious). Immediate Jeopardy (J-L) citations indicate situations where the facility's noncompliance has placed residents at risk of death or serious harm.
Assisted Living A licensed, long-term care setting for seniors or individuals with disabilities who need help with daily activities — like bathing, dressing, and medication management — but not 24-hour skilled nursing. Offers housing, meals, and around-the-clock support while aiming to maximize resident independence.
Independent Living Lifestyle-focused communities for older adults offering dining, activities, and transportation with minimal personal care. Best for active, independent seniors who want community without medical support.
Memory Care Secured, specialized care for people living with Alzheimer's or dementia. Staff trained in cognitive impairment, with higher staff-to-resident ratios and an environment designed to reduce confusion and wandering risk.
Nursing Home Licensed facility providing 24/7 skilled nursing care for residents with complex, ongoing medical needs. Staffed by RNs, LPNs, and CNAs. Inspected and star-rated annually by CMS. Accepts Medicare (short-term rehab) and Medicaid (long-term care).
Assisted Living A licensed, long-term care setting for seniors or individuals with disabilities who need help with daily activities — like bathing, dressing, and medication management — but not 24-hour skilled nursing. Offers housing, meals, and around-the-clock support while aiming to maximize resident independence.
Independent Living Lifestyle-focused communities for older adults offering dining, activities, and transportation with minimal personal care. Best for active, independent seniors who want community without medical support.
Memory Care Secured, specialized care for people living with Alzheimer's or dementia. Staff trained in cognitive impairment, with higher staff-to-resident ratios and an environment designed to reduce confusion and wandering risk.
![]() 2.0 miles from city center
2.0 miles from city center
![]() 110 41st St, Oakland, CA 94611
110 41st St, Oakland, CA 94611
Add your location
This data corresponds to Q2 2025 and is based on CMS Payroll-Based Journal.
California average ratio: 0.00:1
California average: 7.7 hours
Manages medical care and health needs.
No contractors work on this role.
Assists with medical care and medications.
No contractors work on this role.
Helps with daily care and mobility.
No contractors work on this role.
Total hours from contractors
3,146 contractor hours this quarter
| Certified Nursing Assistant | 60 | 0 | 60 | 18,246 | 91 | 100% | 7.1 |
| Registered Nurse | 15 | 0 | 15 | 4,961 | 91 | 100% | 7.7 |
| Licensed Practical Nurse | 15 | 0 | 15 | 4,536 | 91 | 100% | 7.6 |
| Other Dietary Services Staff | 4 | 0 | 4 | 1,373 | 90 | 99% | 7 |
| Physical Therapy Assistant | 0 | 12 | 12 | 1,201 | 83 | 91% | 5.7 |
| Dental Services Staff | 2 | 0 | 2 | 984 | 64 | 70% | 8 |
| Respiratory Therapy Technician | 0 | 5 | 5 | 575 | 84 | 92% | 4.4 |
| RN Director of Nursing | 1 | 0 | 1 | 538 | 60 | 66% | 9 |
| Clinical Nurse Specialist | 1 | 0 | 1 | 488 | 61 | 67% | 8 |
| Nurse Practitioner | 1 | 0 | 1 | 480 | 60 | 66% | 8 |
| Therapeutic Recreation Specialist | 0 | 2 | 2 | 458 | 64 | 70% | 7 |
| Other Social Services Staff | 1 | 0 | 1 | 438 | 56 | 62% | 7.8 |
| Speech Language Pathologist | 0 | 2 | 2 | 430 | 54 | 59% | 5.9 |
| Administrator | 1 | 0 | 1 | 360 | 45 | 49% | 8 |
| Qualified Social Worker | 0 | 2 | 2 | 290 | 63 | 69% | 4.6 |
| Physical Therapy Aide | 0 | 2 | 2 | 192 | 29 | 32% | 5.6 |
Source: CMS Long-Term Care Facility Characteristics (Data as of Jan 2026)
Residents meet regularly to discuss policies, care quality, and activities
Part of a Continuing Care Retirement Community offering multiple care levels
Organized group of residents that meets regularly to discuss facility policies, quality of life, and activities.
Data sourced from CMS Long-Term Care Facility Characteristics quarterly report. Payer mix reflects the current resident census by primary payment source.
These measures show how residents usually do over time at this home, based on health outcomes and preventive care.
California average: 6.6
California average: 11.3
California average: 11.1%
California average: 12.0%
California average: 11.3%
California average: 1.7%
California average: 5.0%
California average: 1.2%
California average: 4.2%
California average: 6.7%
California average: 10.1%
California average: 98.5%
California average: 98.2%
California average: 94.0%
California average: 1.5%
California average: 93.2%
Quality measures are calculated from Minimum Data Set (MDS) assessments. For most measures, lower percentages indicate better care quality.
Historical financial and operational data for Piedmont Gardens based on CMS SNF Cost Reports.
Loading trend charts...
Care Cost Calculator: See Prices in Your Area
Nursing Home Data Explorer
Don’t Wait Too Long: 7 Red Flag Signs Your Parent Needs Assisted Living Now
The True Cost of Assisted Living in 2025 – And How Families Are Paying For It
Understanding Senior Living Costs: Pricing Models, Discounts & Financial Assistance

Touring a community? Use this expert-backed checklist to stay organized, ask the right questions, and find the perfect fit.
We'll send you a PDF version of the touring checklist.