Quantum Rehabilitation and Nursing LLC
Nursing Home & Skilled Nursing · Middle Island, NY
CMS overall rating Info CMS (the Centers for Medicare & Medicaid Services) is the federal agency that rates nursing home quality. Its Overall Rating runs from 1 to 5 stars, combining health inspections, staffing, and quality measures, with inspections weighted most heavily.

Quantum Rehabilitation and Nursing LLC

Nursing Home & Skilled Nursing · Middle Island, NY
CMS overall rating Info CMS (the Centers for Medicare & Medicaid Services) is the federal agency that rates nursing home quality. Its Overall Rating runs from 1 to 5 stars, combining health inspections, staffing, and quality measures, with inspections weighted most heavily.
Calculator: See prices in your area
Quantum Rehabilitation and Nursing LLC accepts Medicare, Medicaid, and private pay.

Overview of Quantum Rehabilitation and Nursing LLC

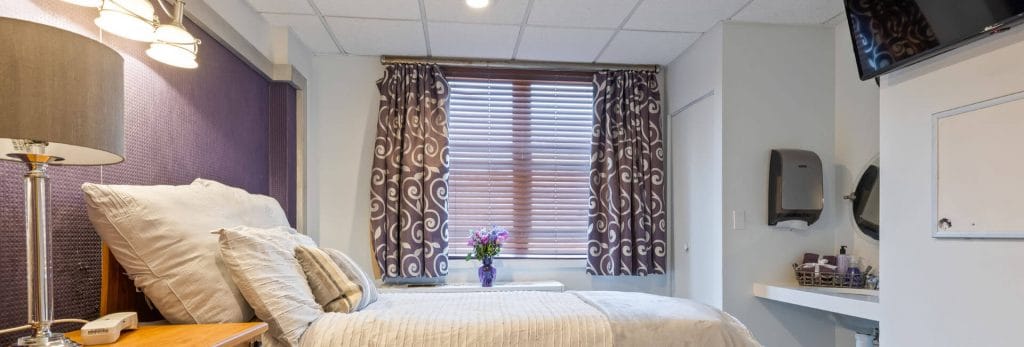
Operated and owned by Mohammud Alam, Quantum Rehabilitation and Nursing is a 120-bed skilled nursing home in Middle Island, a residential area of Suffolk County, New York. Families can pay through Medicare, Medicaid, and private pay to cover both short-term rehabilitation and longer-term care needs. The facility’s location in a moderately walkable neighborhood allows families to accomplish some errands on foot.

The facility offers rehabilitation and recovery services, including specialized programs in neurological rehabilitation and COVID recovery, as well as general rehabilitation services. Residents usually stay for 125 days after hospital discharge while recovering before returning home. Some residents stay longer for ongoing nursing care. The facility’s occupancy rate is 86%, with 103 of the 120 beds currently occupied. Nurses work 24 hours a day to provide care to residents throughout the day.

Daily nurse staffing averages nearly 3 hours per resident. Registered nurses provide about 47 minutes of that time. That level of direct nursing support helps residents during recovery and ongoing care. The home also has a modern rehabilitation gym for physical therapy, with a strong focus on quality care and comfortable living spaces.

State inspections over the past decade identified minor deficiencies in resident records and care planning. However, these were corrected promptly. The facility’s consistency across multiple inspections is a good signal for families evaluating the home’s daily operations.

Quality ratings

Measured by Centers for Medicare & Medicaid Services (CMS)

Overall rating Info The Overall CMS Rating combines results from health inspections, staffing levels and quality measures. Health inspections carry the most weight. Staffing and quality scores can increase or decrease the final rating based on performance compared to state and national standards.
▲ 62.7% Above NY avg. ▲ 62.7% Above NY avg.NY average: 3.1Click the badge to see the full State ranking.Click here to see the full State ranking.
Health Inspection Info Based on the results of the facility's three most recent standard inspections and any complaint investigations. CMS reviews the number, scope, and severity of deficiencies, with more recent findings weighted more heavily.
▲ 41.3% Above NY avg. ▲ 41.3% Above NY avg.NY average: 2.8Click the badge to see the full State ranking.Click here to see the full State ranking.
Staffing Info Measures average nursing staff hours per resident per day, including Registered Nurses (RNs) and total nursing staff. Ratings are adjusted based on the level of care residents require and are compared to state and national benchmarks.
▼ 26.4% Below NY avg. ▼ 26.4% Below NY avg.NY average: 2.7Click the badge to see the full State ranking.Click here to see the full State ranking.
Quality Measures Info Based on clinical and physical health indicators reported to CMS, such as hospital readmissions, falls, pressure ulcers, and improvements in mobility. These measures reflect how well residents' health needs are being managed.
▲ 30.9% Above NY avg. ▲ 30.9% Above NY avg.NY average: 3.8Click the badge to see the full State ranking.Click here to see the full State ranking.

Staffing hours breakdown

Info Daily nursing hours per resident by staff type, reported to CMS. Higher is generally better — compare this facility to state and national averages to see where staffing stands.

Hours per resident per day — compared to New York state averages

Total nursing care / resident Info This home is ranked 296th out of 407 homes in New York for nurse hours. Total adjusted nursing hours per resident per day, combining RN, LPN, and aide time. CMS adjusts this for case-mix so facilities can be fairly compared.
2h 55m per day
Rank #296 / 407Nurse hours — State benchmarkedThis home is ranked 296th out of 407 homes in New York. Shows adjusted nurse hours per resident per day benchmarked to the New York average, with a ranking across 407 New York facilities. More hours mean more direct care. The national average is about 3.5 hrs; below 3.0 is a red flag.Rankings are based only on facilities in New York that report data for that category. Facilities without available data are excluded from the ranking.Click the rank badge to see the full State ranking.Click here to see the full State ranking.
This facility New York avg (3h 35m per day)
vs New York avg
-19%

2 of 6 metrics below state avg

Standout metric Registered Nurse (RN) is +38% above state avg
Staff typeHours / Day / Residentvs state avg
Registered Nurse (RN) Info RNs hold the highest nursing license and can assess residents, interpret test results, and direct care plans. More RN hours per day often signals stronger clinical oversight and faster response to health changes. 58m per day ▲ 38% State avg: 42m per day · National avg: 41m per day
LPN / LVN Info Licensed Practical Nurses (LPNs) or Licensed Vocational Nurses (LVNs) deliver routine hands-on care — medication administration, wound dressing, and monitoring vital signs. They work under RN supervision and make up a large share of daily bedside care. 54m per day ▲ 17% State avg: 46m per day · National avg: 52m per day
Nurse Aide Info Certified Nurse Aides (CNAs) provide the most direct day-to-day assistance: bathing, dressing, feeding, and mobility. Nurse aide hours are typically the largest staffing category and directly affect residents' quality of life. 2h 7m per day ▼ 3% State avg: 2h 11m per day · National avg: 2h 20m per day
Weekend Total Nursing Info Combined nursing hours (RN + LPN + Nurse Aide) per resident per day on weekends. Staffing often drops on weekends — this figure reveals whether the facility maintains adequate coverage outside of weekday hours. 3h 14m per day ■ Avg State avg: 3h 10m per day · National avg: 3h 26m per day
Physical Therapist Info Hours per resident per day provided by licensed Physical Therapists (PTs) or PT Assistants. PT services help residents recover mobility after injury or illness and are especially important for post-acute (short-stay) rehabilitation. 4m per day ▼ 49% State avg: 7m per day · National avg: 4m per day
Weekend RN Info Registered nurse hours specifically on weekends. Facilities sometimes reduce RN presence on Saturdays and Sundays — a low weekend RN figure compared to weekday hours can indicate reduced clinical oversight when most administrative staff are absent. 33m per day ▲ 17% State avg: 28m per day · National avg: 28m per day

Capacity and availability

Avg. Length of Stay Info Average number of days residents stay at this facility, based on CMS cost report data. Shorter stays often reflect post-acute or rehab care; longer stays reflect long-term care.
125 days
Bed community size
120-bed community Rank #412 / 748Bed count — State benchmarkedThis home is ranked 412th out of 748 homes in New York. Shows this facility's certified or reported bed count compared to other New York facilities. Larger communities may offer more amenities, programs, and on-site services for residents and families.Rankings are based only on facilities in New York that report data for that category. Facilities without available data are excluded from the ranking.Click the rank badge to see the full State ranking.Click here to see the full State ranking.
A larger shared setting that may offer more common spaces and organized community services.
Walk Score
Walk Score: 54 / 100 Rank #755 / 1173Walk Score — State benchmarkedThis home is ranked 755th out of 1173 homes in New York. Shows how walkable this facility's neighborhood is compared to the average Walk Score across New York facilities. Higher scores benefit residents, families, and staff.Rankings are based only on facilities in New York that report data for that category. Facilities without available data are excluded from the ranking.Click the rank badge to see the full State ranking.Click here to see the full State ranking.
Moderately walkable. Some errands can be accomplished on foot, with a mix of nearby amenities.

About this community

License Details

Facility TypeNursing Home
StatusActive
CountySuffolk
License Number5151324N
CMS Certification Number335719

Ownership & Operating Entity

Quantum Rehabilitation and Nursing LLC is legally operated by Quantum Rehabilitation and Nursing, LLC (For Profit).

Owner NameQuantum Rehabilitation And Nursing, LLC (For Profit)

Therapy & Rehabilitation

1 service
Rehabilitation Services

Staffing & Medical

1 service
24-Hour Staffing

Amenities & Lifestyle

State-Of-The-Art Gym
Beautiful Rooms
Caring Staff
Specific ProgramsNeuro, Neurological Rehab, COVID Rehab
Operating Hours24 Hours / 7 Days-a-Week

Contact Quantum Rehabilitation and Nursing LLC

Inspection History

In New York, the Department of Health, Office of Aging and Long Term Care performs unannounced onsite inspections to monitor compliance with state and federal healthcare regulations.

Inspection Score Info A composite 0–100 score combining this facility's inspections, citations, complaints, and enforcement actions relative to the New York state average. The score below shows how many points this facility sits above or below the typical New York nursing home score (the benchmark); higher is better.This is a proprietary Assisted Living Magazine score.

5 points below the New York average for nursing homes (83/100)

Rank #382 / 593 in New York Inspection Score — State benchmarked This home is ranked 382nd out of 593 homes in New York. Shows this facility's inspection score compared to the New York average among 593 comparable communities in the ranking pool. Rankings are based only on facilities in New York that report data for that category. Facilities without available data are excluded from the ranking. This is a proprietary Assisted Living Magazine score. Inspection score: 78 out of 100. Letter grade C+. 5 points below the New York average for nursing homes (83/100)

Enforcement Actions Info Enforcement actions are formal penalties or interventions imposed by New York regulators when a nursing home fails to meet state or federal care, safety, or regulatory standards. They may include directed plans of correction, civil monetary penalties, denial of payment, or appointment of temporary management.

Since 2014
4 enforcement actions

This facility has 4 enforcement actions. 33% of New York nursing homes have zero, and the statewide average is 1.6.

  • April 22, 2022 Quality of Care #NH-22-079
  • October 7, 2020 Quality of Care #NH-21-118
  • April 18, 2019 Multiple Deficiencies #NH-19-046
  • August 19, 2014 Multiple Deficiencies #NH-16-174

Inspection Scorecard Info This scorecard compares key inspection, citation, and complaint metrics at this facility against the New York state average. Metrics rated ≥15% worse than average are highlighted in red; those ≥15% better are highlighted in green.

Since 2021 vs. New York state average
Overall vs. NY average 4 Worse Metrics worse than New York average:
• Total citations (62% above)
• Life safety citations (25% above)
• Citations per year (62% above)
• Citations per inspection (114% above)
8 Better Metrics better than New York average:
• Health citations (20% below)
• Total inspections (22% below)
• Inspections with citations (25% below)
• Inspection citation rate (2% below)
• Total complaints (52% below)
• Complaints per year (52% below)
• Complaints per bed (28% below)
• Complaint investigations (20% below)
Latest Inspection December 23, 2024 Complaint Investigation

Citations Info Citations are formal regulatory issues recorded during state inspections.

This FacilityNY Averagevs. NY Avg
Total citations Info Formal regulatory issues recorded by inspectors across all inspection types. 2113 This facility has 62% more total citations than a typical New York nursing home (21 vs. NY avg 13).↑ 62% worse
Health citations Info Citations related to resident care, clinical practices, and day-to-day operations. 1620 This facility has 20% fewer health citations than a typical New York nursing home (16 vs. NY avg 20).↓ 20% better
Life safety citations Info Citations related to building safety — fire prevention, emergency egress, and similar. 54 This facility has 25% more life safety citations than a typical New York nursing home (5 vs. NY avg 4).↑ 25% worse
Citations per year Info Average citations per year since 2021. 4.22.6 This facility has 62% more citations per year than a typical New York nursing home (4.2 vs. NY avg 2.6).↑ 62% worse
Citations per inspection Info Average citations per inspection. 31.4 This facility has 114% more citations per inspection than a typical New York nursing home (3 vs. NY avg 1.4).↑ 114% worse

Inspections Info State inspections evaluate whether the facility meets health and safety standards.

This FacilityNY Averagevs. NY Avg
Total inspections Info Combined count of all routine and focused inspections. Excludes complaint investigations. 79 This facility has 22% fewer total inspections than a typical New York nursing home (7 vs. NY avg 9).↓ 22% better
Inspections with citations Info Inspections that resulted in at least one regulatory citation. 34 This facility has 25% fewer inspections with citations than a typical New York nursing home (3 vs. NY avg 4).↓ 25% better
Inspection citation rate Info Percentage of inspections that resulted in at least one citation. 43%44% This facility has 1 percentage point lower inspection citation rate than a typical New York nursing home (43% vs. NY avg 44%).↓ 1% better

Complaints & Investigations Info Complaints are formal concerns filed by residents, families, or staff. Investigations are on-site follow-ups.

This FacilityNY Averagevs. NY Avg
Total complaints Info Formal expressions of concern made by residents, families, or staff. 3879 This facility has 52% fewer total complaints than a typical New York nursing home (38 vs. NY avg 79).↓ 52% better
Complaints per year Info Average complaints per year since 2021. 7.615.8 This facility has 52% fewer complaints per year than a typical New York nursing home (7.6 vs. NY avg 15.8).↓ 52% better
Complaints per bed Info Size-adjusted complaint rate based on occupied beds. 0.360.50 This facility has 28% fewer complaints per bed than a typical New York nursing home (0.36 vs. NY avg 0.5).↓ 28% better
Complaint investigations Info On-site investigations triggered by complaints filed with New York regulators. 1215 This facility has 20% fewer complaint investigations than a typical New York nursing home (12 vs. NY avg 15).↓ 20% better

Inspection Reports Summary Info An editor-reviewed summary of the themes and findings across this facility's recent inspection reports.

  • December 23, 2024 inspection found one Level 2 deficiency in resident records identifiable information, which was corrected by March 3, 2025.
  • July 15, 2024 inspection identified two Level 2 deficiencies in care plan timing and building construction, both corrected by late 2024.
  • June 30, 2022 inspection noted one Level 2 deficiency in resident records identifiable information, corrected by August 23, 2022.

Health Inspection History

Inspections since 2021
Total health inspections 4

New York average 3.6


Last Health inspection on Dec 2024

Total health citations
7 Rank #31 / 414Health citations — State benchmarkedThis home is ranked 31st out of 414 homes in New York. Shows this facility's total health deficiency citations benchmarked to the New York State average, with a ranking across all 414 NY facilities. Lower citation counts earn a better rank.Rankings are based only on facilities in New York that report data for that category. Facilities without available data are excluded from the ranking.Click the rank badge to see the full State ranking.Click here to see the full State ranking.

New York average 18.5

Citations per inspection
1.75 Rank #13 / 414Citations per inspection — State benchmarkedThis home is ranked 13th out of 414 homes in New York. Shows average deficiency citations per CMS inspection for this facility versus the New York mean across 414 facilities with citation data. Lower is better.Rankings are based only on facilities in New York that report data for that category. Facilities without available data are excluded from the ranking.Click the rank badge to see the full State ranking.Click here to see the full State ranking.

New York average 5.05


Health citations are formal notices following inspections when they fail to comply with safety and care standards.

6 of 7 citations resulted from standard inspections; and 1 of 7 resulted from complaint investigations.

Breakdown of citation severity (last 5 years)
Critical health citations
0
100% better than New York average

New York average: 0.2


Serious health citations
0
100% better than New York average

New York average: 0.2

0 critical citations New York average: 0.2

0 serious citations New York average: 0.2

7 moderate citations New York average: 17.4

0 minor citations New York average: 0.7
Citations history (last 5 years)
Care Planning moderate citation Dec 23, 2024
Corrected

Care Planning moderate citation Jul 15, 2024
Corrected

Administration moderate citation Jun 26, 2023
Corrected

Quality of Care moderate citation Jun 26, 2023
Corrected

Infection Prevention & Vaccination

How this facility protects residents through staff vaccination policies and immunization practices.

Employee Flu Vaccination Rate: 96%

Percentage of facility employees vaccinated against influenza.

Lawsuit overview for Quantum Rehabilitation and Nursing LLC

Summary of court-record activity tied to this facility, compiled from publicly available case dockets.

Source: State court e-filing records

Total Cases Info Every lawsuit on record involving this facility since the earliest filing. Long-term volume signals overall legal exposure. 11
Active Cases Info Lawsuits still moving through the courts. Active claims can affect day-to-day operations, settlement risk, and insurance posture. 1
Closed Info Cases that have been disposed of — dismissed, settled, or decided. Shows how the facility has historically resolved disputes. 10
Since Info Year of the earliest case on record. A long history with steady filings suggests persistent issues; a recent first filing means newer exposure. 2020
Most Recent Info Most recent filing on record. Recent activity means legal disputes are still being raised against this facility. 2025
Next Court Date Info Next scheduled court appearance on record across active cases. Apr 23, 2026

Staffing Data

Reporting period: October 1 – December 31, 2025 (Q4 2025). Source: CMS Payroll-Based Journal report.

Total staff 219
Employees 183
Contractors 36
Staff to resident ratio 2.05 : 1
1068% more staff per resident than New York average
New York average ratio: 0.18 : 1 New York average ratio: 0.18 : 1See full New York ranking
Avg staff/day 71
Average shift 7.3 hours
5% worse than New York average
New York average: 7.7 hours New York average shift: 7.7 hoursSee full New York ranking
Total staff hours (quarter) 47,539

Nursing staff breakdown

Q4 2025 · Oct 1 – Dec 31 More info This data comes from the CMS Payroll-Based Journal report covering October 1 – December 31, 2025.
Registered Nurse

Manages medical care and health needs.

RN Staff Info 35 total: 31 full-time employees and 4 contractors. 35
Average shift length Info Average shift length. Calculated as total hours divided by days worked and average staff per day. 7.3 hours
Licensed Practical Nurse

Assists with medical care and medications.

LPN Staff Info 57 total: 36 full-time employees and 21 contractors. 57
Average shift length Info Average shift length. Calculated as total hours divided by days worked and average staff per day. 7.4 hours
Certified Nursing Assistant

Helps with daily care and mobility.

CNA Staff Info All 79 CNA Staff are full-time employees. No contractors work on this role. 79
Average shift length Info Average shift length. Calculated as total hours divided by days worked and average staff per day. 7.4 hours

Contractor staffing

Q4 2025 · Oct 1 – Dec 31 More info This data comes from the CMS Payroll-Based Journal report covering October 1 – December 31, 2025.

Total hours from contractors

7.4%

3,515 contractor hours this quarter

Licensed Practical Nurse: 21 Respiratory Therapy Technician: 7 Registered Nurse: 4 Physical Therapy Assistant: 2 Medical Director: 1 Speech Language Pathologist: 1

Staff by category

Q4 2025 · Oct 1 – Dec 31 More info This data comes from the CMS Payroll-Based Journal report covering October 1 – December 31, 2025.
Certified Nursing Assistant7907921,26192100%7.4
Licensed Practical Nurse3621578,97192100%7.4
Registered Nurse314358,27592100%7.3
Other Dietary Services Staff160163,39692100%7.2
Clinical Nurse Specialist9091,4596874%7.5
Administrator2029156571%7.5
Mental Health Service Worker2028786470%7.5
Dietitian3038497379%7.5
Respiratory Therapy Technician0776015964%5.8
Occupational Therapy Aide2025316267%6.6
Medical Director0111302628%5
Qualified Activities Professional2021191718%7
Speech Language Pathologist011782224%3.5
Physical Therapy Assistant022421011%3.8
RN Director of Nursing1013855%7.5
79 Certified Nursing Assistant
% of Days 100%
57 Licensed Practical Nurse
% of Days 100%
35 Registered Nurse
% of Days 100%
16 Other Dietary Services Staff
% of Days 100%
9 Clinical Nurse Specialist
% of Days 74%
2 Administrator
% of Days 71%
2 Mental Health Service Worker
% of Days 70%
3 Dietitian
% of Days 79%
7 Respiratory Therapy Technician
% of Days 64%
2 Occupational Therapy Aide
% of Days 67%
1 Medical Director
% of Days 28%
2 Qualified Activities Professional
% of Days 18%
1 Speech Language Pathologist
% of Days 24%
2 Physical Therapy Assistant
% of Days 11%
1 RN Director of Nursing
% of Days 5%

Penalties and fines

Federal penalties imposed by CMS for regulatory violations, including civil money penalties (fines) and denials of payment for new Medicare/Medicaid admissions.

Source: CMS Penalties Database

No penalties in the past 3 years

No civil money penalties or payment denials were reported in the last 3 years.

Quality of care over time

These measures show how residents usually do over time at this home, based on health outcomes and preventive care.

High-risk clinical events score Info A composite score based on pressure ulcers, falls with injury, weight loss, walking ability decline, and activities of daily living decline. 6.9
30% better than New York average

New York average: 9.8

Functional decline score Info A composite score based on activities of daily living decline, walking ability decline, and incontinence. 10.6
42% better than New York average

New York average: 18.1

Long-stay resident measures
Significantly above average New York avg: 4.0 Info CMS star rating based on long-stay quality measure performance. 5 stars = significantly above average, 1 star = significantly below average.
Need for Help with Daily Activities Increased Info Percent of long-stay residents whose need for help with daily activities has increased 14.8%
10% better than New York average

New York average: 16.4%

Walking Ability Worsened Info Percent of long-stay residents whose ability to move independently worsened 7.6%
54% better than New York average

New York average: 16.6%

Low Risk Residents with Bowel/Bladder Incontinence Info Percent of low risk long-stay residents who lose control of their bowels or bladder 9.4%
56% better than New York average

New York average: 21.4%

Falls with Major Injury Info Percent of long-stay residents experiencing one or more falls with major injury 3.6%
21% worse than New York average

New York average: 3.0%

High Risk Residents with Pressure Ulcers Info Percent of long-stay high risk residents with pressure ulcers 4.9%
31% better than New York average

New York average: 7.2%

Urinary Tract Infection Info Percent of long-stay residents with a urinary tract infection 0.3%
76% better than New York average

New York average: 1.4%

Lost Too Much Weight Info Percent of long-stay residents who lose too much weight 3.5%
43% better than New York average

New York average: 6.1%

Depressive Symptoms Info Percent of long-stay residents who have depressive symptoms 54.6%
202% worse than New York average

New York average: 18.1%

Antipsychotic Use Info Percent of long-stay residents who received an antipsychotic medication 13.5%
7% worse than New York average

New York average: 12.6%

Pneumococcal Vaccine Info Percent of long-stay residents assessed and appropriately given the pneumococcal vaccine 100.0%
9% better than New York average

New York average: 91.4%

Influenza Vaccine Info Percent of long-stay residents assessed and appropriately given the seasonal influenza vaccine 97.6%
In line with New York average

New York average: 95.2%

Hospitalizations per 1,000 days Info Number of hospitalizations per 1,000 long-stay resident days. 1.64
In line with New York average

New York average: 1.71

ED visits per 1,000 days Info Number of outpatient emergency department visits per 1,000 long-stay resident days. 0.48
64% better than New York average

New York average: 1.35

Short-stay resident measures
Significantly above average New York avg: 3.5 Info CMS star rating based on short-stay quality measure performance. 5 stars = much above average, 1 star = much below average.
Pneumococcal Vaccine Info Percent of short-stay residents assessed and appropriately given the pneumococcal vaccine 99.7%
30% better than New York average

New York average: 76.6%

Antipsychotic medication increase Info Percent of short-stay residents who newly received an antipsychotic medication 0.7%
45% better than New York average

New York average: 1.3%

Influenza Vaccine Info Percent of short-stay residents assessed and appropriately given the seasonal influenza vaccine 99.0%
26% better than New York average

New York average: 78.8%

Re-hospitalized after SNF stay Info Percentage of short-stay residents who were re-hospitalized after their nursing home admission. 15.8%
23% better than New York average

New York average: 20.6%

Emergency department visits Info Percentage of short-stay residents who had an outpatient emergency department visit. 5.2%
46% better than New York average

New York average: 9.7%

Falls with major injury Info Percentage of SNF residents who experience falls with major injury during their stay. 1.1%
45% worse than New York average

New York average: 0.8%

Ability to care for self at discharge Info Percentage of residents at or above expected ability to care for themselves at discharge. 68.6%
28% better than New York average

New York average: 53.7%

Successful return to home or community Info Rate of successful return to home or community from a skilled nursing facility. 63.6%
26% better than New York average

New York average: 50.6%

Breakdown by payment type

Medicare

60% of new residents, usually for short-term rehab.

Typical stay 1 - 2 months

Private pay

20% of new residents, often for short stays.

Typical stay 3 - 4 months

Medicaid

20% of new residents, often for long-term daily care.

Typical stay 1 years

Facility Characteristics

Source: CMS Long-Term Care Facility Characteristics (Data as of Jan 2026)

Total residents 107
Medicare
28
26.2% of residents
Medicaid
55
51.4% of residents
Private pay or other
24
22.4% of residents
Programs & Services
Residents Group

Residents meet regularly to discuss policies, care quality, and activities

Active Resident Council

Organized group of residents that meets regularly to discuss facility policies, quality of life, and activities.

Finances and operations

Based on CMS SNF Cost Report for fiscal year ending in 12/2023.

For-profit
LLC
Net patient revenue Info Net patient revenue — what the home actually collects for resident care, after contractual allowances, bad debt and discounts are subtracted from its gross charges (CMS cost report, Worksheet G-3). It covers resident care only; money the home earns from other sources is shown separately as "Other income."
$18.8M
Net patient income Info Net patient income: net patient revenue minus the home's total operating expenses. A positive figure means it earns more from resident care than it spends to deliver it; a negative figure means the opposite. It excludes non-operating "other income."
-$3.3M
For-profit LLC
Net patient revenue Info Net patient revenue — what the home actually collects for resident care, after contractual allowances, bad debt and discounts are subtracted from its gross charges (CMS cost report, Worksheet G-3). It covers resident care only; money the home earns from other sources is shown separately as "Other income."
$18.8M Rank #272 / 403Revenue — State benchmarkedThis home is ranked 272nd out of 403 homes in New York. Shows this facility's annual revenue compared to the New York average. Higher revenue generally means more resources for staffing and capital — read alongside Payroll %.Rankings are based only on facilities in New York that report data for that category. Facilities without available data are excluded from the ranking.Click the rank badge to see the full State ranking.Click here to see the full State ranking.
Net patient income Info Net patient income: net patient revenue minus the home's total operating expenses. A positive figure means it earns more from resident care than it spends to deliver it; a negative figure means the opposite. It excludes non-operating "other income."
-$3.3M
Other income Info Money the home earns outside of resident care — such as investments, grants, rentals and other non-operating sources (CMS cost report, Worksheet G-3). It is tracked separately from net patient revenue: it is not part of that figure, and it is not included in net patient income.
$3.4M
Payroll costs Info Staff salaries plus wage-related costs — benefits such as payroll taxes, health insurance and retirement — from the home's own accounting records (CMS cost report, Worksheet A). Contract or agency labor is counted separately, under other operating costs. Rank #274 / 403Payroll — State benchmarkedThis home is ranked 274th out of 403 homes in New York. Shows total annual staff payroll benchmarked to the New York average. Higher payroll investment relative to peers often signals better staffing and less reliance on cheaper contract labor.Rankings are based only on facilities in New York that report data for that category. Facilities without available data are excluded from the ranking.Click the rank badge to see the full State ranking.Click here to see the full State ranking.
$10.7M 56.7% of net patient revenue Info Payroll as a share of revenue: staff salaries and wage-related benefits divided by net patient revenue. A higher figure means more of each revenue dollar goes to staff pay. Rank #215 / 403Payroll % — State benchmarkedThis home is ranked 215th out of 403 homes in New York. Shows payroll as a percentage of revenue versus the New York average. Well-run New York facilities typically land around 53–65% — the top third Statewide. Below 25% may signal understaffing or heavy agency use — read with Staffing ratings.Rankings are based only on facilities in New York that report data for that category. Facilities without available data are excluded from the ranking.Click the rank badge to see the full State ranking.Click here to see the full State ranking.
Other operating costs Info Everything it costs to run the home apart from payroll — food, utilities, supplies, maintenance, contract labor and administration. Calculated as total operating expense minus payroll (staff salaries and wage-related benefits).
$11.5M
Total costs Info The home's total operating expense for the year — all the costs of running it, salaries included (CMS cost report, Worksheet G-3).
$22.2M

Who this home usually serves

TYPE OF STAY

Mostly short-term rehab stays

Most residents typically stay for a few weeks or months before returning home or moving on.

Most new residents arrive under Medicare (60% of admissions), and a typical Medicare stay runs around 1 - 2 months.

Admissions
308 total

Coverage residents most often arrive under.

Medicare 60%
Private pay 20%
Medicaid 20%
Discharges
319 total

Coverage residents most often leave under.

Medicare 57%
Private pay 21%
Medicaid 22%

Places of interest near Quantum Rehabilitation and Nursing LLC

Address 0.0 miles from city center Info Estimated distance in miles from Middle Island's city center to Quantum Rehabilitation and Nursing LLC's address, calculated via Google Maps.

Calculate Travel Distance to Quantum Rehabilitation and Nursing LLC

Add your location

Address

Compare Nursing Homes around Suffolk County

The information below is reported by the New York State Department of Health.

5 facilities compared · CMS & NY Dept. of Health data

Milford Health & Rehabilitation Center
NH
HOS
PC
RC
SNF
Milford (Morningside)120 93.3% +11%3.35 -14%-16%$0-153.8-115- 39 Marvin Ostreicher 2012 Family Trust$19.4MFiscal year ending 09/2023$10.7MFiscal year ending 09/202355.1%Fiscal year ending 09/202375064
Massapequa Center Rehabilitation & Nursing
NH
ADC
PC
SNF
Amityville (Louden Avenue)
320
Facility 320
NY AVG 160
Rank #45 / 748
89.1%
Facility 89.1%
NY AVG 88.3%
Rank #242 / 436
+1%
3.01
Facility 3.01
NY AVG 3.58
Rank #271 / 407
-14%-16%
$0
Facility $0
NY AVG $67.6k
Rank #1 / 415
75
Facility 75
NY AVG 83
Rank #436 / 593
11
Facility 11
NY AVG 18.5
Rank #94 / 414
5.5
Facility 5.5
NY AVG 5.1
Rank #266 / 414
-290-
62
Facility 62
NY AVG 63
Rank #680 / 1173
Aharon Bleier
$58.5MFiscal year ending 12/2023
Facility $58.5MFiscal year ending 12/2023
NY AVG $32.0M
Rank #34 / 403
$28.0MFiscal year ending 12/2023
Facility $28.0MFiscal year ending 12/2023
NY AVG $10.7M
Rank #42 / 403
47.8%Fiscal year ending 12/2023
Facility 47.8%Fiscal year ending 12/2023
NY AVG 37%
Rank #248 / 403
335213
John T Mather Memorial Hospital of Port Jefferson New York Inc
NH
Port Jefferson
249
Facility 249
NY AVG 160
Rank #111 / 748
--
8.88
Facility 8.88
NY AVG 3.58
Rank #1 / 407
+7%+148%
$0
Facility $0
NY AVG $67.6k
Rank #1 / 415
-
12
Facility 12
NY AVG 18.5
Rank #111 / 414
4.0
Facility 4.0
NY AVG 5.1
Rank #128 / 414
-13-
73
Facility 73
NY AVG 63
Rank #564 / 1173
----335853
Luxor at Mills Pond Rehabilitation & Nursing Center
NH
HOS
PC
RC
SNF
St James (Saint James)
250
Facility 250
NY AVG 160
Rank #107 / 748
91.2%
Facility 91.2%
NY AVG 88.3%
Rank #224 / 436
+3%
2.83
Facility 2.83
NY AVG 3.58
Rank #322 / 407
-47%-21%
$0
Facility $0
NY AVG $67.6k
Rank #1 / 415
77
Facility 77
NY AVG 83
Rank #396 / 593
11
Facility 11
NY AVG 18.5
Rank #94 / 414
3.7
Facility 3.7
NY AVG 5.1
Rank #111 / 414
-234-
20
Facility 20
NY AVG 63
Rank #1028 / 1173
Shaya Bernath
$42.0MFiscal year ending 12/2023
Facility $42.0MFiscal year ending 12/2023
NY AVG $32.0M
Rank #90 / 403
$15.2MFiscal year ending 12/2023
Facility $15.2MFiscal year ending 12/2023
NY AVG $10.7M
Rank #97 / 403
36%Fiscal year ending 12/2023
Facility 36%Fiscal year ending 12/2023
NY AVG 37%
Rank #219 / 403
335739
Quantum Rehabilitation and Nursing LLC
NH
SNF
Middle Island
120
Facility 120
NY AVG 160
Rank #412 / 748
--
2.92
Facility 2.92
NY AVG 3.58
Rank #296 / 407
+27%-19%
$0
Facility $0
NY AVG $67.6k
Rank #1 / 415
78
Facility 78
NY AVG 83
Rank #382 / 593
7
Facility 7
NY AVG 18.5
Rank #31 / 414
1.8
Facility 1.8
NY AVG 5.1
Rank #13 / 414
-3-
54
Facility 54
NY AVG 63
Rank #755 / 1173
Mohammud Alam
$18.8MFiscal year ending 12/2023
Facility $18.8MFiscal year ending 12/2023
NY AVG $32.0M
Rank #272 / 403
$10.7MFiscal year ending 12/2023
Facility $10.7MFiscal year ending 12/2023
NY AVG $10.7M
Rank #274 / 403
56.7%Fiscal year ending 12/2023
Facility 56.7%Fiscal year ending 12/2023
NY AVG 37%
Rank #215 / 403
335719

Financial Assistance for
Nursing Home in New York

Quantum Rehabilitation and Nursing LLC is located in Middle Island, New York State.
Here are the financial assistance programs available to residents in New York State.

Get Financial aid guidance

Community First Choice Option

NY Medicaid CFCO

Age 65+ or disabled
General New York resident, Medicaid- eligible, care need (not necessarily nursing home level).
Income Limits (2025) ~$2,829/month 300% FBR, individual
Asset Limits $30,182 individual, higher due to NY Medicaid expansion
NY

Higher asset limit; urban density increases demand.

Benefits
Personal care (5-7 hours/day) Respite care (240 hours/year) Home modifications ($1,500 avg.) Assistive technology ($500 avg.)

Expanded In-Home Services for the Elderly Program (EISEP)

NY EISEP

Age 60+
General New York resident, at risk of decline but not nursing home level.
Income Limits ~$2,500/month individual, varies
Asset Limits $15,000 individual
NY

Cost-sharing required above certain income; urban/rural balance.

Benefits
In-home care (3-5 hours/week) Respite (up to 10 days/year) Case management Transportation (~5 trips/month)

Frequently Asked Questions about Quantum Rehabilitation and Nursing LLC

Who is the owner of Quantum Rehabilitation and Nursing LLC?

Quantum Rehabilitation and Nursing LLC is legally operated by Quantum Rehabilitation and Nursing, LLC (For Profit).

Is Quantum Rehabilitation and Nursing LLC in a walkable area?

Quantum Rehabilitation and Nursing LLC has a walk score of 54. Moderately walkable. Some errands can be accomplished on foot, with a mix of nearby amenities.

What is the license number of Quantum Rehabilitation and Nursing LLC?

According to NY state health department records, Quantum Rehabilitation and Nursing LLC's license number is 5151324N.

What is the occupancy rate at Quantum Rehabilitation and Nursing LLC?

Quantum Rehabilitation and Nursing LLC's occupancy is 85.8%.

Does Quantum Rehabilitation and Nursing LLC operate as a for-profit or non-profit?

Quantum Rehabilitation and Nursing LLC is registered as a for-profit in NY.

How many beds does Quantum Rehabilitation and Nursing LLC have?

Quantum Rehabilitation and Nursing LLC has 120 beds.

Has Quantum Rehabilitation and Nursing LLC had any recent citations?

Quantum Rehabilitation and Nursing LLC has had 21 recently reported citations.

Guides for Better Senior Living

Care Cost Calculator: See Prices in Your Area

Nursing Home Data Explorer

Don’t Wait Too Long: 7 Red Flag Signs Your Parent Needs Assisted Living Now

The True Cost of Assisted Living in 2025 – And How Families Are Paying For It

Understanding Senior Living Costs: Pricing Models, Discounts & Financial Assistance