Explore Open Rooms

1 Contact details
2 What type of senior care service are you looking for?
3 What budget do you have in mind for senior care?
4 How soon do you need to find care?
5 Additional details

Thank you for your interest!

Our team will be in touch shortly to help with next steps.

Nursing Home

Rancho Mirage Health and Rehabilitation Center

Nursing Home

Rancho Mirage Health and Rehabilitation Center

39950 Vista Del Sol, Rancho Mirage, CA 92270 View map
Overview of Rancho Mirage Health and Rehabilitation Center

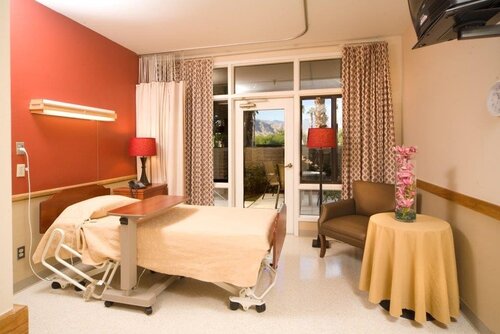
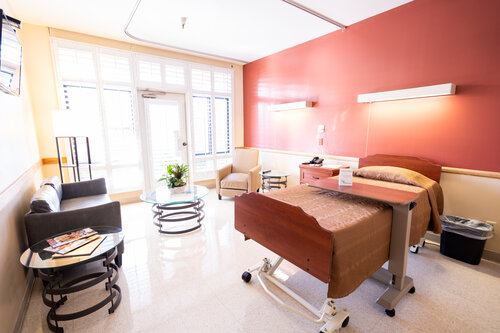
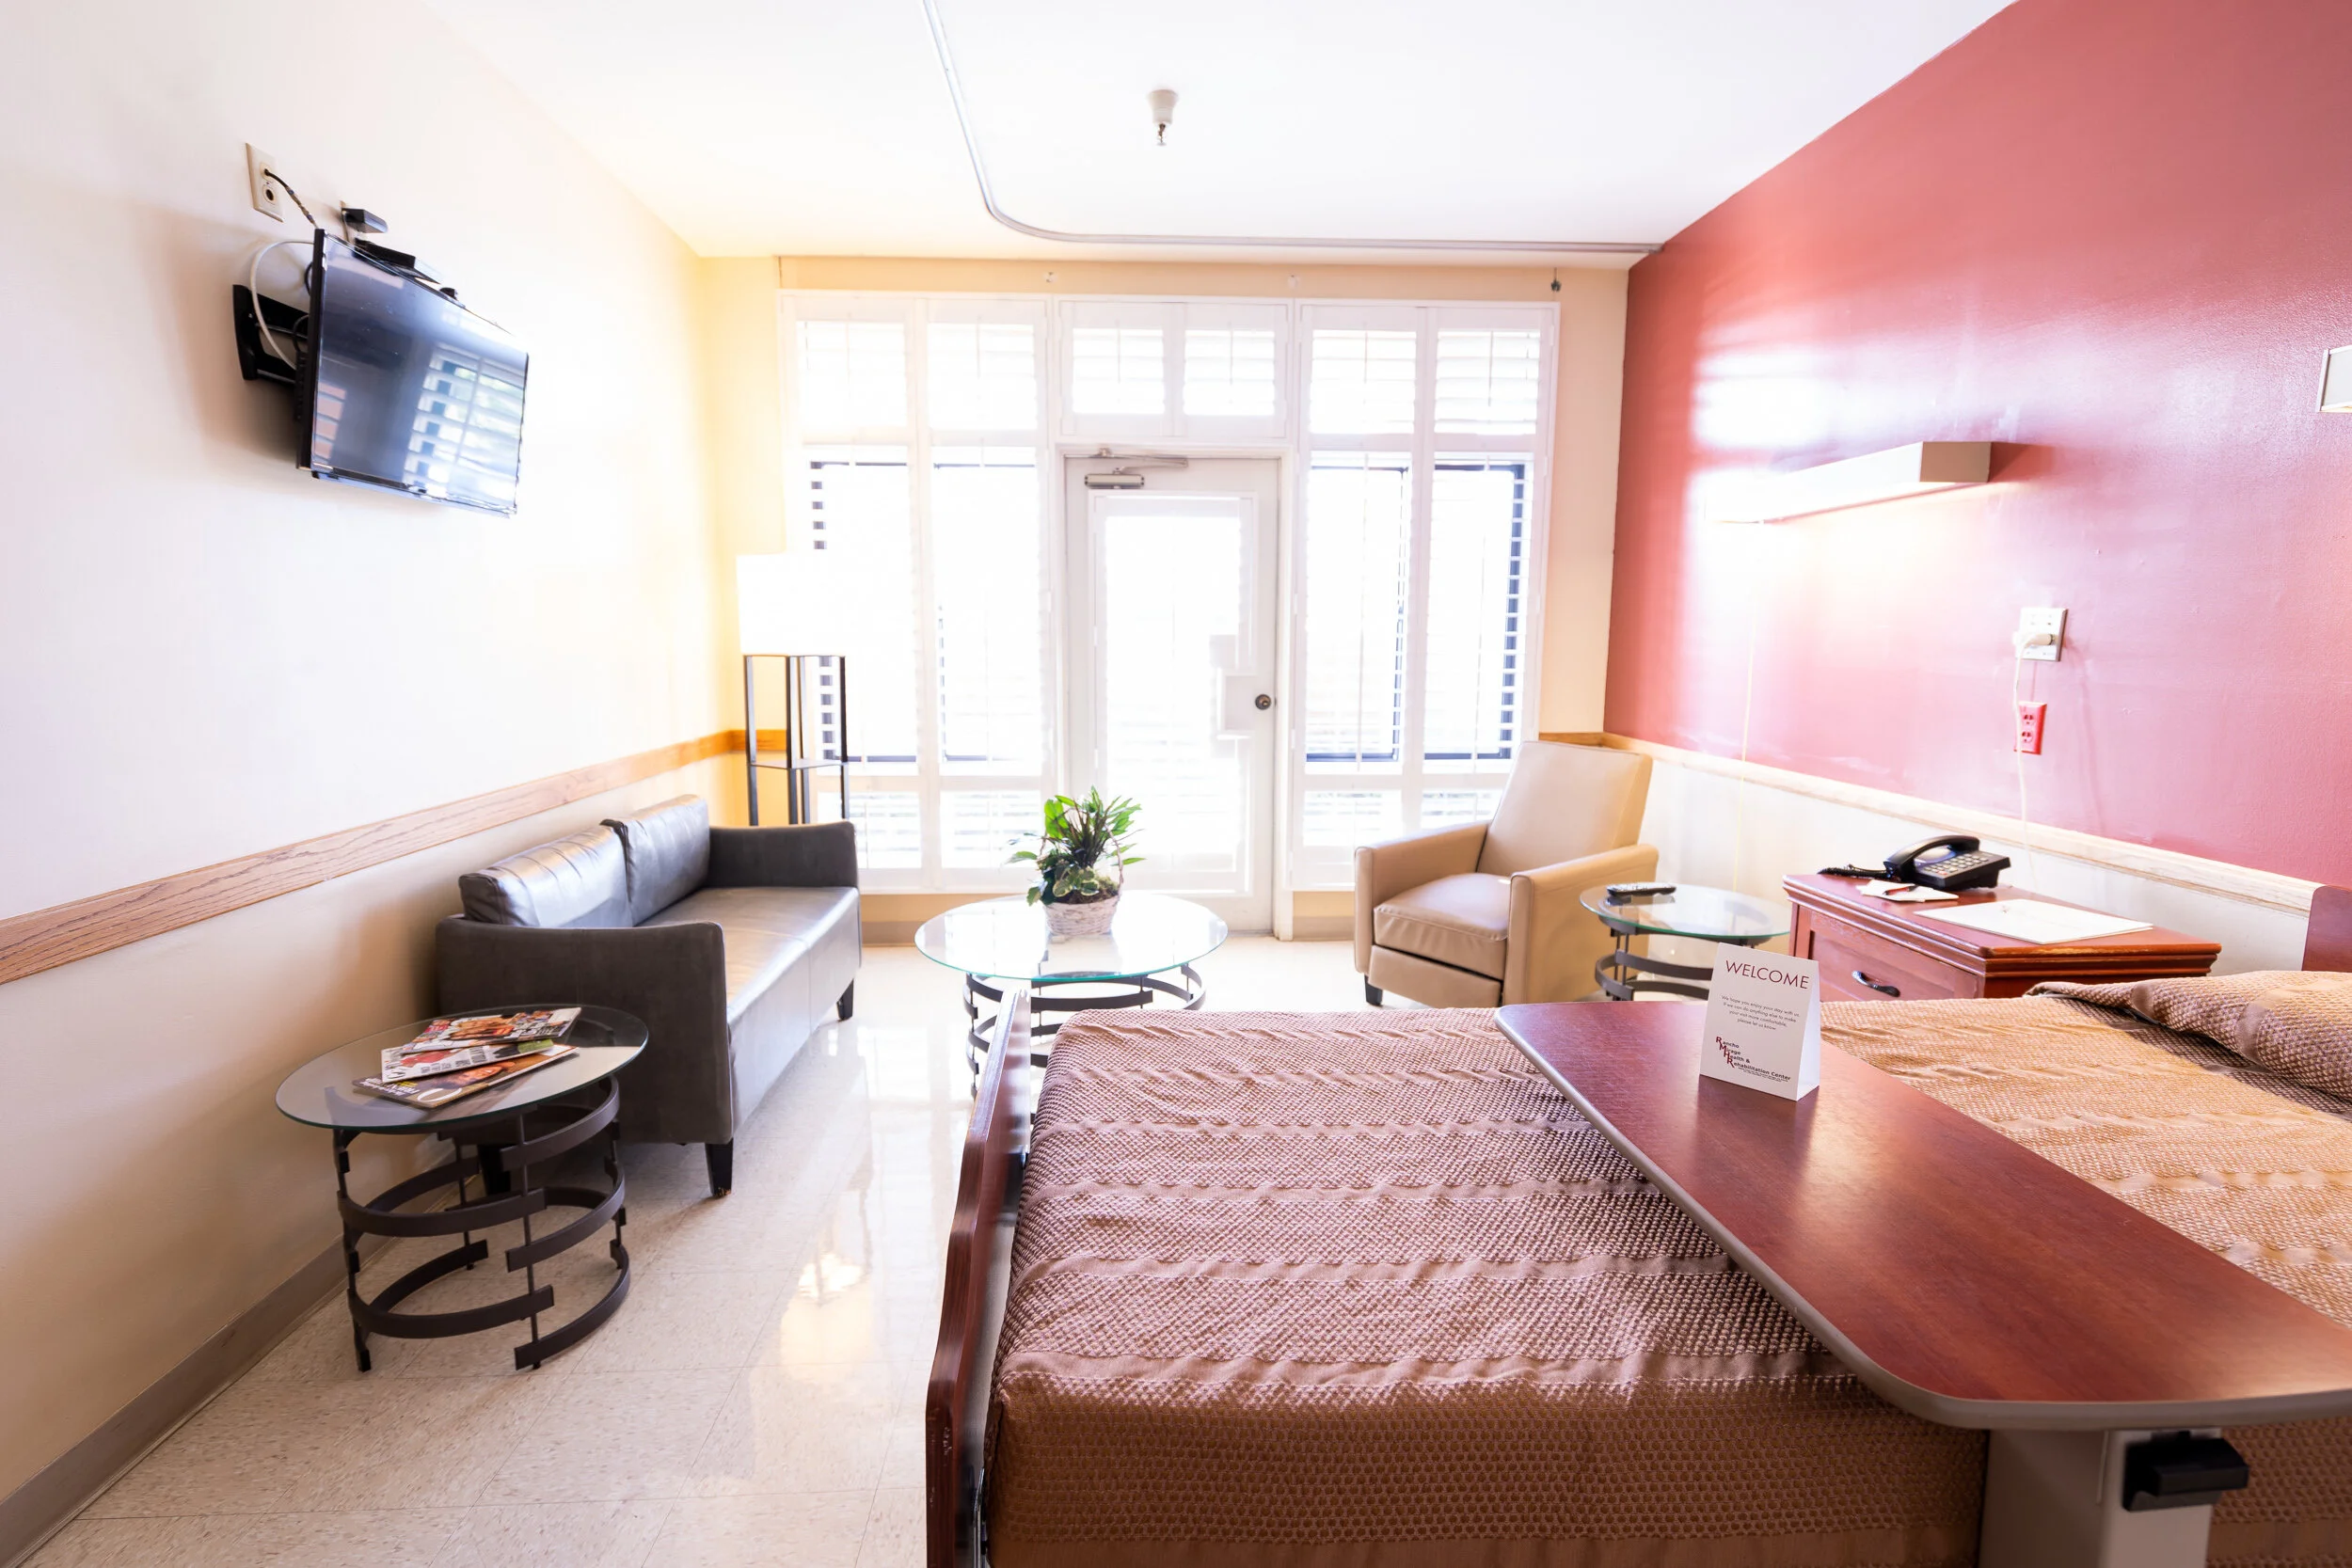
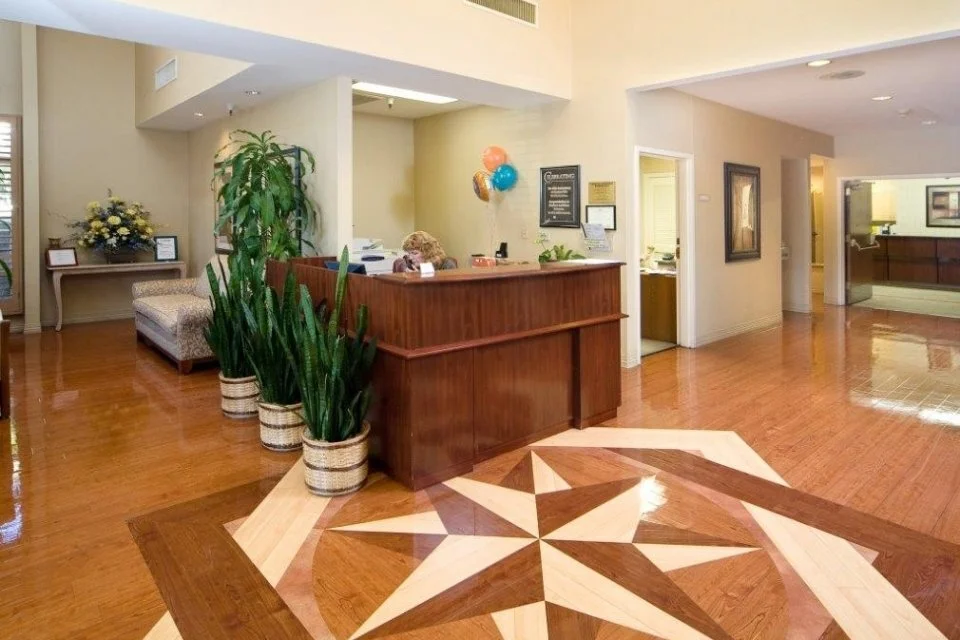
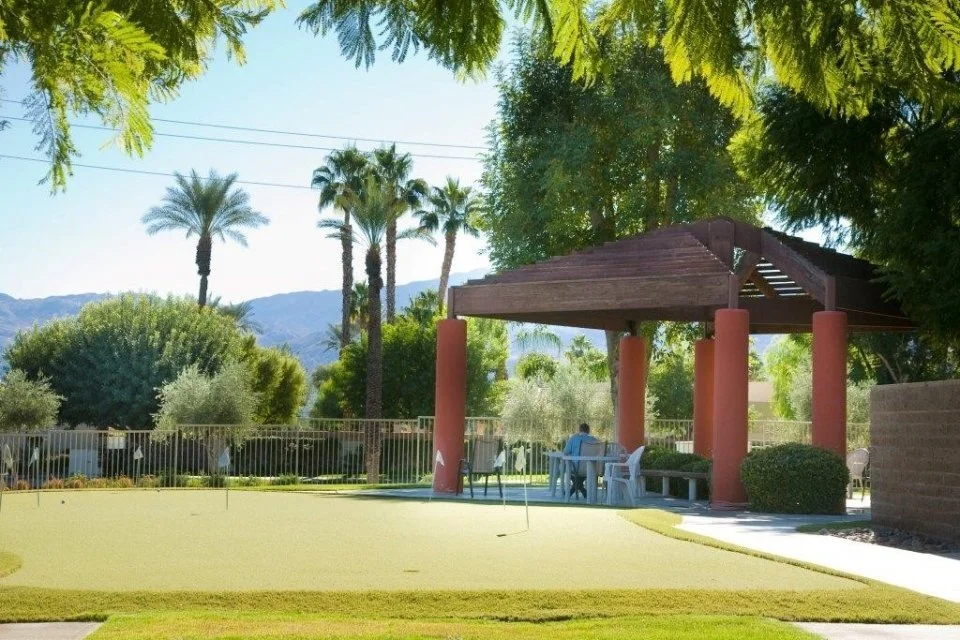
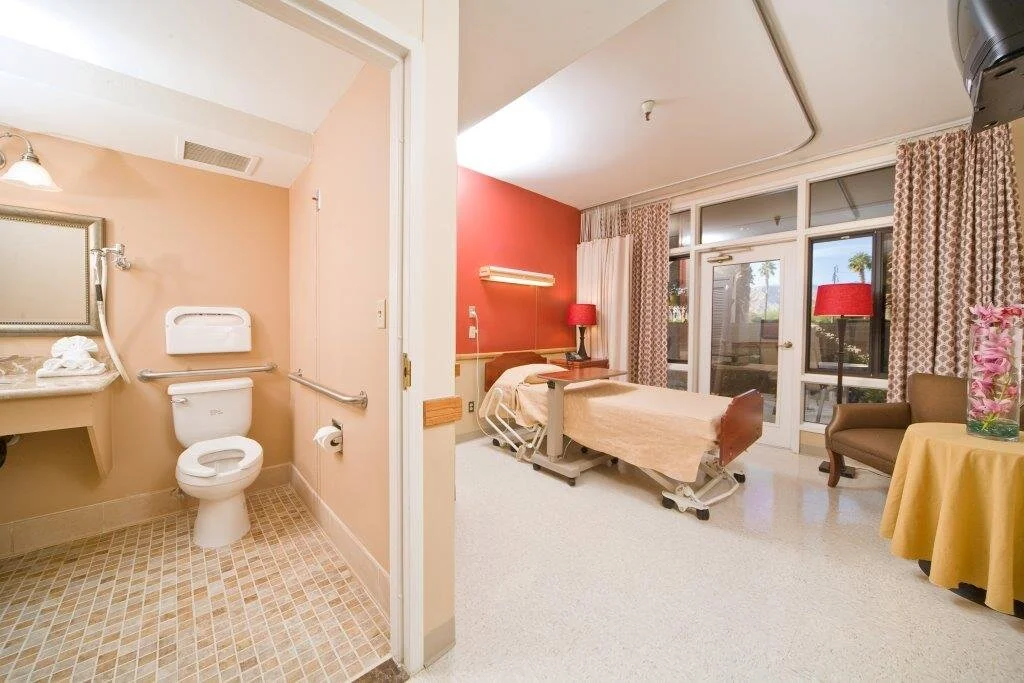
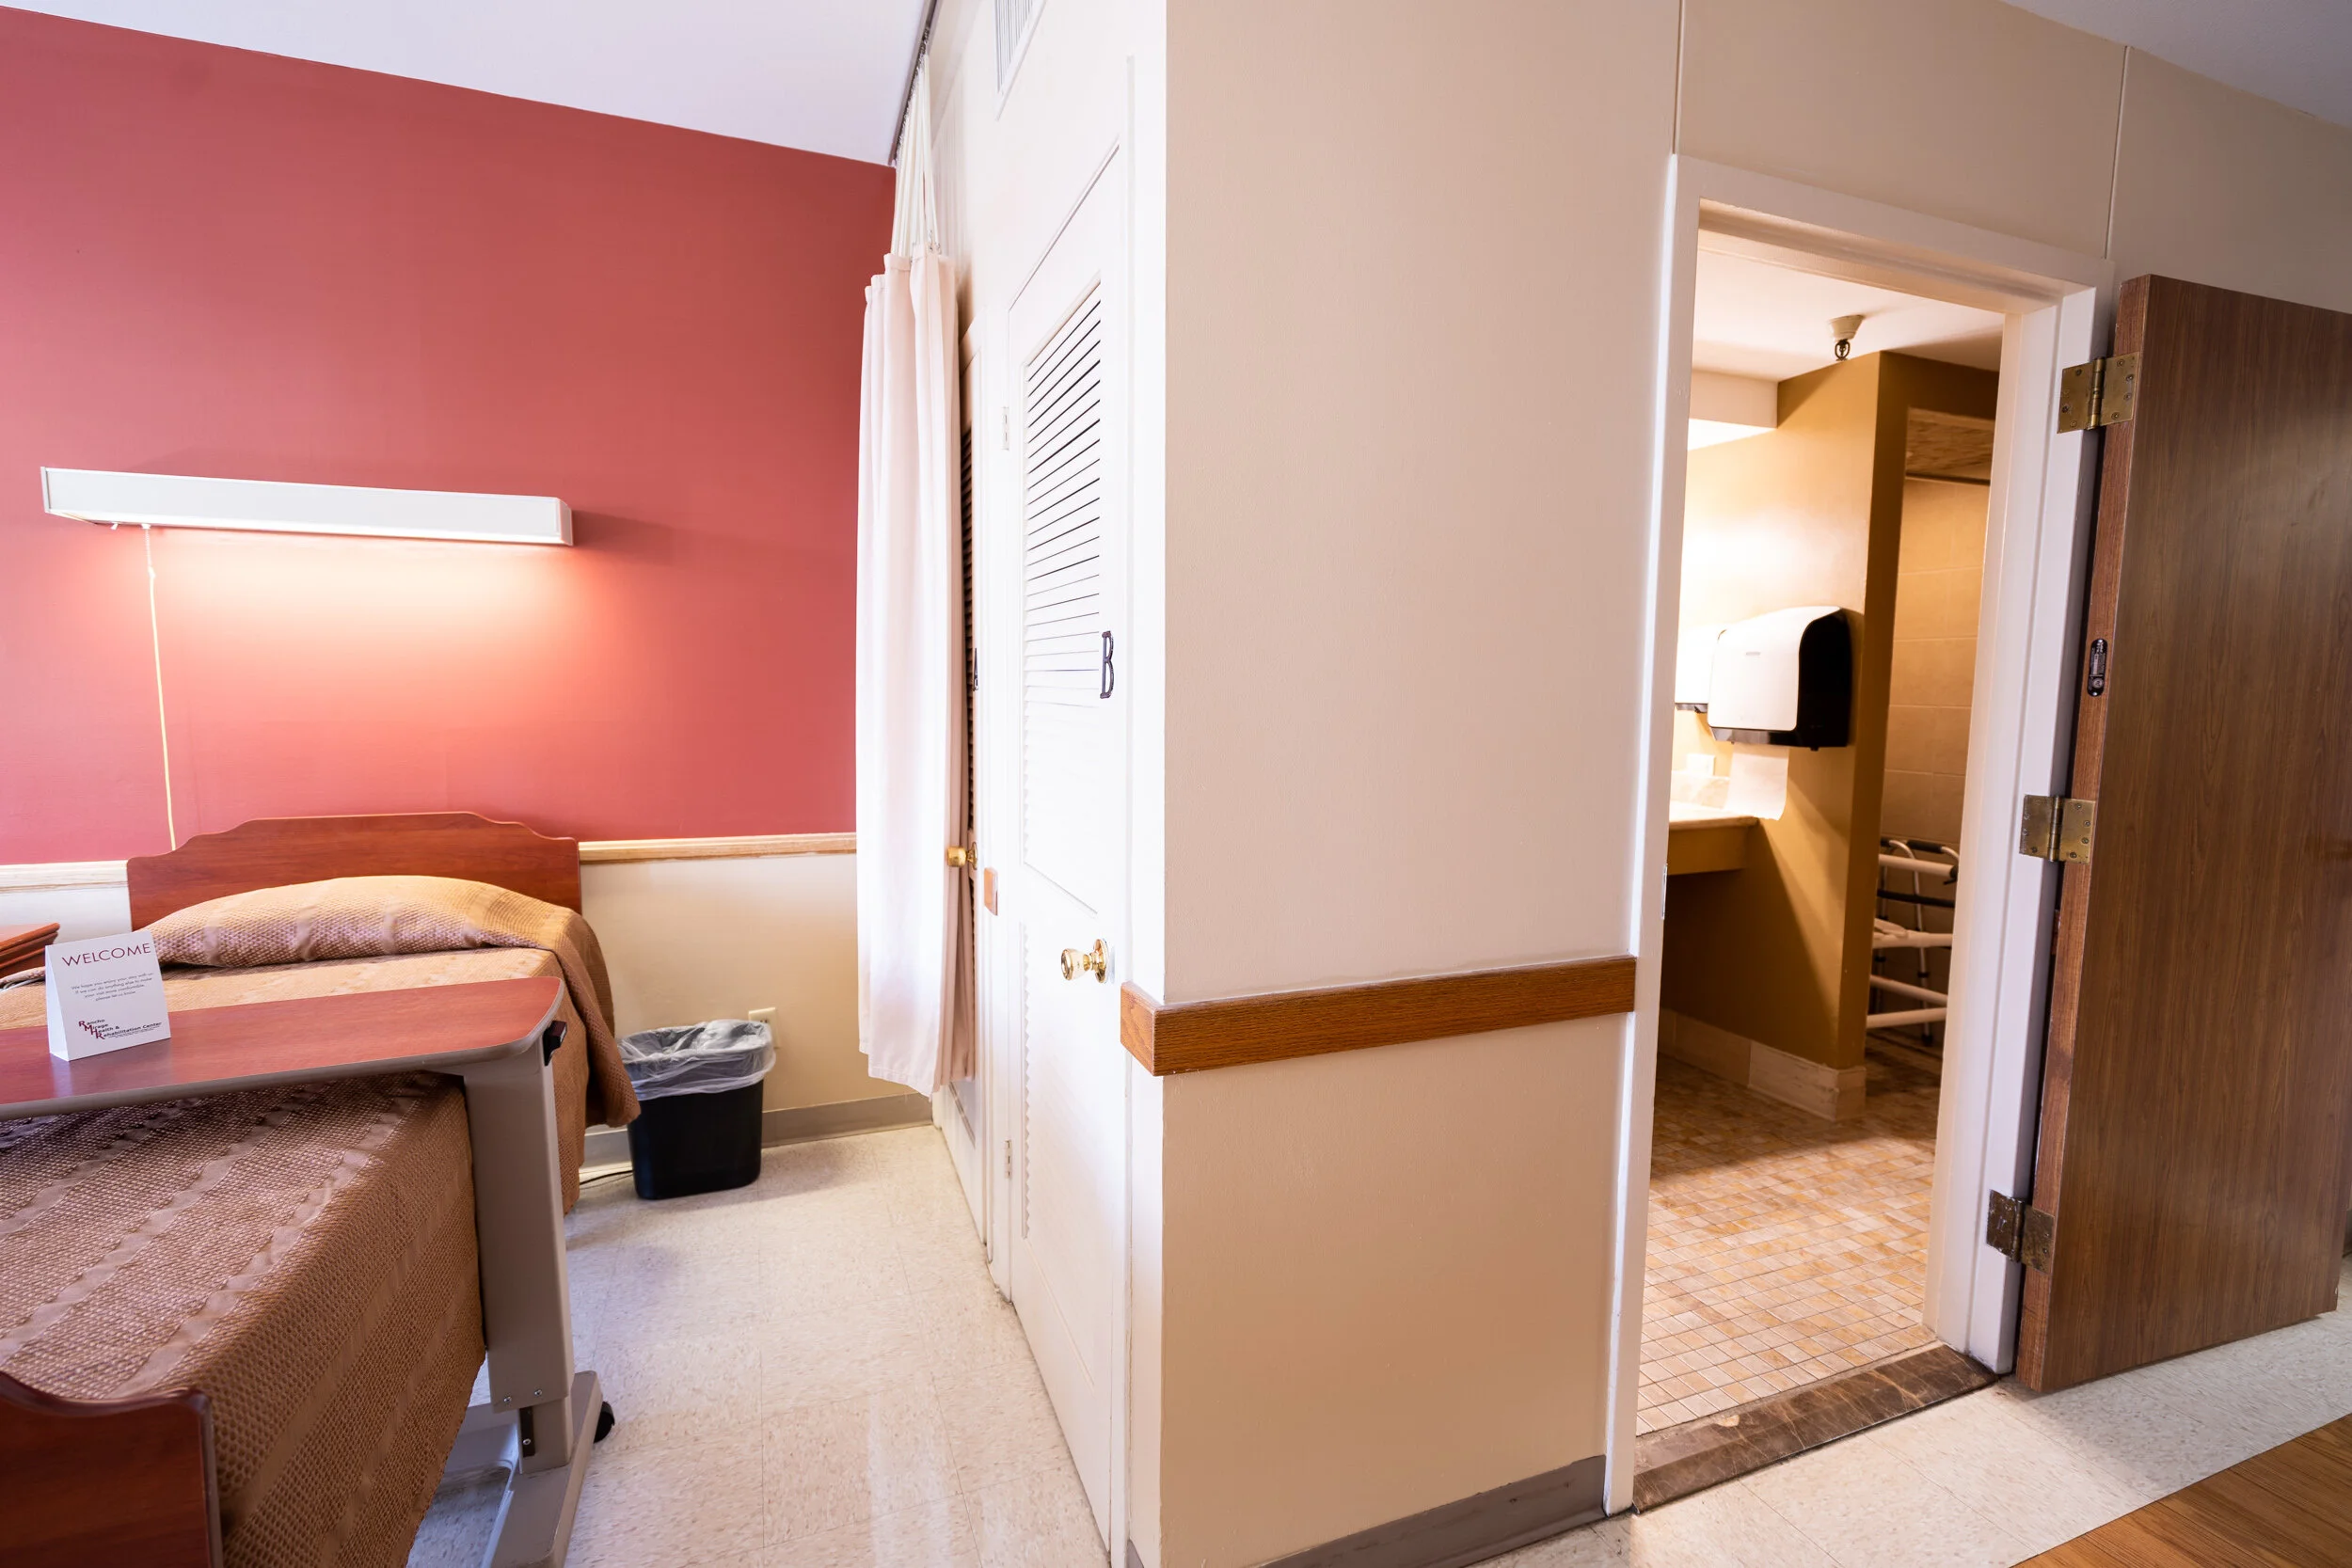
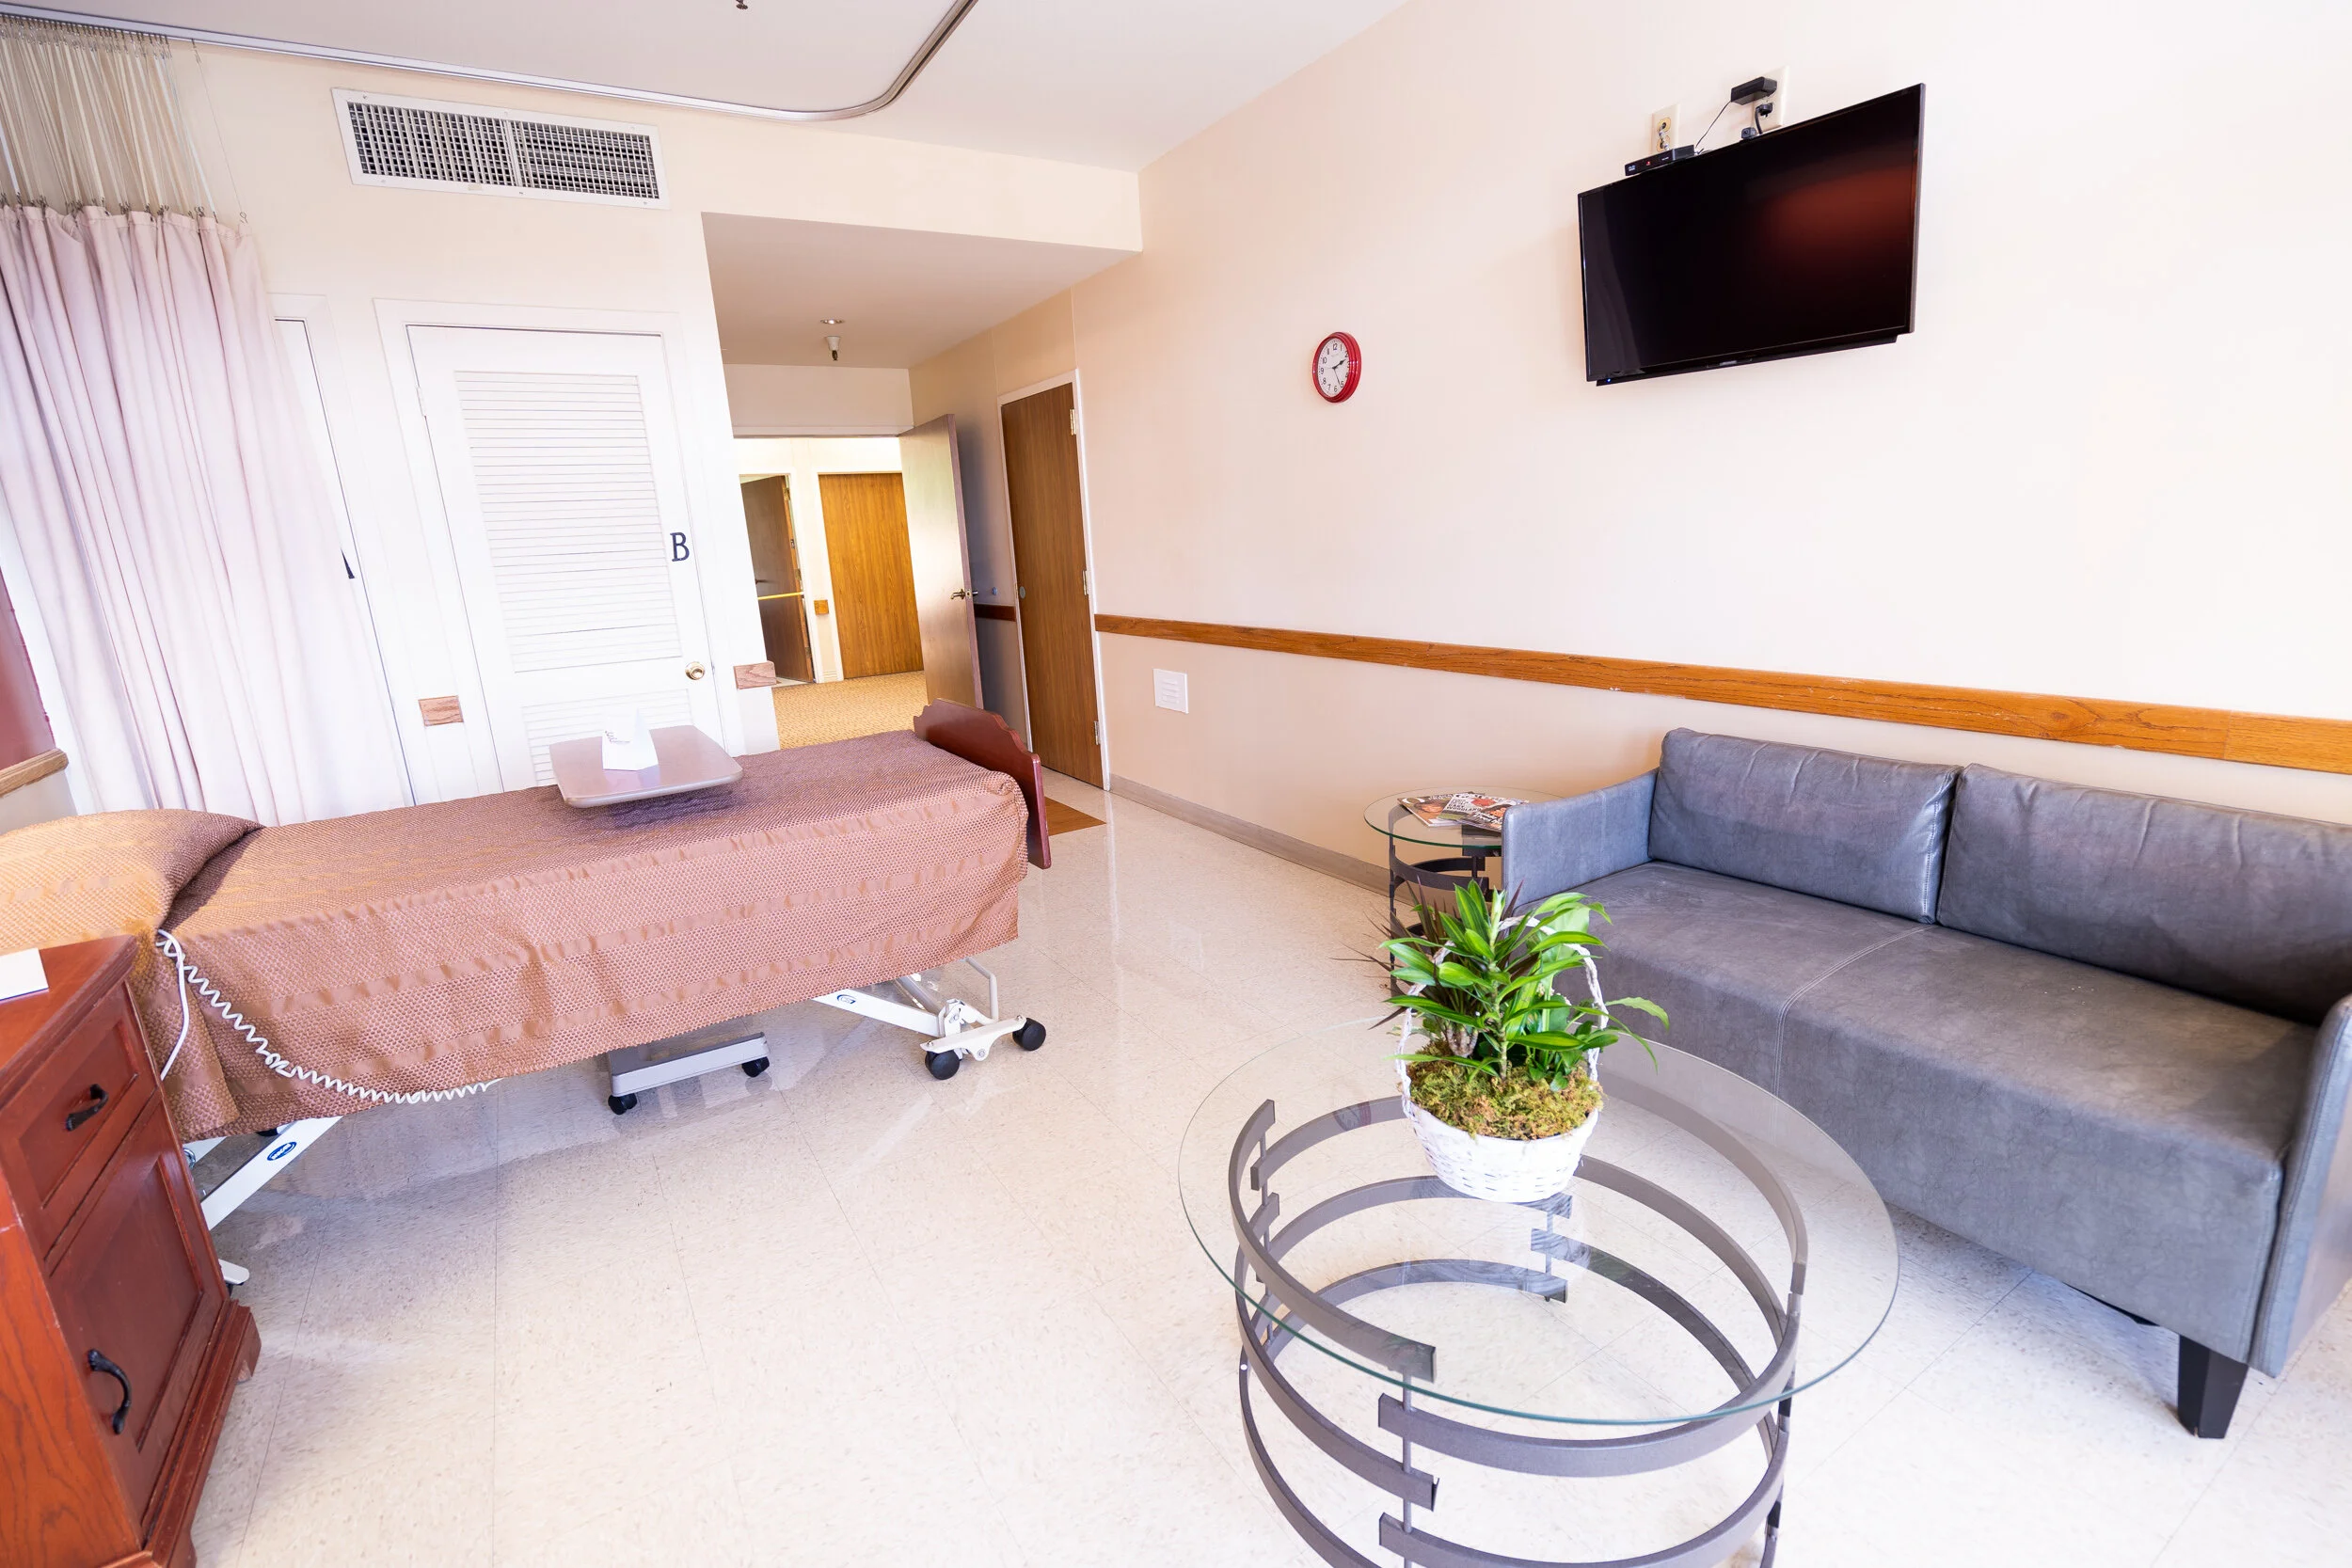
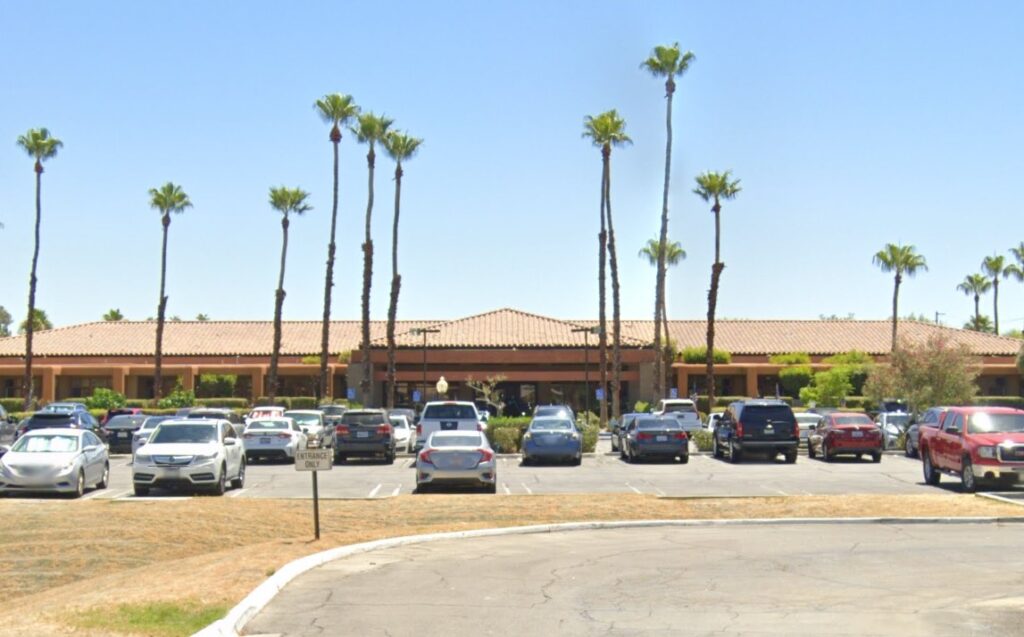
Based in the peaceful area of Rancho Mirage, CA, Rancho Mirage Health and Rehabilitation Center is a distinct senior living community that offers skilled nursing and rehabilitation services. With a team of reliable care professionals available to offer services like wound care, cardiac care, IV therapy, and hospice care, residents are guaranteed to live their lives in comfort and peace of mind. Offering 53 private rooms, the community fosters an intimate environment for an optimal healing and recovery experience.

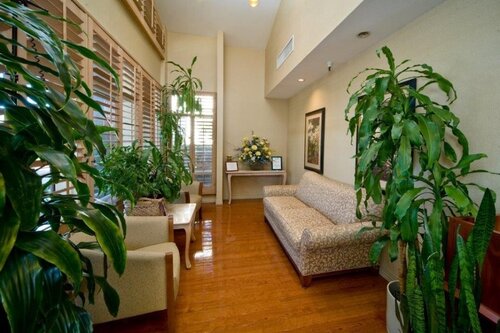
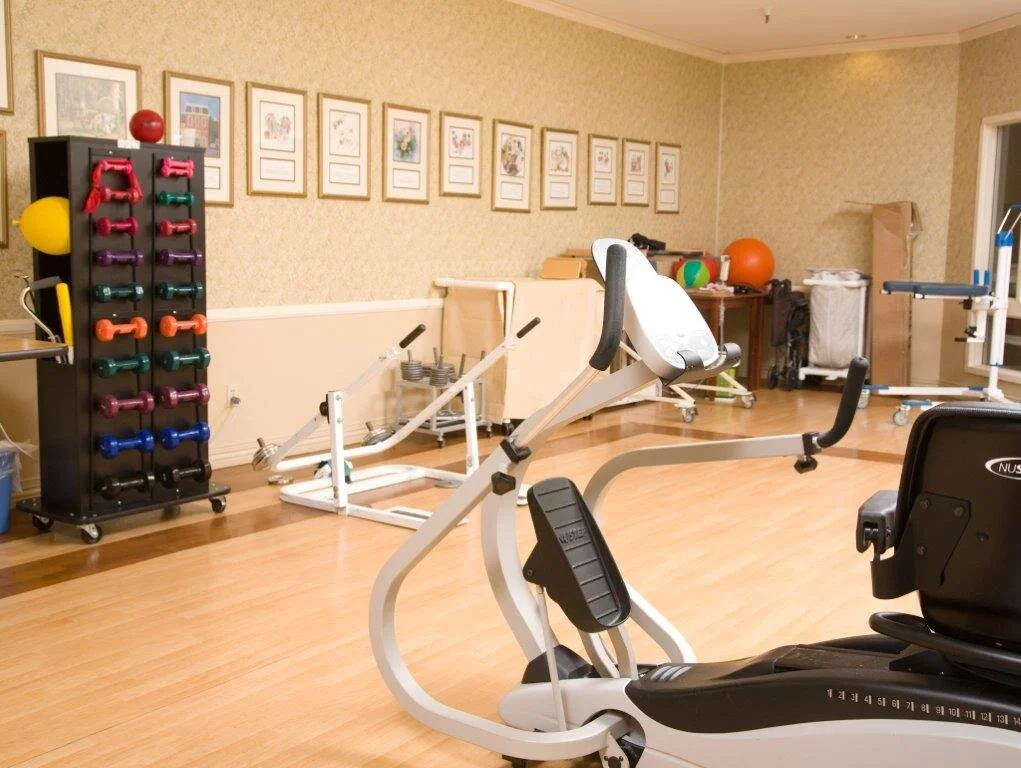
Ensuring its residents are occupied and happy during their recovery process and stay within the community also offers various amenities for residents to enjoy. Residents here are guaranteed to preserve their optimal functionality with access to excellent physical, occupational and speech therapies. At Rancho Mirage Health and Rehabilitation Center, residents are guaranteed to enjoy a comfortable and relaxing recovery journey.

Quality ratings

Measured by Centers for Medicare & Medicaid Services (CMS)

Overall rating Info The Overall CMS Rating combines results from health inspections, staffing levels and quality measures. Health inspections carry the most weight. Staffing and quality scores can increase or decrease the final rating based on performance compared to state and national standards.
3/5
California average: 3.6/5
Health Inspection Info Based on the results of the facility's three most recent standard inspections and any complaint investigations. CMS reviews the number, scope, and severity of deficiencies, with more recent findings weighted more heavily.
3/5
California average: 3.2/5
Staffing Info Measures average nursing staff hours per resident per day, including Registered Nurses (RNs) and total nursing staff. Ratings are adjusted based on the level of care residents require and are compared to state and national benchmarks.
3/5
California average: 3.5/5
Quality Measures Info Based on clinical and physical health indicators reported to CMS, such as hospital readmissions, falls, pressure ulcers, and improvements in mobility. These measures reflect how well residents' health needs are being managed.
4/5
California average: 4.3/5

Nursing care per resident

Info This shows how many total hours of nursing staff time are available per resident each day. Higher numbers usually mean more staff support.
4h 12m per day

This home provides 4% less nursing time per resident than the California average.

California average: 4h 23m per day

Capacity and availability

This home usually has limited availability

Occupancy is moderate, suggesting balanced demand.

Similar demand to the California average
Occupancy rate 88.7%
Residents per day (avg) 96
Occupancy rate
88.7%
Residents per day (avg)
96

Who this home usually serves

TYPE OF STAY

Mix of rehab and long-term care

This home supports both short-term rehab and long-term care, with residents staying for a wide range of durations.

Breakdown by payment type

Medicare

43% of new residents, usually for short-term rehab.

Typical stay 24 days

Private pay

56% of new residents, often for short stays.

Typical stay 29 days

Medicaid

1% of new residents, often for long-term daily care.

Typical stay 7 - 8 years

Finances and operations

Privately-owned community
Home revenue
$15.9M
Profit
$346.9K
Privately-owned community
Home revenue
$15,859,506.00
Profit
$346,914.00
Payroll costs Info The portion of the home's budget spent on staff, including nurses, caregivers, and other employees who support care and operations.
$6.9M
43.4% of revenue
Other operating costs Info All remaining costs needed to run the home, such as food, utilities, building maintenance, supplies and administrative expenses.
$8.6M
Total costs $15.5M
Walk Score
Walk Score: 38 / 100
Somewhat walkable. A few nearby services may be reachable on foot, but most trips require transportation.
BBB Rating
BBB Rating: A+ (Not Accredited)
An independent rating from the Better Business Bureau based on factors such as complaint history, transparency, and business practices.
How BBB ratings work

About this community

Additional licensing details

CMS Certification Number: 555247

Care Services

Nursing Services
Rehabilitation Services
Respite Care
24-Hour Staffing

Amenities & Lifestyle

Large eight-hole putting green
relaxing garden patios and views

Programs & Activities

Specific Programs
Cardiac Care, Wound Care, Hospice, IV Therapy, Physical, Occupational and Speech Therapies, Post CVA/Stroke Aftercare and Recovery, Respite Care, Case Management Services
Operating Hours
Daily 8:00am–4:00pm

What does this home offer?

Accepts Medicaid icon

Accept Medicaid: Yes, Accept

Total residents icon

Total Residents: 99 Residents

Housing options icon

Housing Options: Private / Semi-Private Rooms

Building type icon
Building type icon

Building Type: Single-story

Health Programs icon

Health Programs

Types of Care at Rancho Mirage Health and Rehabilitation Center

Nursing Home
Contact Rancho Mirage Health and Rehabilitation Center

Inspection History

In California, the Department of Social Services (for assisted living facilities) and the Department of Public Health (for nursing homes) conduct inspections to ensure resident safety and regulatory compliance.

Health Inspection History

Inspections
Total health inspections 14

California average 12.5


Last Health inspection on Aug 2025

Total health citations 46

California average 50.2

Citations per inspection
3.29

California average 4.65


Health citations are formal notices following inspections when they fail to comply with safety and care standards.

23 of 46 citations resulted from standard inspections; 15 of 46 resulted from complaint investigations; and 8 of 46 came from combined inspections (standard and complaint).

Breakdown of citation severity (last 3 years)
Critical Health citations More info 0
100% better than California average

California average: 0.4


Serious Health citations More info 0
100% better than California average

California average: 1

0 critical citations More info California average: 0.4

0 serious citations More info California average: 1

46 moderate citations More info California average: 47.2

0 minor citations More info California average: 1.5
Citations history (last 3 years)
Resident Rights moderate citation Info Issues related to resident's rights, including dignity, privacy, and the ability to make decisions about their care. Aug 11, 2025
Corrected

Quality of Care moderate citation Info Issues related to how well residents receive appropriate treatment and support for their medical and daily care needs. Feb 25, 2025
Corrected

Infection Control moderate citation Info Issues related to preventing and controlling infections, including hygiene practices and safety protocols. Feb 06, 2025
Corrected

Nutrition moderate citation Info Issues related to food quality, meal service, and resident's nutritional needs. Feb 06, 2025
Corrected

Compare Nursing Homes around Rancho Mirage The information below is reported by the California Department of Social Services and Department of Public Health.

1 facility compared · CMS & CA Dept. of Health data · Updated Mar 2026

Rancho Mirage Health and Rehabilitation Center
AL

Assisted Living A licensed, long-term care setting for seniors or individuals with disabilities who need help with daily activities — like bathing, dressing, and medication management — but not 24-hour skilled nursing. Offers housing, meals, and around-the-clock support while aiming to maximize resident independence.

IL

Independent Living Lifestyle-focused communities for older adults offering dining, activities, and transportation with minimal personal care. Best for active, independent seniors who want community without medical support.

MC

Memory Care Secured, specialized care for people living with Alzheimer's or dementia. Staff trained in cognitive impairment, with higher staff-to-resident ratios and an environment designed to reduce confusion and wandering risk.

NH

Nursing Home Licensed facility providing 24/7 skilled nursing care for residents with complex, ongoing medical needs. Staffed by RNs, LPNs, and CNAs. Inspected and star-rated annually by CMS. Accepts Medicare (short-term rehab) and Medicaid (long-term care).

Rancho Mirage
99
88.7%
+5%
4.19
-42%
-1%
0
46
0
96
A+
38
$15,6M
$6,9M
44.1%
555247
Private / Semi-Private Rooms

Places of interest near Rancho Mirage Health and Rehabilitation Center

Address 2.0 miles from city center

Address 39950 Vista Del Sol, Rancho Mirage, CA 92270

Calculate Travel Distance to Rancho Mirage Health and Rehabilitation Center

Add your location

Address

Staffing Data (Q2 2025)

This data corresponds to Q2 2025 and is based on CMS Payroll-Based Journal.

Total staff 141
Employees 131
Contractors 10
Staff to resident ratio 1.53:1
1532509% better than California average

California average ratio: 0.00:1

Avg staff/day 63
Average shift 7.3 hours
5% worse than California average

California average: 7.7 hours

Total staff hours (quarter) 42,052
Nursing staff breakdown
Registered Nurse

Manages medical care and health needs.

Total count 7
Average shift length Info Average shift length. Calculated as total hours divided by days worked and average staff per day. 7.5 hours

No contractors work on this role.

Licensed Practical Nurse

Assists with medical care and medications.

Total count 32
Average shift length Info Average shift length. Calculated as total hours divided by days worked and average staff per day. 7.9 hours

No contractors work on this role.

Certified Nursing Assistant

Helps with daily care and mobility.

Total count 66
Average shift length Info Average shift length. Calculated as total hours divided by days worked and average staff per day. 7.3 hours

No contractors work on this role.

Contractor staffing

Total hours from contractors

1.2%

506 contractor hours this quarter

Other Physician: 4 Occupational Therapy Aide: 2 Medical Director: 2 Physical Therapy Assistant: 1 Occupational Therapy Assistant: 1
Staff by category
Certified Nursing Assistant6606620,52091100%7.3
Licensed Practical Nurse3203211,26591100%7.9
Registered Nurse7072,20991100%7.5
Speech Language Pathologist5051,3539099%6.3
RN Director of Nursing2029926470%8
Physical Therapy Aide2029706976%7.8
Dental Services Staff2029246571%7.8
Other Dietary Services Staff2027149099%7.9
Nurse Practitioner1015126470%8
Administrator1014806066%8
Dietitian1014686167%7.7
Respiratory Therapy Technician4044508796%4.4
Physical Therapy Assistant5164377684%4.1
Qualified Social Worker1013806268%6.1
Occupational Therapy Aide0222585459%4
Occupational Therapy Assistant0114867%8
Medical Director022372224%1.5
Other Physician044362224%1.4
66 Certified Nursing Assistant
% of Days 100%
32 Licensed Practical Nurse
% of Days 100%
7 Registered Nurse
% of Days 100%
5 Speech Language Pathologist
% of Days 99%
2 RN Director of Nursing
% of Days 70%
2 Physical Therapy Aide
% of Days 76%
2 Dental Services Staff
% of Days 71%
2 Other Dietary Services Staff
% of Days 99%
1 Nurse Practitioner
% of Days 70%
1 Administrator
% of Days 66%
1 Dietitian
% of Days 67%
4 Respiratory Therapy Technician
% of Days 96%
6 Physical Therapy Assistant
% of Days 84%
1 Qualified Social Worker
% of Days 68%
2 Occupational Therapy Aide
% of Days 59%
1 Occupational Therapy Assistant
% of Days 7%
2 Medical Director
% of Days 24%
4 Other Physician
% of Days 24%

Facility Characteristics

Source: CMS Long-Term Care Facility Characteristics (Data as of Jan 2026)

Total census
92 residents
Residents by payment source
Medicare
15 residents (16.3%)
Medicaid
47 residents (51.1%)
Private pay or other
30 residents (32.6%)
Programs & Services
Residents' Group

Residents meet regularly to discuss policies, care quality, and activities

Active Resident Council

Organized group of residents that meets regularly to discuss facility policies, quality of life, and activities.

Quality of care over time

These measures show how residents usually do over time at this home, based on health outcomes and preventive care.

High-risk clinical events score Info A composite score based on pressure ulcers, falls with injury, weight loss, walking ability decline, and activities of daily living decline. 9.0
36% worse than California average

California average: 6.6

Functional decline score Info A composite score based on activities of daily living decline, walking ability decline, and incontinence. 18.6
65% worse than California average

California average: 11.3

Long-stay resident measures
Need for Help with Daily Activities Increased Info Percent of long-stay residents whose need for help with daily activities has increased 14.9%
35% worse than California average

California average: 11.1%

Walking Ability Worsened Info Percent of long-stay residents whose ability to move independently worsened 21.7%
81% worse than California average

California average: 12.0%

Low Risk Residents with Bowel/Bladder Incontinence Info Percent of low risk long-stay residents who lose control of their bowels or bladder 19.2%
70% worse than California average

California average: 11.3%

Falls with Major Injury Info Percent of long-stay residents experiencing one or more falls with major injury 2.7%
61% worse than California average

California average: 1.7%

High Risk Residents with Pressure Ulcers Info Percent of long-stay high risk residents with pressure ulcers 1.2%
77% better than California average

California average: 5.0%

Urinary Tract Infection Info Percent of long-stay residents with a urinary tract infection 0.0%
100% better than California average

California average: 1.2%

Lost Too Much Weight Info Percent of long-stay residents who lose too much weight 4.7%
11% worse than California average

California average: 4.2%

Depressive Symptoms Info Percent of long-stay residents who have depressive symptoms 4.4%
35% better than California average

California average: 6.7%

Antipsychotic Use Info Percent of long-stay residents who received an antipsychotic medication 12.1%
20% worse than California average

California average: 10.1%

Pneumococcal Vaccine Info Percent of long-stay residents assessed and appropriately given the pneumococcal vaccine 100.0%
In line with California average

California average: 98.5%

Influenza Vaccine Info Percent of long-stay residents assessed and appropriately given the seasonal influenza vaccine 94.7%
In line with California average

California average: 98.2%

Short-stay resident measures
Pneumococcal Vaccine Info Percent of short-stay residents assessed and appropriately given the pneumococcal vaccine 99.8%
6% better than California average

California average: 94.0%

Antipsychotic medication increase Info Percent of short-stay residents who newly received an antipsychotic medication 0.4%
72% better than California average

California average: 1.5%

Influenza Vaccine Info Percent of short-stay residents assessed and appropriately given the seasonal influenza vaccine 93.5%
In line with California average

California average: 93.2%

Guides for Better Senior Living

Care Cost Calculator: See Prices in Your Area

Nursing Home Data Explorer

Don’t Wait Too Long: 7 Red Flag Signs Your Parent Needs Assisted Living Now

The True Cost of Assisted Living in 2025 – And How Families Are Paying For It

Understanding Senior Living Costs: Pricing Models, Discounts & Financial Assistance

Financial Aid for California Seniors

Get financial aid guidance

Multipurpose Senior Services Program

MSSP (Medi-Cal Waiver)

Age 65+, California resident, Medi-Cal eligible, nursing home risk.

~$2,829/month (300% FBR, individual).

$2,000 (individual), $3,000 (couple).

County-managed; waitlists possible.

In-Home Supportive Services (IHSS)

California IHSS

Age 65+, California resident, Medicaid-eligible or low-income.

~$1,732/month (individual, Medi-Cal threshold).

$2,000 (individual).

Can hire family as caregivers.

Multipurpose Senior Services Program (MSSP)

CA MSSP

Age 65+, California resident, Medi-Cal-eligible, nursing home-eligible but community-capable.

~$2,829/month (300% FBR, individual).

$2,000 (individual).

Available in 38 counties; waitlists common.

Property Tax Postponement Program (PTP)

CA PTP

Age 62+, California resident, own and live in home, 40% equity.

~$51,500/year (household, adjusted annually).

Equity-based; no strict asset cap.

Deferred taxes accrue interest (5% as of 2024); repaid upon sale/death.

Assisted Living Waiver (ALW)

CA ALW

Age 65+ or disabled, California resident, Medi-Cal-eligible, nursing home-eligible.

~$2,829/month (300% FBR, individual).

$2,000 (individual).

Available in 15 counties (e.g., LA, Sacramento); waitlists common.

California CARES Program

CA CARES

Caregivers of California residents 60+ needing help with 3+ daily activities; no caregiver age limit.

No strict limit; cost-sharing above ~$2,500/month threshold.

Not applicable; need-based.

High demand in urban areas; complements IHSS respite.

Low-Income Home Energy Assistance Program (LIHEAP)

CA LIHEAP

Age 60+ priority, California resident, low-income, utility/heating need.

~$2,510/month (200% of poverty level, individual).

Not applicable; income-focused.

High demand in inland/coastal extremes; weatherization capped at $5,000/home.