Rancho Mirage Health and Rehabilitation Center

Nursing Home in Rancho Mirage

CMS overall rating Info The Overall CMS Rating is scored from 1 to 5 stars and combines results from health inspections, staffing levels, and quality measures. Health inspections carry the most weight. Staffing and quality scores can increase or decrease the final rating based on performance compared to state and national standards.

Overview of Rancho Mirage Health and Rehabilitation Center

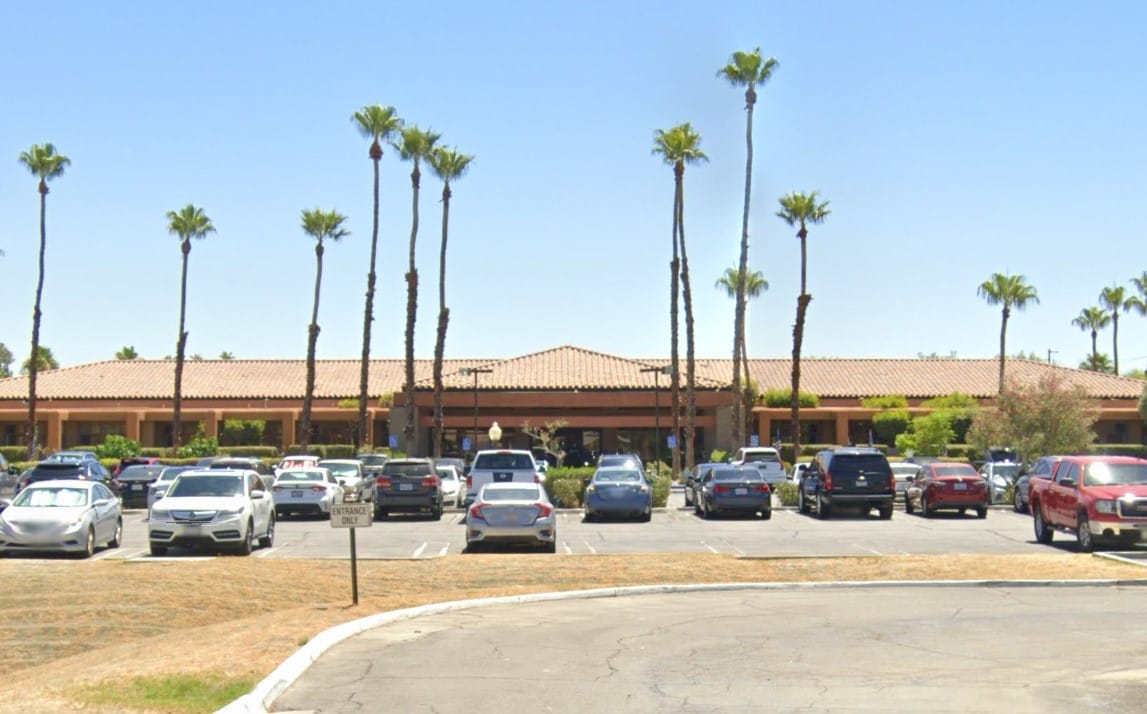
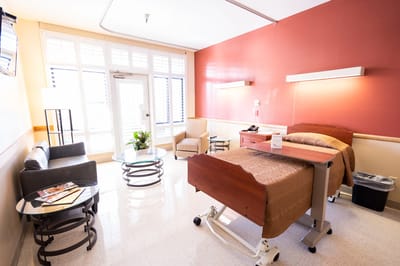
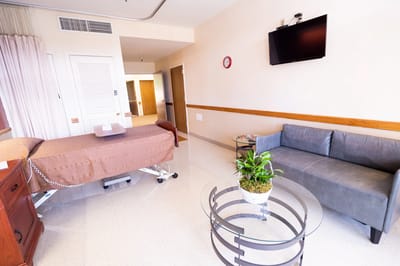
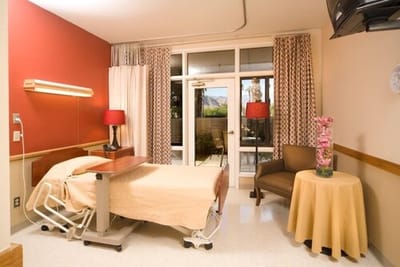
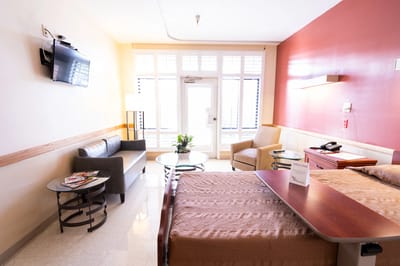
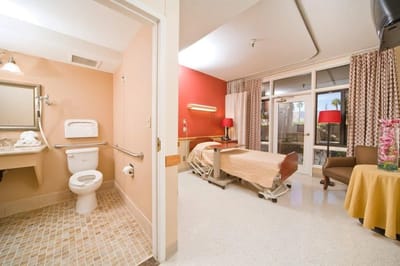
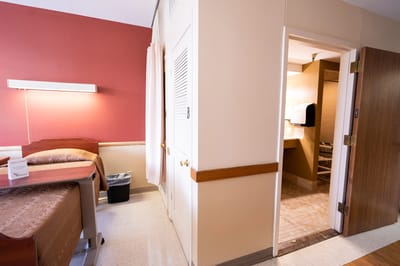
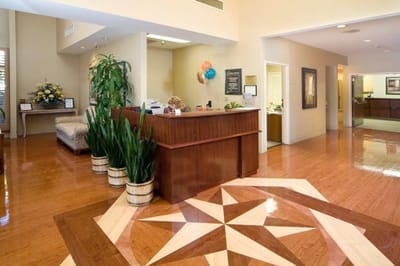
Based in the peaceful area of Rancho Mirage, CA, Rancho Mirage Health and Rehabilitation Center is a distinct senior living community that offers skilled nursing and rehabilitation services. With a team of reliable care professionals available to offer services like wound care, cardiac care, IV therapy, and hospice care, residents are guaranteed to live their lives in comfort and peace of mind. Offering 53 private rooms, the community fosters an intimate environment for an optimal healing and recovery experience.

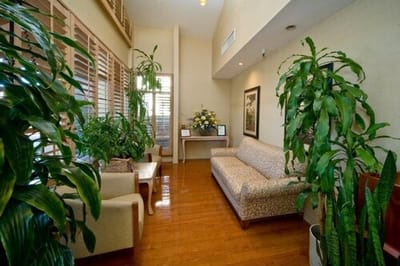
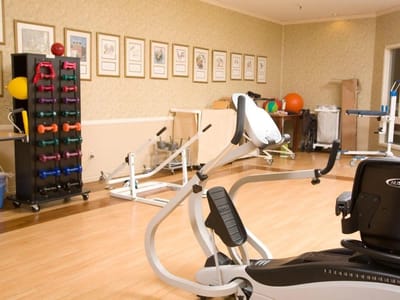
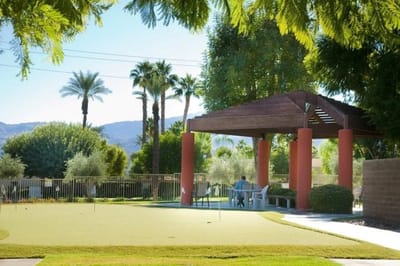
Ensuring its residents are occupied and happy during their recovery process and stay within the community also offers various amenities for residents to enjoy. Residents here are guaranteed to preserve their optimal functionality with access to excellent physical, occupational and speech therapies. At Rancho Mirage Health and Rehabilitation Center, residents are guaranteed to enjoy a comfortable and relaxing recovery journey.

Quality ratings

Measured by Centers for Medicare & Medicaid Services (CMS)

Overall rating Info The Overall CMS Rating combines results from health inspections, staffing levels and quality measures. Health inspections carry the most weight. Staffing and quality scores can increase or decrease the final rating based on performance compared to state and national standards.
3/5 ▼ 0.6 California average: 3.6/5
Health Inspection Info Based on the results of the facility's three most recent standard inspections and any complaint investigations. CMS reviews the number, scope, and severity of deficiencies, with more recent findings weighted more heavily.
3/5 ▼ 0.2 California average: 3.2/5
Staffing Info Measures average nursing staff hours per resident per day, including Registered Nurses (RNs) and total nursing staff. Ratings are adjusted based on the level of care residents require and are compared to state and national benchmarks.
3/5 ▼ 0.5 California average: 3.5/5
Quality Measures Info Based on clinical and physical health indicators reported to CMS, such as hospital readmissions, falls, pressure ulcers, and improvements in mobility. These measures reflect how well residents' health needs are being managed.
4/5 ▼ 0.3 California average: 4.3/5

Staffing hours breakdown

Info Daily nursing hours per resident by staff type, reported to CMS. Higher is generally better — compare this facility to state and national averages to see where staffing stands.

Hours per resident per day — compared to California state averages

Total nursing care / resident Info This home is ranked 123rd out of 294 homes in California.

Total adjusted nursing hours per resident per day, combining RN, LPN, and aide time. CMS adjusts this for case-mix so facilities can be fairly compared.
4h 12m per day
Rank #123 / 294Nurse hours — state benchmarkedThis home is ranked 123rd out of 294 homes in California.Shows adjusted nurse hours per resident per day benchmarked to the California average, with a ranking across 294 California SNFs. More hours mean more direct care. The national average is about 3.5 hrs; below 3.0 is a red flag.
This facility California avg (4h 23m per day)
vs California avg
-4%

5 of 6 metrics below state avg

Standout metric LPN / LVN is +19% above state avg
Staff typeHours / dayvs state avg
Registered Nurse (RN) Info RNs hold the highest nursing license and can assess residents, interpret test results, and direct care plans. More RN hours per day often signals stronger clinical oversight and faster response to health changes. 19m per day ▼ 51% State avg: 39m per day · National avg: 41m per day
LPN / LVN Info Licensed Practical Nurses (LPNs) or Licensed Vocational Nurses (LVNs) deliver routine hands-on care — medication administration, wound dressing, and monitoring vital signs. They work under RN supervision and make up a large share of daily bedside care. 1h 27m per day ▲ 19% State avg: 1h 13m per day · National avg: 52m per day
Nurse Aide Info Certified Nurse Aides (CNAs) provide the most direct day-to-day assistance: bathing, dressing, feeding, and mobility. Nurse aide hours are typically the largest staffing category and directly affect residents' quality of life. 2h 24m per day ▼ 9% State avg: 2h 39m per day · National avg: 2h 21m per day
Total Nursing (Weekend) Info Combined nursing hours (RN + LPN + Nurse Aide) per resident per day on weekends. Staffing often drops on weekends — this figure reveals whether the facility maintains adequate coverage outside of weekday hours. 3h 46m per day ▼ 8% State avg: 4h 5m per day · National avg: 3h 26m per day
Physical Therapist Info Hours per resident per day provided by licensed Physical Therapists (PTs) or PT Assistants. PT services help residents recover mobility after injury or illness and are especially important for post-acute (short-stay) rehabilitation. 3m per day ▼ 40% State avg: 5m per day · National avg: 4m per day
RN (Weekend) Info Registered nurse hours specifically on weekends. Facilities sometimes reduce RN presence on Saturdays and Sundays — a low weekend RN figure compared to weekday hours can indicate reduced clinical oversight when most administrative staff are absent. 19m per day ▼ 37% State avg: 30m per day · National avg: 29m per day

Capacity and availability

This home usually has limited availability

Occupancy between 85% and 95% suggests balanced demand.

Higher occupancy than the California average: 84.7%
Occupancy rate 88.7% Rank #120 / 301Occupancy rate — state benchmarkedThis home is ranked 120th out of 301 homes in California.Shows this facility's occupancy rate versus the California average, with its statewide rank out of 301. Higher occupancy signals strong local demand and financial stability.
Avg. Length of Stay 54 days
Occupancy rate
88.7% Rank #120 / 301Occupancy rate — state benchmarkedThis home is ranked 120th out of 301 homes in California.Shows this facility's occupancy rate versus the California average, with its statewide rank out of 301. Higher occupancy signals strong local demand and financial stability.
Avg. Length of Stay
54 days

Who this home usually serves

TYPE OF STAY

Mix of rehab and long-term care

This home supports both short-term rehab and long-term care, with residents staying for a wide range of durations.

Breakdown by payment type

Medicare

43% of new residents, usually for short-term rehab.

Typical stay 24 days

Private pay

56% of new residents, often for short stays.

Typical stay 29 days

Medicaid

1% of new residents, often for long-term daily care.

Typical stay 7 - 8 years

Finances and operations

Privately-owned community
Home revenue
$15.9M
Profit
$346.9K
Privately-owned community
Home revenue
$15.9M Rank #139 / 299Revenue — state benchmarkedThis home is ranked 139th out of 299 homes in California.Shows this facility's annual revenue compared to the California SNF average. Higher revenue generally means more resources for staffing and capital — read alongside Payroll %.
Profit
$346.9K
Payroll costs Info The portion of the home's budget spent on staff, including nurses, caregivers, and other employees who support care and operations. Rank #145 / 299Payroll — state benchmarkedThis home is ranked 145th out of 299 homes in California.Shows total annual staff payroll benchmarked to the California average. Higher payroll investment relative to peers often signals better staffing and less reliance on cheaper contract labor.
$6.9M
43.4% of revenue Rank #131 / 299Payroll % — state benchmarkedThis home is ranked 131st out of 299 homes in California.Shows payroll as a percentage of revenue versus the California average. Well-run SNFs often land around 55–65%. Below 25% may signal understaffing or heavy agency use — read with Staffing ratings.
Other operating costs Info All remaining costs needed to run the home, such as food, utilities, building maintenance, supplies and administrative expenses.
$8.6M
Total costs $15.5M
Walk Score
Walk Score: 38 / 100 Rank #210 / 243Walk Score — state benchmarkedThis home is ranked 210th out of 243 homes in California.Shows how walkable this facility's neighborhood is compared to the average Walk Score across California SNFs. Higher scores benefit residents, families, and staff.
Somewhat walkable. A few nearby services may be reachable on foot, but most trips require transportation.
BBB Rating
BBB Rating: A+ (Not Accredited)
An independent rating from the Better Business Bureau based on factors such as complaint history, transparency, and business practices.
How BBB ratings work

About this community

License Details

CMS Certification Number555247

Therapy & Rehabilitation

2 services
Rehabilitation Services
Respite Care

Staffing & Medical

1 service
24-Hour Staffing

Amenities & Lifestyle

Large Eight-Hole Putting Green
Relaxing Garden Patios And Views
Specific ProgramsCardiac Care, Wound Care, Hospice, IV Therapy, Physical, Occupational and Speech Therapies, Post CVA/Stroke Aftercare and Recovery, Case Management Services
Operating HoursDaily 8:00am–4:00pm

What does this home offer?

Accepts Medicaid icon

Accept Medicaid: Yes, Accept

Total residents icon

Total Residents: 99 Residents

Housing options icon

Housing Options: Private / Semi-Private Rooms

Building type icon
Building type icon

Building Type: Single-story

Health Programs icon

Health Programs

Types of Care at Rancho Mirage Health and Rehabilitation Center

Nursing Home

Contact Rancho Mirage Health and Rehabilitation Center

Inspection History

In California, the Department of Social Services (for assisted living facilities) and the Department of Public Health (for nursing homes) conduct inspections to ensure resident safety and regulatory compliance.

12 visits Info Inspections are mandatory, regular evaluations conducted by state health departments or regulatory agencies. They ensure the community provides safe, compliant care, covering areas like resident health, staff and management.

California average: 16 visits

Breakdown by visit type

0 total complaint visits

0 other visits Info Other visits include regulatory visits that are not routine inspections or complaint investigations, such as administrative check-ins, follow-up reviews, or licensing-related visits.

California average

13 total complaint visits

7 other visits

Latest inspection

Date August 11, 2025
Complaint Investigation

52 deficiencies

Deficiencies indicate regulatory issues. A higher number implies the facility had several areas requiring improvement.

California average: 8 deficiencies

Inspection Report Summary for Rancho Mirage Health and Rehabilitation Center

This facility’s inspection record is mixed, showing repeated deficiencies in resident care, medication management, and infection control without immediate jeopardy or fines. The most recent inspection on August 11, 2025, substantiated a complaint for failing to treat a resident with dignity during a nighttime room change, adding to prior findings of fall prevention lapses and medication errors. Inspections from late 2023 through 2025 documented several deficiencies including improper medication labeling, unsafe food handling, delayed abuse reporting, and failure to follow dietary and care plans.

Health Inspection History

Inspections
Total health inspections 14

California average 12.5


Last Health inspection on Aug 2025

Total health citations
46 Rank #187 / 298Health citations — state benchmarkedThis home is ranked 187th out of 298 homes in California.Shows this facility's total health deficiency citations benchmarked to the California state average, with a ranking across all 298 CA SNFs. Lower citation counts earn a better rank.

California average 50.2

Citations per inspection
3.29

California average 4.65


Health citations are formal notices following inspections when they fail to comply with safety and care standards.

23 of 46 citations resulted from standard inspections; 15 of 46 resulted from complaint investigations; and 8 of 46 came from combined inspections (standard and complaint).

Breakdown of citation severity (last 3 years)
Critical Health citations More info
0
100% better than California average

California average: 0.4


Serious Health citations More info 0
100% better than California average

California average: 1

0 critical citations More info California average: 0.4

0 serious citations More info California average: 1

46 moderate citations More info California average: 47.2

0 minor citations More info California average: 1.5
Citations history (last 3 years)
Resident Rights moderate citation Info Issues related to resident's rights, including dignity, privacy, and the ability to make decisions about their care. Aug 11, 2025
Corrected

Quality of Care moderate citation Info Issues related to how well residents receive appropriate treatment and support for their medical and daily care needs. Feb 25, 2025
Corrected

Infection Control moderate citation Info Issues related to preventing and controlling infections, including hygiene practices and safety protocols. Feb 06, 2025
Corrected

Nutrition moderate citation Info Issues related to food quality, meal service, and resident's nutritional needs. Feb 06, 2025
Corrected

Compare Nursing Homes around Rancho Mirage The information below is reported by the California Department of Social Services and Department of Public Health.

1 facility compared · CMS & CA Dept. of Health data · Updated Apr 2026

Filter by care type
Rancho Mirage Health and Rehabilitation Center
AL

Assisted Living A licensed, long-term care setting for seniors or individuals with disabilities who need help with daily activities — like bathing, dressing, and medication management — but not 24-hour skilled nursing. Offers housing, meals, and around-the-clock support while aiming to maximize resident independence.

IL

Independent Living Lifestyle-focused communities for older adults offering dining, activities, and transportation with minimal personal care. Best for active, independent seniors who want community without medical support.

MC

Memory Care Secured, specialized care for people living with Alzheimer's or dementia. Staff trained in cognitive impairment, with higher staff-to-resident ratios and an environment designed to reduce confusion and wandering risk.

NH

Nursing Home Licensed facility providing 24/7 skilled nursing care for residents with complex, ongoing medical needs. Staffed by RNs, LPNs, and CNAs. Inspected and star-rated annually by CMS. Accepts Medicare (short-term rehab) and Medicaid (long-term care).

Rancho Mirage (Vista Del Sol)99 88.7% +5%4.19 -42%-1%0463.3096A+ 38 -$15.9M$6.9M43.4%555247

Financial Assistance for
Nursing Home in California

Get Financial aid guidance

Multipurpose Senior Services Program

MSSP (Medi-Cal Waiver)

Age 65+
General California resident, Medi-Cal eligible, nursing home risk.
Income Limits (2025) ~$2,829/month 300% FBR, individual
Asset Limits $2,000 (individual), $3,000 (couple).
CA

County-managed; waitlists possible.

Benefits
In-home support (4-6 hours/day) Respite care (14 days/year) Meals (~$6/meal) Transportation (8 trips/month) Care management

In-Home Supportive Services (IHSS)

California IHSS

Age 65+
General California resident, Medicaid-eligible or low-income.
Income Limits ~$1,732/month individual, Medi-Cal threshold
Asset Limits $2,000 individual
CA

Can hire family as caregivers.

Benefits
Personal care (up to 283 hours/month) Homemaker services Respite (varies)

Multipurpose Senior Services Program (MSSP)

CA MSSP

Age 65+
General California resident, Medi-Cal-eligible, nursing home-eligible but community-capable.
Income Limits ~$2,829/month 300% FBR, individual
Asset Limits $2,000 individual
CA

Available in 38 counties; waitlists common.

Benefits
Case management Respite care (up to 10 days/year) Minor home mods (avg. $500) Adult day care (~$50/day)

Property Tax Postponement Program (PTP)

CA PTP

Age 62+
General California resident, own and live in home, 40% equity.
Income Limits (2025) ~$51,500/year household, adjusted annually
Asset Limits Equity-based; no strict asset cap.
CA

Deferred taxes accrue interest (5% as of 2024); repaid upon sale/death.

Benefits
Property tax deferral (avg. $1,000-$3,000/year, varies by county)

Assisted Living Waiver (ALW)

CA ALW

Age 65+ or disabled
General California resident, Medi-Cal-eligible, nursing home-eligible.
Income Limits ~$2,829/month 300% FBR, individual
Asset Limits $2,000 individual
CA

Available in 15 counties (e.g., LA, Sacramento); waitlists common.

Benefits
Personal care in ALFs (5-7 hours/day) Medication management Social services

California CARES Program

CA CARES

Age
General Caregivers of California residents 60+ needing help with 3+ daily activities; no caregiver age limit.
Income Limits No strict limit; cost-sharing above ~$2,500/month threshold.
Asset Limits Not applicable; need-based.
CA

High demand in urban areas; complements IHSS respite.

Benefits
Respite care (up to 10 days/year) Counseling (4-6 sessions/year) Training (2-3 workshops/year) Supplies (~$200/year)

Low-Income Home Energy Assistance Program (LIHEAP)

CA LIHEAP

Age 60+ priority
General California resident, low-income, utility/heating need.
Income Limits (2025) ~$2,510/month 200% of poverty level, individual
Asset Limits Not applicable; income-focused.
CA

High demand in inland/coastal extremes; weatherization capped at $5,000/home.

Benefits
Utility payments (avg. $500-$1,000/year) Weatherization (e.g., insulation, avg. $1,000-$3,000 savings)

Places of interest near Rancho Mirage Health and Rehabilitation Center

Address 2.0 miles from city center Info Estimated distance in miles from Rancho Mirage's city center to Rancho Mirage Health and Rehabilitation Center's address, calculated via Google Maps.

Calculate Travel Distance to Rancho Mirage Health and Rehabilitation Center

Add your location

Address

Staffing Data (Q2 2025)

This data corresponds to Q2 2025 and is based on CMS Payroll-Based Journal.

Total staff 141
Employees 131
Contractors 10
Staff to resident ratio 1.53:1
1532509% better than California average

California average ratio: 0.00:1

Avg staff/day 63
Average shift 7.3 hours
5% worse than California average

California average: 7.7 hours

Total staff hours (quarter) 42,052
Nursing staff breakdown
Registered Nurse

Manages medical care and health needs.

Total count 7
Average shift length Info Average shift length. Calculated as total hours divided by days worked and average staff per day. 7.5 hours

No contractors work on this role.

Licensed Practical Nurse

Assists with medical care and medications.

Total count 32
Average shift length Info Average shift length. Calculated as total hours divided by days worked and average staff per day. 7.9 hours

No contractors work on this role.

Certified Nursing Assistant

Helps with daily care and mobility.

Total count 66
Average shift length Info Average shift length. Calculated as total hours divided by days worked and average staff per day. 7.3 hours

No contractors work on this role.

Contractor staffing

Total hours from contractors

1.2%

506 contractor hours this quarter

Other Physician: 4 Occupational Therapy Aide: 2 Medical Director: 2 Physical Therapy Assistant: 1 Occupational Therapy Assistant: 1
Staff by category
Certified Nursing Assistant6606620,52091100%7.3
Licensed Practical Nurse3203211,26591100%7.9
Registered Nurse7072,20991100%7.5
Speech Language Pathologist5051,3539099%6.3
RN Director of Nursing2029926470%8
Physical Therapy Aide2029706976%7.8
Dental Services Staff2029246571%7.8
Other Dietary Services Staff2027149099%7.9
Nurse Practitioner1015126470%8
Administrator1014806066%8
Dietitian1014686167%7.7
Respiratory Therapy Technician4044508796%4.4
Physical Therapy Assistant5164377684%4.1
Qualified Social Worker1013806268%6.1
Occupational Therapy Aide0222585459%4
Occupational Therapy Assistant0114867%8
Medical Director022372224%1.5
Other Physician044362224%1.4
66 Certified Nursing Assistant
% of Days 100%
32 Licensed Practical Nurse
% of Days 100%
7 Registered Nurse
% of Days 100%
5 Speech Language Pathologist
% of Days 99%
2 RN Director of Nursing
% of Days 70%
2 Physical Therapy Aide
% of Days 76%
2 Dental Services Staff
% of Days 71%
2 Other Dietary Services Staff
% of Days 99%
1 Nurse Practitioner
% of Days 70%
1 Administrator
% of Days 66%
1 Dietitian
% of Days 67%
4 Respiratory Therapy Technician
% of Days 96%
6 Physical Therapy Assistant
% of Days 84%
1 Qualified Social Worker
% of Days 68%
2 Occupational Therapy Aide
% of Days 59%
1 Occupational Therapy Assistant
% of Days 7%
2 Medical Director
% of Days 24%
4 Other Physician
% of Days 24%

Facility Characteristics

Source: CMS Long-Term Care Facility Characteristics (Data as of Jan 2026)

Total residents 92
Medicare
15
16.3% of residents
Medicaid
47
51.1% of residents
Private pay or other
30
32.6% of residents
Programs & Services
Residents Group

Residents meet regularly to discuss policies, care quality, and activities

Active Resident Council

Organized group of residents that meets regularly to discuss facility policies, quality of life, and activities.

Quality of care over time

These measures show how residents usually do over time at this home, based on health outcomes and preventive care.

High-risk clinical events score Info A composite score based on pressure ulcers, falls with injury, weight loss, walking ability decline, and activities of daily living decline. 9.0
36% worse than California average

California average: 6.6

Functional decline score Info A composite score based on activities of daily living decline, walking ability decline, and incontinence. 18.6
65% worse than California average

California average: 11.3

Long-stay resident measures
Significantly above average California avg: 4.2 Info CMS star rating based on long-stay quality measure performance. 5 stars = significantly above average, 1 star = significantly below average.
Need for Help with Daily Activities Increased Info Percent of long-stay residents whose need for help with daily activities has increased 14.9%
35% worse than California average

California average: 11.1%

Walking Ability Worsened Info Percent of long-stay residents whose ability to move independently worsened 21.7%
81% worse than California average

California average: 12.0%

Low Risk Residents with Bowel/Bladder Incontinence Info Percent of low risk long-stay residents who lose control of their bowels or bladder 19.2%
70% worse than California average

California average: 11.3%

Falls with Major Injury Info Percent of long-stay residents experiencing one or more falls with major injury 2.7%
61% worse than California average

California average: 1.7%

High Risk Residents with Pressure Ulcers Info Percent of long-stay high risk residents with pressure ulcers 1.2%
77% better than California average

California average: 5.0%

Urinary Tract Infection Info Percent of long-stay residents with a urinary tract infection 0.0%
100% better than California average

California average: 1.2%

Lost Too Much Weight Info Percent of long-stay residents who lose too much weight 4.7%
11% worse than California average

California average: 4.2%

Depressive Symptoms Info Percent of long-stay residents who have depressive symptoms 4.4%
35% better than California average

California average: 6.7%

Antipsychotic Use Info Percent of long-stay residents who received an antipsychotic medication 12.1%
20% worse than California average

California average: 10.1%

Pneumococcal Vaccine Info Percent of long-stay residents assessed and appropriately given the pneumococcal vaccine 100.0%
In line with California average

California average: 98.5%

Influenza Vaccine Info Percent of long-stay residents assessed and appropriately given the seasonal influenza vaccine 94.7%
In line with California average

California average: 98.2%

Hospitalizations per 1,000 days Info Number of hospitalizations per 1,000 long-stay resident days. 1.75
22% better than California average

California average: 2.25

ED visits per 1,000 days Info Number of outpatient emergency department visits per 1,000 long-stay resident days. 1.58
In line with California average

California average: 1.59

Short-stay resident measures
Average California avg: 3.5 Info CMS star rating based on short-stay quality measure performance. 5 stars = much above average, 1 star = much below average.
Pneumococcal Vaccine Info Percent of short-stay residents assessed and appropriately given the pneumococcal vaccine 99.8%
6% better than California average

California average: 94.0%

Antipsychotic medication increase Info Percent of short-stay residents who newly received an antipsychotic medication 0.4%
72% better than California average

California average: 1.5%

Influenza Vaccine Info Percent of short-stay residents assessed and appropriately given the seasonal influenza vaccine 93.5%
In line with California average

California average: 93.2%

Re-hospitalized after SNF stay Info Percentage of short-stay residents who were re-hospitalized after their nursing home admission. 38.3%
65% worse than California average

California average: 23.2%

Emergency department visits Info Percentage of short-stay residents who had an outpatient emergency department visit. 13.9%
24% worse than California average

California average: 11.2%

Falls with major injury Info Percentage of SNF residents who experience falls with major injury during their stay. 0.0%
100% better than California average

California average: 0.8%

Ability to care for self at discharge Info Percentage of residents at or above expected ability to care for themselves at discharge. 27.7%
48% worse than California average

California average: 53.7%

Successful return to home or community Info Rate of successful return to home or community from a skilled nursing facility. 67.1%
33% better than California average

California average: 50.6%

Guides for Better Senior Living

Care Cost Calculator: See Prices in Your Area

Nursing Home Data Explorer

Don’t Wait Too Long: 7 Red Flag Signs Your Parent Needs Assisted Living Now

The True Cost of Assisted Living in 2025 – And How Families Are Paying For It

Understanding Senior Living Costs: Pricing Models, Discounts & Financial Assistance

Explore Open Rooms
1 Contact details
2 What type of senior care service are you looking for?
3 What budget do you have in mind for senior care?
4 How soon do you need to find care?
5 Additional details

Thank you for your interest!

Our team will be in touch shortly to help with next steps.