Redding Post Acute

Nursing Home
Overview of Redding Post Acute

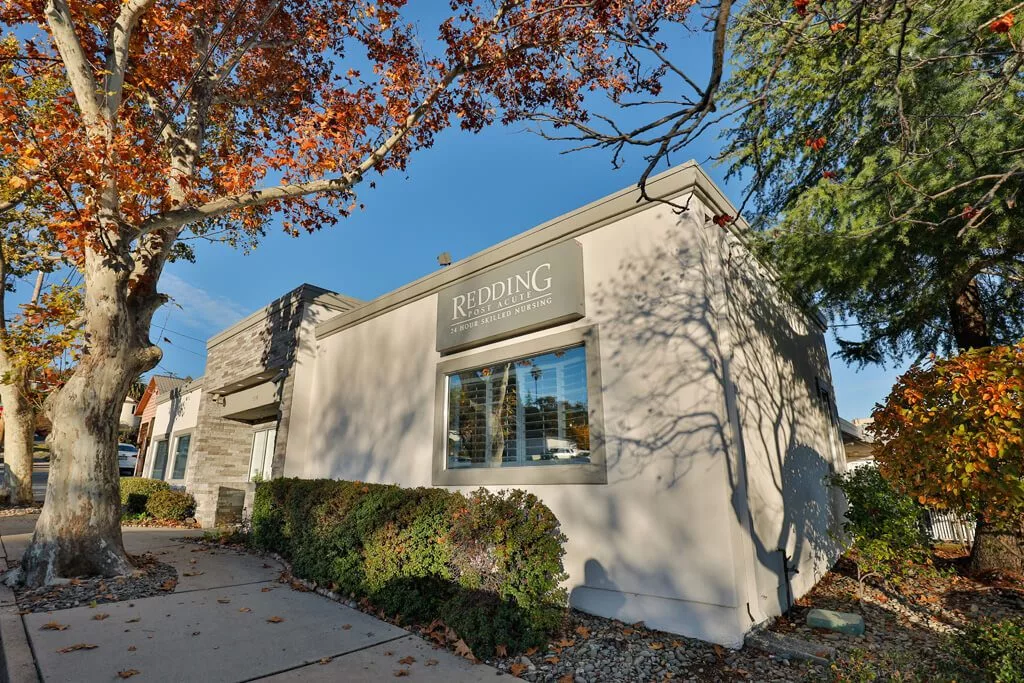
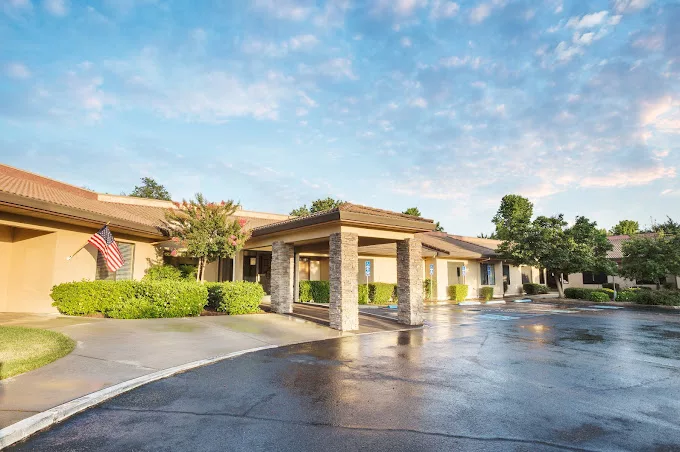
In the heart of California, Redding Post Acute offers a comprehensive range of services catering to seniors, including nursing services, rehabilitation, and post-acute care. Having undergone recent renovations in 2016, this facility has been repurposed to serve as a state-of-the-art short-term rehabilitation center, reflecting its commitment to modern and top-tier care. With a prestigious five-star rating, Redding Post Acute stands out as a trusted facility in the region, providing unparalleled 24-hour skilled nursing that includes specialized services like infection prevention, catheter care, wound care, IV therapy, and more.

Beyond medical care, Redding Post Acute believes in enhancing the overall well-being of its residents by offering engaging programs and activities. From respite stays to various tailored initiatives, this facility goes beyond the conventional, ensuring a vibrant community that fosters both health and happiness. Redding Post Acute sets the standard for nursing home activities, senior living, and nursing home qualifications.

(530) 241-6756

Quality ratings

Measured by Centers for Medicare & Medicaid Services (CMS)

Overall rating Info Official CMS rating based on health inspections, staffing and quality measures.
5/5
California average: 3.1/5
Health Inspection Info Official CMS rating based on deficiencies found during state health inspections.
4/5
California average: 2.8/5
Staffing Info Official CMS rating based on nurse staffing hours per resident per day.
2/5
California average: 3.1/5
Quality Measures Info Official CMS rating based on clinical outcomes for residents.
5/5
California average: 4.1/5

Nursing care per resident

Info Average daily nursing hours per resident (adjusted for acuity). Higher values indicate more nursing time per resident.
4h 6m per day

This home provides 3% less nursing time per resident than the state average.

California average: 4h 13m per day

Staffing hours breakdown

Info Hours of care per resident per day, broken down by staff type. Data from CMS Medicare.
Staff type Facility State avg National avg
Registered Nurse (RN) Info Registered nurse hours per resident per day. 18m per day 39m per day 41m per day
LPN / LVN Info Licensed Practical Nurse / Licensed Vocational Nurse hours per resident per day. 1h 29m per day 1h 13m per day 52m per day
Nurse Aide Info Nurse aide hours per resident per day. 2h 42m per day 2h 39m per day 2h 21m per day
Total Nursing (Weekend) Info Total number of nurse staff hours per resident per day on weekends. 3h 58m per day 4h 5m per day 3h 26m per day
Physical Therapist Info Physical therapist staff hours per resident per day. 2m per day 5m per day 4m per day
RN (Weekend) Info Registered nurse hours per resident per day on weekends. 9m per day 30m per day 29m per day

Capacity and availability

Smaller home

May offer a more intimate, personalized care environment.

Total beds 89

This home usually has availability

Lower occupancy suggests more openings may be available.

Lower demand than the California average
Occupancy rate 78.1%
Residents per day (avg) 82
Occupancy rate
78.1%
Residents per day (avg)
82

Who this home usually serves

TYPE OF STAY

Mostly short-term rehab stays

Most residents typically stay for a few weeks or months before returning home or moving on.

Might be optimal for
Short stays Recovery Medicare-covered care

Breakdown by payment type

Medicare

68% of new residents, usually for short-term rehab.

Typical stay 1 - 2 months

Private pay

25% of new residents, often for short stays.

Typical stay 18 days

Medicaid

7% of new residents, often for long-term daily care.

Typical stay 3 - 4 years

Finances and operations

Proprietary home
Corporation
Home revenue
$11.7M
Profit
$485.4K
Proprietary home Corporation
Home revenue
$11,734,313.00
Profit
$485,439.00
Payroll costs Info The portion of the home's budget spent on staff, including nurses, caregivers, and other employees who support care and operations.
$4.0M
34% of revenue
Other operating costs Info All remaining costs needed to run the home, such as food, utilities, building maintenance, supplies and administrative expenses.
$7.3M
Total costs $11.2M
Walk Score
Walk Score: 86 / 100
Very walkable. Most errands can be accomplished on foot, and many essentials are within a short walk.
BBB Rating
BBB Rating: A+ (Not Accredited)
An independent rating from the Better Business Bureau based on factors such as complaint history, transparency, and business practices.
How BBB ratings work

Additional licensing details

CMS Certification Number: 55510

Types of Care at Redding Post Acute

Skilled Nursing
Contact Redding Post Acute

Compare Nursing Homes around Redding

The information below is reported by the California Department of Social Services and Department of Public Health.
Copper Ridge Care Center
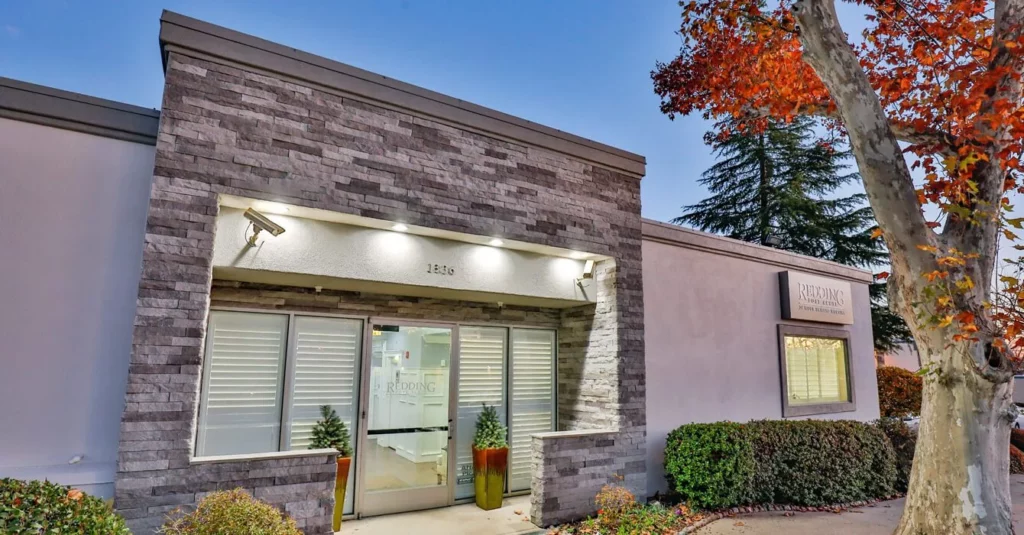
AL

Assisted Living For seniors needing help with daily tasks but not full-time nursing.

SNF

Nursing Homes 24/7 care needed

Redding (Bechelli)
125
No
-
59
THOMPSON, DARRELL
89.4%
$26,637,526.00
$8,517,250.00
32%
116.10
5/5
3.4681
5/5
2/5
5/5
-
19
1
+2%
-18%
+6%
Redding Post Acute
AL

Assisted Living For seniors needing help with daily tasks but not full-time nursing.

SNF

Nursing Homes 24/7 care needed

Redding (Downtown)
89
No
A+
86
VALLEY CAPITAL INVESTMENTS LLC
78.1%
$11,673,877.00
$3,987,659.00
34.2%
81.80
5/5
4.1020
4/5
2/5
5/5
1
20
-
-44%
-3%
-8%
Serenity Gardens
SNF

Nursing Home 24/7 care needed

AL

Assisted Living For seniors needing help with daily tasks but not full-time nursing.

CA 96001
30
No
-
-
-
-
-
-
-
-
-
-
-
-
-
-
-
-
-
-
-

Places of interest near Redding Post Acute

Address 0.9 miles from city center — 0.06 miles to nearest hospital (Dignity Health Advanced Imaging - North State)

Address 1836 Gold St, Redding, CA 96001

Calculate Travel Distance to Redding Post Acute

Add your location

Address

Staffing Data

Source: CMS Payroll-Based Journal (Q2 2025)

209
Total Staff
106
Employees
103
Contractors
40,194
Total Hours (Quarter)
49
Avg Staff/Day
9
Avg Shift (hrs)
Nursing Staff Breakdown
Role Count Avg Shift (hrs) Uses Contractors?
Registered Nurse109.7 Yes
Licensed Practical Nurse549.3 Yes
Certified Nursing Assistant5310.9 Yes
Staff by Category
Administration
2 staff
7.6hs shift avg
Nursing Staff
184 staff
9.7hs shift avg
Physicians & Practitioners
1 staff
8hs shift avg
Therapy Services
16 staff
6.6hs shift avg
Activities & Recreation
0 staff
0hs shift avg
Social Services
1 staff
7.2hs shift avg
Dietary Services
4 staff
8.1hs shift avg
Other Services
1 staff
8hs shift avg
Contractor Analysis
22.3%
of total hours from contractors
8,972 contractor hours this quarter
Registered Nurse: 3 Licensed Practical Nurse: 29 Certified Nursing Assistant: 52 Physical Therapy Aide: 4 Speech Language Pathologist: 6 Qualified Social Worker: 1 Nurse Practitioner: 1 Physical Therapy Assistant: 3 Respiratory Therapy Technician: 1 Occupational Therapy Aide: 1 Occupational Therapy Assistant: 1 Medical Director: 1
Role Employees Contractors Total Staff Total Hours Days Worked % of Days Avg Shift (hrs)
Nurse Aide in Training6306317,12491100%9.9
Licensed Practical Nurse2529548,46591100%9.3
Certified Nursing Assistant152532,7957684%10.9
Registered Nurse73102,65791100%9.7
RN Director of Nursing4041,7366470%8
Other Dietary Services Staff4041,6909099%8.1
Speech Language Pathologist0661,5597380%7.1
Physical Therapy Aide0441,2887684%7.5
Mental Health Service Worker1015046369%8
Administrator1014886167%8
Nurse Practitioner0114886167%8
Qualified Social Worker0114616470%7.2
Respiratory Therapy Technician0113825358%7.2
Physical Therapy Assistant0332546268%3.1
Occupational Therapy Aide0111562629%6
Medical Director011781314%6
Occupational Therapy Assistant011691314%5.3

Health Inspection History

Inspections
Total health inspections 8

California average 12.5


Last Health inspection on Mar 2025

Total health citations 20
Citations per inspection
2.5

Health citations are formal notices following inspections when they fail to comply with safety and care standards.

10 of 20 citations resulted from standard inspections; and 10 of 20 resulted from complaint investigations.

Breakdown of citation severity (last 3 years)
Critical Health citations More info 0
100% better than California average

California average: 0.4


Serious Health citations More info 0
100% better than California average

California average: 1

0 critical citations More info California average: 0.4

0 serious citations More info California average: 1

20 moderate citations More info California average: 47.2

0 minor citations More info California average: 1.5
Citations history (last 3 years)
Quality of Care moderate citation Mar 06, 2025
Corrected

Resident Rights moderate citation Jan 17, 2025
Corrected

Care Planning moderate citation Nov 21, 2024
Corrected

Care Planning moderate citation Nov 21, 2024
Corrected

Facility Characteristics

Source: CMS Long-Term Care Facility Characteristics (Data as of Jan 2026)

Ownership: For-Profit Corporation
Resident Census by Payment Source
84 Total Residents
Medicare 30 (35.7%)
Medicaid 53 (63.1%)
Private Pay/Other 1 (1.2%)
Programs & Services
Residents' Group
Family Engagement

Active councils help families stay involved in care decisions and facility operations.

Quality of care over time

These measures show how residents usually do over time at this home, based on health outcomes and preventive care.

High-risk clinical events score Info A composite score based on pressure ulcers, falls with injury, weight loss, walking ability decline, and activities of daily living decline. 9.2
39% worse than California average

California average: 6.6

Functional decline score Info A composite score based on activities of daily living decline, walking ability decline, and incontinence. 17.5
55% worse than California average

California average: 11.3

Long-stay resident measures
Need for Help with Daily Activities Increased Info Percent of long-stay residents whose need for help with daily activities has increased 9.3%
16% better than California average

California average: 11.1%

Walking Ability Worsened Info Percent of long-stay residents whose ability to move independently worsened 25.4%
112% worse than California average

California average: 12.0%

Low Risk Residents with Bowel/Bladder Incontinence Info Percent of low risk long-stay residents who lose control of their bowels or bladder 17.9%
59% worse than California average

California average: 11.3%

Falls with Major Injury Info Percent of long-stay residents experiencing one or more falls with major injury 4.1%
146% worse than California average

California average: 1.7%

High Risk Residents with Pressure Ulcers Info Percent of long-stay high risk residents with pressure ulcers 3.8%
24% better than California average

California average: 5.0%

Urinary Tract Infection Info Percent of long-stay residents with a urinary tract infection 1.0%
21% better than California average

California average: 1.2%

Lost Too Much Weight Info Percent of long-stay residents who lose too much weight 3.5%
18% better than California average

California average: 4.2%

Depressive Symptoms Info Percent of long-stay residents who have depressive symptoms 0.5%
92% better than California average

California average: 6.7%

Antipsychotic Use Info Percent of long-stay residents who received an antipsychotic medication 7.8%
23% better than California average

California average: 10.1%

Pneumococcal Vaccine Info Percent of long-stay residents assessed and appropriately given the pneumococcal vaccine 100.0%
In line with California average

California average: 98.5%

Influenza Vaccine Info Percent of long-stay residents assessed and appropriately given the seasonal influenza vaccine 100.0%
In line with California average

California average: 98.2%

Hospitalizations per 1,000 days Info Number of hospitalizations per 1,000 long-stay resident days. 1.10
51% better than California average

California average: 2.25

ED visits per 1,000 days Info Number of outpatient emergency department visits per 1,000 long-stay resident days. 0.65
59% better than California average

California average: 1.59

Short-stay resident measures
Pneumococcal Vaccine Info Percent of short-stay residents assessed and appropriately given the pneumococcal vaccine 100.0%
6% better than California average

California average: 94.0%

Antipsychotic medication increase Info Percent of short-stay residents who newly received an antipsychotic medication 0.5%
66% better than California average

California average: 1.5%

Influenza Vaccine Info Percent of short-stay residents assessed and appropriately given the seasonal influenza vaccine 100.0%
7% better than California average

California average: 93.2%

Re-hospitalized after SNF stay Info Percentage of short-stay residents who were re-hospitalized after their nursing home admission. 18.1%
22% better than California average

California average: 23.2%

Emergency department visits Info Percentage of short-stay residents who had an outpatient emergency department visit. 15.3%
37% worse than California average

California average: 11.2%

Falls with major injury Info Percentage of SNF residents who experience falls with major injury during their stay. 1.5%
94% worse than California average

California average: 0.8%

Ability to care for self at discharge Info Percentage of residents at or above expected ability to care for themselves at discharge. 53.3%
In line with California average

California average: 53.7%

Successful return to home or community Info Rate of successful return to home or community from a skilled nursing facility. 61.0%
21% better than California average

California average: 50.6%

Guides for Better Senior Living

Care Cost Calculator: See Prices in Your Area

Nursing Home Data Explorer

Don’t Wait Too Long: 7 Red Flag Signs Your Parent Needs Assisted Living Now

The True Cost of Assisted Living in 2025 – And How Families Are Paying For It

Understanding Senior Living Costs: Pricing Models, Discounts & Financial Assistance

Financial Aid for California Seniors

Get financial aid guidance

Multipurpose Senior Services Program

MSSP (Medi-Cal Waiver)

Age 65+, California resident, Medi-Cal eligible, nursing home risk.

~$2,829/month (300% FBR, individual).

$2,000 (individual), $3,000 (couple).

County-managed; waitlists possible.

In-Home Supportive Services (IHSS)

California IHSS

Age 65+, California resident, Medicaid-eligible or low-income.

~$1,732/month (individual, Medi-Cal threshold).

$2,000 (individual).

Can hire family as caregivers.

Multipurpose Senior Services Program (MSSP)

CA MSSP

Age 65+, California resident, Medi-Cal-eligible, nursing home-eligible but community-capable.

~$2,829/month (300% FBR, individual).

$2,000 (individual).

Available in 38 counties; waitlists common.

Property Tax Postponement Program (PTP)

CA PTP

Age 62+, California resident, own and live in home, 40% equity.

~$51,500/year (household, adjusted annually).

Equity-based; no strict asset cap.

Deferred taxes accrue interest (5% as of 2024); repaid upon sale/death.

Assisted Living Waiver (ALW)

CA ALW

Age 65+ or disabled, California resident, Medi-Cal-eligible, nursing home-eligible.

~$2,829/month (300% FBR, individual).

$2,000 (individual).

Available in 15 counties (e.g., LA, Sacramento); waitlists common.

California CARES Program

CA CARES

Caregivers of California residents 60+ needing help with 3+ daily activities; no caregiver age limit.

No strict limit; cost-sharing above ~$2,500/month threshold.

Not applicable; need-based.

High demand in urban areas; complements IHSS respite.

Low-Income Home Energy Assistance Program (LIHEAP)

CA LIHEAP

Age 60+ priority, California resident, low-income, utility/heating need.

~$2,510/month (200% of poverty level, individual).

Not applicable; income-focused.

High demand in inland/coastal extremes; weatherization capped at $5,000/home.

Who we are

Your Senior Care Partner, Every Step of the Way

We help families find affordable senior communities and unlock same day discounts, Medicaid, and Medicare options tailored to your needs.

Contact us Today
Tour Icon
Planning a tour? Check our touring checklist.
Chat Icon
Thinking of living here? We can help you speak to a current resident