Regency at Grand Blanc
CMS overall rating Info CMS (the Centers for Medicare & Medicaid Services) is the federal agency that rates nursing home quality. Its Overall Rating runs from 1 to 5 stars, combining health inspections, staffing, and quality measures, with inspections weighted most heavily.

Regency at Grand Blanc

CMS overall rating Info CMS (the Centers for Medicare & Medicaid Services) is the federal agency that rates nursing home quality. Its Overall Rating runs from 1 to 5 stars, combining health inspections, staffing, and quality measures, with inspections weighted most heavily.
Calculator: See prices in your area
Regency at Grand Blanc accepts Medicare and private pay.

Overview of Regency at Grand Blanc

Thirty-five days. That’s the average length of stay at Regency at Grand Blanc, which puts it at the acute end of post-acute care. People arrive from a hospital, recover, and leave. The neighborhood has a Walk Score of 20, car-dependent in all directions, which matters less when the stay is measured in weeks rather than months. Medicare and private pay are accepted.

The clinical infrastructure here goes well past standard short-term rehab. Cardiac rehabilitation, bariatric care, tracheostomy care, IV therapy, total parenteral nutrition, a sepsis program, and substance abuse management services are all confirmed. Pharmacy, laboratory, and radiology are on-site rather than referred out. Telemedicine access is available.

Outpatient therapy extends the facility’s services beyond discharge for patients who need continuity. A physician is on staff. Case management, discharge planning, and social work are built into the model rather than bolted on.

That breadth of clinical programming makes sense when the average stay is five weeks. Regency is handling patients who need medically complex recovery support in a concentrated window, not people settling in for a longer arc of residential care.

Staffing reflects the clinical orientation. Total nursing care runs 3 hours and 46 minutes per resident daily. RNs hold 1 hour and 8 minutes of that, which is notably high relative to other facilities in this region. Nurse aides carry 1 hour and 51 minutes, and LPNs and LVNs add 53 minutes. Activities include life enrichment classes, barbecues, puzzles, and crafts. A courtyard is on-site.

Regency at Grand Blanc operates as a medically intensive short-stay facility built for patients who need more than standard post-acute rehab in a concentrated five-week window.

(810) 695-8920

Quality ratings

Measured by Centers for Medicare & Medicaid Services (CMS)

Overall rating Info The Overall CMS Rating combines results from health inspections, staffing levels and quality measures. Health inspections carry the most weight. Staffing and quality scores can increase or decrease the final rating based on performance compared to state and national standards.
▲ 27.5% Above MI avg. ▲ 27.5% Above MI avg.MI average: 3.1Click the badge to see the full State ranking.Click here to see the full State ranking.
Health Inspection Info Based on the results of the facility's three most recent standard inspections and any complaint investigations. CMS reviews the number, scope, and severity of deficiencies, with more recent findings weighted more heavily.
▲ 6.1% Above MI avg. ▲ 6.1% Above MI avg.MI average: 2.8Click the badge to see the full State ranking.Click here to see the full State ranking.
Staffing Info Measures average nursing staff hours per resident per day, including Registered Nurses (RNs) and total nursing staff. Ratings are adjusted based on the level of care residents require and are compared to state and national benchmarks.
▲ 14.4% Above MI avg. ▲ 14.4% Above MI avg.MI average: 3.5Click the badge to see the full State ranking.Click here to see the full State ranking.
Quality Measures Info Based on clinical and physical health indicators reported to CMS, such as hospital readmissions, falls, pressure ulcers, and improvements in mobility. These measures reflect how well residents' health needs are being managed.
▲ 33.0% Above MI avg. ▲ 33.0% Above MI avg.MI average: 3.8Click the badge to see the full State ranking.Click here to see the full State ranking.

Staffing hours breakdown

Info Daily nursing hours per resident by staff type, reported to CMS. Higher is generally better — compare this facility to state and national averages to see where staffing stands.

Hours per resident per day — compared to Michigan state averages

Total nursing care / resident Info This home is ranked 90th out of 133 homes in Michigan for nurse hours. Total adjusted nursing hours per resident per day, combining RN, LPN, and aide time. CMS adjusts this for case-mix so facilities can be fairly compared.
3h 46m per day
Rank #90 / 133Nurse hours — State benchmarkedThis home is ranked 90th out of 133 homes in Michigan. Shows adjusted nurse hours per resident per day benchmarked to the Michigan average, with a ranking across 133 Michigan facilities. More hours mean more direct care. The national average is about 3.5 hrs; below 3.0 is a red flag.Click the rank badge to see the full State ranking.Click here to see the full State ranking.
This facility Michigan avg (4h 18m per day)
vs Michigan avg
-12%

2 of 6 metrics below state avg

Standout metric Physical Therapist is +80% above state avg
Staff typeHours / Day / Residentvs state avg
Registered Nurse (RN) Info RNs hold the highest nursing license and can assess residents, interpret test results, and direct care plans. More RN hours per day often signals stronger clinical oversight and faster response to health changes. 1h 8m per day ▲ 49% State avg: 46m per day · National avg: 41m per day
LPN / LVN Info Licensed Practical Nurses (LPNs) or Licensed Vocational Nurses (LVNs) deliver routine hands-on care — medication administration, wound dressing, and monitoring vital signs. They work under RN supervision and make up a large share of daily bedside care. 53m per day ■ Avg State avg: 53m per day · National avg: 52m per day
Nurse Aide Info Certified Nurse Aides (CNAs) provide the most direct day-to-day assistance: bathing, dressing, feeding, and mobility. Nurse aide hours are typically the largest staffing category and directly affect residents' quality of life. 1h 51m per day ▼ 21% State avg: 2h 20m per day · National avg: 2h 20m per day
Weekend Total Nursing Info Combined nursing hours (RN + LPN + Nurse Aide) per resident per day on weekends. Staffing often drops on weekends — this figure reveals whether the facility maintains adequate coverage outside of weekday hours. 3h 25m per day ▼ 3% State avg: 3h 31m per day · National avg: 3h 27m per day
Physical Therapist Info Hours per resident per day provided by licensed Physical Therapists (PTs) or PT Assistants. PT services help residents recover mobility after injury or illness and are especially important for post-acute (short-stay) rehabilitation. 7m per day ▲ 80% State avg: 4m per day · National avg: 4m per day
Weekend RN Info Registered nurse hours specifically on weekends. Facilities sometimes reduce RN presence on Saturdays and Sundays — a low weekend RN figure compared to weekday hours can indicate reduced clinical oversight when most administrative staff are absent. 45m per day ▲ 55% State avg: 29m per day · National avg: 29m per day

Capacity and availability

This home usually has limited availability

Higher occupancy than the Michigan average: 75.8%
Occupancy rate
91.6% Rank #25 / 386Occupancy rate — State benchmarkedThis home is ranked 25th out of 386 homes in Michigan. Shows this facility's occupancy rate versus the Michigan average, with its Statewide rank out of 386. Higher occupancy signals strong local demand and financial stability.Click the rank badge to see the full State ranking.Click here to see the full State ranking.
Avg. Length of Stay
35 days
Walk Score
Walk Score: 20 / 100 Rank #526 / 703Walk Score — State benchmarkedThis home is ranked 526th out of 703 homes in Michigan. Shows how walkable this facility's neighborhood is compared to the average Walk Score across Michigan facilities. Higher scores benefit residents, families, and staff.Click the rank badge to see the full State ranking.Click here to see the full State ranking.
Car-dependent. Most errands require a car, with limited nearby walkable options.

About this community

License Details

AccreditationsNCAL, AHCA

Safety & Compliance

Emergency SystemsYes

Therapy & Rehabilitation

2 services
Rehabilitation Services
Short-Term Rehab

Staffing & Medical

2 services
Doctor on Staff
24-Hour Staffing

Additional Services

1 service
Home Care

Additional Policies & Features

Visitor PolicyUnlimited Visiting Hours

Amenities & Lifestyle

Courtyard
ActivitiesOn-site activities include life enrichment classes, barbecues, puzzles, and crafts.
Specific Programs24-Hour Nursing Care, Bariatric Care, Cardiac Rehabilitation, Case Management, Discharge Planning, and Social Work, Dietary and Nutritional Services, IV Therapy, Outpatient Therapy, Pain Management, Pharmacy, Laboratory, and Radiology Services, Sepsis Program, Short-Term Nursing and Rehabilitation, Substance Abuse Management Services, Telemedicine Access, Total Parenteral Nutrition (TPN), Tracheostomy Care

Dining & Nutrition

Food DescriptionThe dining program emphasizes healthy meals that are designed to taste great.

Contact Regency at Grand Blanc

Staffing Data

Reporting period: October 1 – December 31, 2025 (Q4 2025). Source: CMS Payroll-Based Journal report.

Total staff 220
Employees 170
Contractors 50
Staff to resident ratio 1.75 : 1
0% compared with Michigan average
Michigan average ratio: 1.70 : 1 Michigan average ratio: 1.70 : 1See full Michigan ranking
Avg staff/day 93
Average shift 7.4 hours
6% worse than Michigan average
Michigan average: 7.9 hours Michigan average shift: 7.9 hoursSee full Michigan ranking
Total staff hours (quarter) 63,381

Nursing staff breakdown

Q4 2025 · Oct 1 – Dec 31 More info This data comes from the CMS Payroll-Based Journal report covering October 1 – December 31, 2025.
Registered Nurse

Manages medical care and health needs.

RN Staff Info All 30 RN Staff are full-time employees. No contractors work on this role. 30
Average shift length Info Average shift length. Calculated as total hours divided by days worked and average staff per day. 7.5 hours
Licensed Practical Nurse

Assists with medical care and medications.

LPN Staff Info All 30 LPN Staff are full-time employees. No contractors work on this role. 30
Average shift length Info Average shift length. Calculated as total hours divided by days worked and average staff per day. 8 hours
Certified Nursing Assistant

Helps with daily care and mobility.

CNA Staff Info All 82 CNA Staff are full-time employees. No contractors work on this role. 82
Average shift length Info Average shift length. Calculated as total hours divided by days worked and average staff per day. 7.1 hours

Contractor staffing

Q4 2025 · Oct 1 – Dec 31 More info This data comes from the CMS Payroll-Based Journal report covering October 1 – December 31, 2025.

Total hours from contractors

16.4%

10,422 contractor hours this quarter

Speech Language Pathologist: 13 Physical Therapy Assistant: 11 Physical Therapy Aide: 8 Respiratory Therapy Technician: 7 Occupational Therapy Assistant: 4 Qualified Social Worker: 3 Clinical Nurse Specialist: 2 Therapeutic Recreation Specialist: 1 Medical Director: 1

Staff by category

Q4 2025 · Oct 1 – Dec 31 More info This data comes from the CMS Payroll-Based Journal report covering October 1 – December 31, 2025.
Certified Nursing Assistant8208222,34792100%7.1
Licensed Practical Nurse3003010,67292100%8
Registered Nurse300309,08192100%7.5
Clinical Nurse Specialist102124,2638592%7.9
Speech Language Pathologist013133,24792100%7.2
Physical Therapy Assistant011113,0659199%7.1
Dental Services Staff4041,8207076%8
Other Dietary Services Staff6061,7149199%7.4
Respiratory Therapy Technician0771,5037986%7.3
Physical Therapy Aide0881,4916975%7.2
Occupational Therapy Aide2029686470%8
Administrator1015126470%8
Mental Health Service Worker1015126470%8
Nurse Practitioner1014886166%8
Dietitian1014725964%8
Therapeutic Recreation Specialist0114616368%7.3
Qualified Social Worker0334446773%6.6
RN Director of Nursing1011443639%4
Occupational Therapy Assistant0441205863%2.1
Medical Director011351820%1.9
Nurse Aide in Training1012433%7.8
82 Certified Nursing Assistant
% of Days 100%
30 Licensed Practical Nurse
% of Days 100%
30 Registered Nurse
% of Days 100%
12 Clinical Nurse Specialist
% of Days 92%
13 Speech Language Pathologist
% of Days 100%
11 Physical Therapy Assistant
% of Days 99%
4 Dental Services Staff
% of Days 76%
6 Other Dietary Services Staff
% of Days 99%
7 Respiratory Therapy Technician
% of Days 86%
8 Physical Therapy Aide
% of Days 75%
2 Occupational Therapy Aide
% of Days 70%
1 Administrator
% of Days 70%
1 Mental Health Service Worker
% of Days 70%
1 Nurse Practitioner
% of Days 66%
1 Dietitian
% of Days 64%
1 Therapeutic Recreation Specialist
% of Days 68%
3 Qualified Social Worker
% of Days 73%
1 RN Director of Nursing
% of Days 39%
4 Occupational Therapy Assistant
% of Days 63%
1 Medical Director
% of Days 20%
1 Nurse Aide in Training
% of Days 3%

Penalties and fines

Federal penalties imposed by CMS for regulatory violations, including civil money penalties (fines) and denials of payment for new Medicare/Medicaid admissions.

Source: CMS Penalties Database

No penalties in the past 3 years

No civil money penalties or payment denials were reported in the last 3 years.

Quality of care over time

These measures show how residents usually do over time at this home, based on health outcomes and preventive care.

High-risk clinical events score Info A composite score based on pressure ulcers, falls with injury, weight loss, walking ability decline, and activities of daily living decline. 11.3
35% worse than Michigan average

Michigan average: 8.4

Functional decline score Info A composite score based on activities of daily living decline, walking ability decline, and incontinence. 20.2
24% worse than Michigan average

Michigan average: 16.3

Long-stay resident measures
Need for Help with Daily Activities Increased Info Percent of long-stay residents whose need for help with daily activities has increased 17.5%
40% worse than Michigan average

Michigan average: 12.5%

Walking Ability Worsened Info Percent of long-stay residents whose ability to move independently worsened 18.2%
19% worse than Michigan average

Michigan average: 15.3%

Low Risk Residents with Bowel/Bladder Incontinence Info Percent of low risk long-stay residents who lose control of their bowels or bladder 24.9%
19% worse than Michigan average

Michigan average: 21.0%

Falls with Major Injury Info Percent of long-stay residents experiencing one or more falls with major injury 0.0%
100% better than Michigan average

Michigan average: 3.2%

High Risk Residents with Pressure Ulcers Info Percent of long-stay high risk residents with pressure ulcers 10.5%
82% worse than Michigan average

Michigan average: 5.7%

Urinary Tract Infection Info Percent of long-stay residents with a urinary tract infection 4.3%
152% worse than Michigan average

Michigan average: 1.7%

Lost Too Much Weight Info Percent of long-stay residents who lose too much weight 10.4%
84% worse than Michigan average

Michigan average: 5.7%

Depressive Symptoms Info Percent of long-stay residents who have depressive symptoms 9.4%
144% worse than Michigan average

Michigan average: 3.9%

Antipsychotic Use Info Percent of long-stay residents who received an antipsychotic medication 15.4%
In line with Michigan average

Michigan average: 15.0%

Pneumococcal Vaccine Info Percent of long-stay residents assessed and appropriately given the pneumococcal vaccine 100.0%
5% better than Michigan average

Michigan average: 94.9%

Influenza Vaccine Info Percent of long-stay residents assessed and appropriately given the seasonal influenza vaccine 97.0%
In line with Michigan average

Michigan average: 95.0%

Short-stay resident measures
Pneumococcal Vaccine Info Percent of short-stay residents assessed and appropriately given the pneumococcal vaccine 97.9%
19% better than Michigan average

Michigan average: 82.5%

Antipsychotic medication increase Info Percent of short-stay residents who newly received an antipsychotic medication 1.3%
12% better than Michigan average

Michigan average: 1.4%

Influenza Vaccine Info Percent of short-stay residents assessed and appropriately given the seasonal influenza vaccine 96.1%
21% better than Michigan average

Michigan average: 79.5%

Breakdown by payment type

Medicare

32% of new residents, usually for short-term rehab.

Typical stay 26 days

Private pay

68% of new residents, often for short stays.

Typical stay 1 - 2 months

Facility Characteristics

Source: CMS Long-Term Care Facility Characteristics (Data as of Jan 2026)

Total residents 126
Medicare
66
52.4% of residents
Medicaid
49
38.9% of residents
Private pay or other
11
8.7% of residents
Programs & Services
Residents Group

Residents meet regularly to discuss policies, care quality, and activities

Active Resident Council

Organized group of residents that meets regularly to discuss facility policies, quality of life, and activities.

Finances and operations

Based on the 2023 CMS SNF Cost Report.

Privately-owned community
Operated by a single business entity.
Home revenue
$37.1M
Profit
$964.6K
Privately-owned community Operated by a single business entity.
Home revenue
$37.1M Rank #6 / 134Revenue — State benchmarkedThis home is ranked 6th out of 134 homes in Michigan. Shows this facility's annual revenue compared to the Michigan average. Higher revenue generally means more resources for staffing and capital — read alongside Payroll %.Click the rank badge to see the full State ranking.Click here to see the full State ranking.
Profit
$964.6K
Payroll costs Info The portion of the home's budget spent on staff, including nurses, caregivers, and other employees who support care and operations. Rank #17 / 134Payroll — State benchmarkedThis home is ranked 17th out of 134 homes in Michigan. Shows total annual staff payroll benchmarked to the Michigan average. Higher payroll investment relative to peers often signals better staffing and less reliance on cheaper contract labor.Click the rank badge to see the full State ranking.Click here to see the full State ranking.
$12.2M
32.9% of revenue Rank #114 / 134Payroll % — State benchmarkedThis home is ranked 114th out of 134 homes in Michigan. Shows payroll as a percentage of revenue versus the Michigan average. Well-run Michigan facilities typically land around 49–59% — the top third Statewide. Below 25% may signal understaffing or heavy agency use — read with Staffing ratings.Click the rank badge to see the full State ranking.Click here to see the full State ranking.
Other operating costs Info All remaining costs needed to run the home, such as food, utilities, building maintenance, supplies and administrative expenses.
$23.9M
Total costs $36.1M

Who this home usually serves

TYPE OF STAY

Primarily short stays

Residents typically stay for brief periods, with frequent admissions and discharges throughout the year.

Most new residents arrive under private pay (68% of admissions), and a typical private pay stay runs around 1 - 2 months.

Admissions
1,340 total

Coverage residents most often arrive under.

Medicare 32%
Private pay 68%
Discharges
1,337 total

Coverage residents most often leave under.

Medicare 32%
Private pay 68%

Financial Assistance for
Nursing Home in Michigan

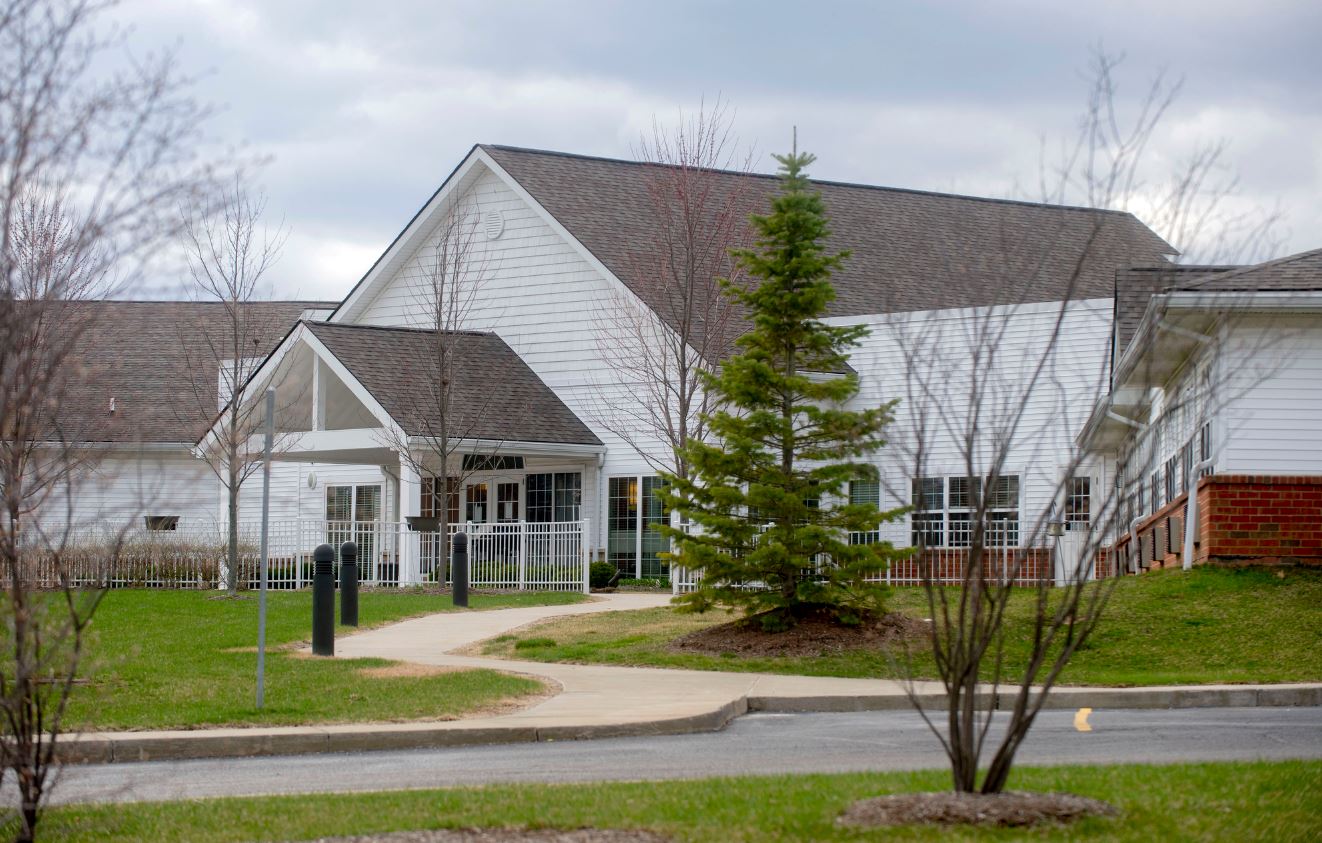
Regency at Grand Blanc is located in Flint, Michigan.
Here are the financial assistance programs available to residents in Michigan.

Get Financial aid guidance

MI Choice Waiver

Michigan Medicaid MI Choice Waiver

Age 65+ or disabled
General Michigan resident, Medicaid- eligible, nursing home-level care need.
Income Limits (2025) ~$2,829/month 300% FBR, individual
Asset Limits $2,000 (individual), $3,000 (couple).
MI

Delivered through regional waiver agents; waitlists possible.

Benefits
Personal care (5-7 hours/day) Respite care (240 hours/year) Home modifications ($1,500 avg.) Adult day care ($65/day)

Home Help Program

Michigan Home Help

Age 65+ or disabled
General Michigan resident, Medicaid- eligible or low-income.
Income Limits ~$1,732/month individual, Medicaid threshold
Asset Limits $2,000 individual
MI

Can hire family caregivers; less intensive than waiver.

Benefits
Personal care (up to 60 hours/month) Homemaker services Respite (varies)

Program of All-Inclusive Care for the Elderly (PACE)

Michigan PACE

Age 55+
General Michigan resident, nursing home-level care need, safe with PACE support.
Income Limits (2025) ~$2,829/month (Medicaid-eligible); private pay option available.
Asset Limits $2,000 (individual), $3,000 (couple).
MI

16 PACE centers (e.g., Ingham, Wayne counties); expanding slowly.

Benefits
Personal care (5-7 hours/day) Medical care Meals Transportation Therapy Respite

Medicare Savings Program (MSP)

Michigan Medicare Savings Program

Age 65+ or disabled
General Michigan resident, Medicare Part A/B.
Income Limits (2025) ~$2,510/month (QMB), ~$3,380/month (SLMB), ~$3,598/month (QI)—individual.
Asset Limits $9,430 (individual), $14,130 (couple).
MI

Three tiers; no waitlist; includes Extra Help for Part D.

Benefits
Covers Part B premiums ($174.70/month) Deductibles ($240/year) Copays (~20%)

National Family Caregiver Support Program (NFCSP) Respite

Michigan NFCSP Respite Care

Age
General Caregivers of 60+ needing care or 55+ caregivers of others; Michigan resident; functional needs (2+ ADLs).
Income Limits (2025) Prioritizes ~$24,980/year (individual); no strict cap.
Asset Limits Not assessed; need-based.
MI

16 AAAs; prioritizes low-income, rural caregivers.

Benefits
Respite (4-6 hours/week or 5 days/year) Adult day care ($60/day) Caregiver training

VA Aid and Attendance (A&A) and Housebound Benefits

Michigan VA Aid and Attendance/Housebound

Age 65+ or disabled veteran/spouse
General Michigan resident, wartime service, need for ADL help (A&A) or homebound.
Income Limits (2025) Net income < ~$1,984/month (veteran with dependent, A&A); pension offsets income.
Asset Limits ~$155,356 net worth limit
MI

High veteran demand in urban/rural areas.

Benefits
Cash (~$1,433-$2,642/month veteran, ~$951-$1,318 spouse) for care costs

Frequently Asked Questions about Regency at Grand Blanc

Is Regency at Grand Blanc in a walkable area?

Regency at Grand Blanc has a walk score of 20. Car-dependent. Most errands require a car, with limited nearby walkable options.

What is the occupancy rate at Regency at Grand Blanc?

Regency at Grand Blanc's occupancy is 91.6%.

Are there photos of Regency at Grand Blanc?

Yes — there is 1 photo of Regency at Grand Blanc in the photo gallery on this page.

What is the phone number of Regency at Grand Blanc?

(810) 695-8920 will put you in contact with the team at Regency at Grand Blanc.

Is Regency at Grand Blanc Medicare or Medicaid certified?

Yes — Regency at Grand Blanc is a CMS-certified provider of Medicare and Medicaid.

Guides for Better Senior Living

Care Cost Calculator: See Prices in Your Area

Nursing Home Data Explorer

Don’t Wait Too Long: 7 Red Flag Signs Your Parent Needs Assisted Living Now

The True Cost of Assisted Living in 2025 – And How Families Are Paying For It

Understanding Senior Living Costs: Pricing Models, Discounts & Financial Assistance

Explore Open Rooms
1 Contact details
2 What type of senior care service are you looking for?
3 What budget do you have in mind for senior care?
4 How soon do you need to find care?
5 Additional details

Thank you for your interest!

Our team will be in touch shortly to help with next steps.