Nursing Home

River Bluff Nursing Home

Nursing Home

River Bluff Nursing Home

4401 N Main St, Rockford, IL 61103 View map
Overview of River Bluff Nursing Home

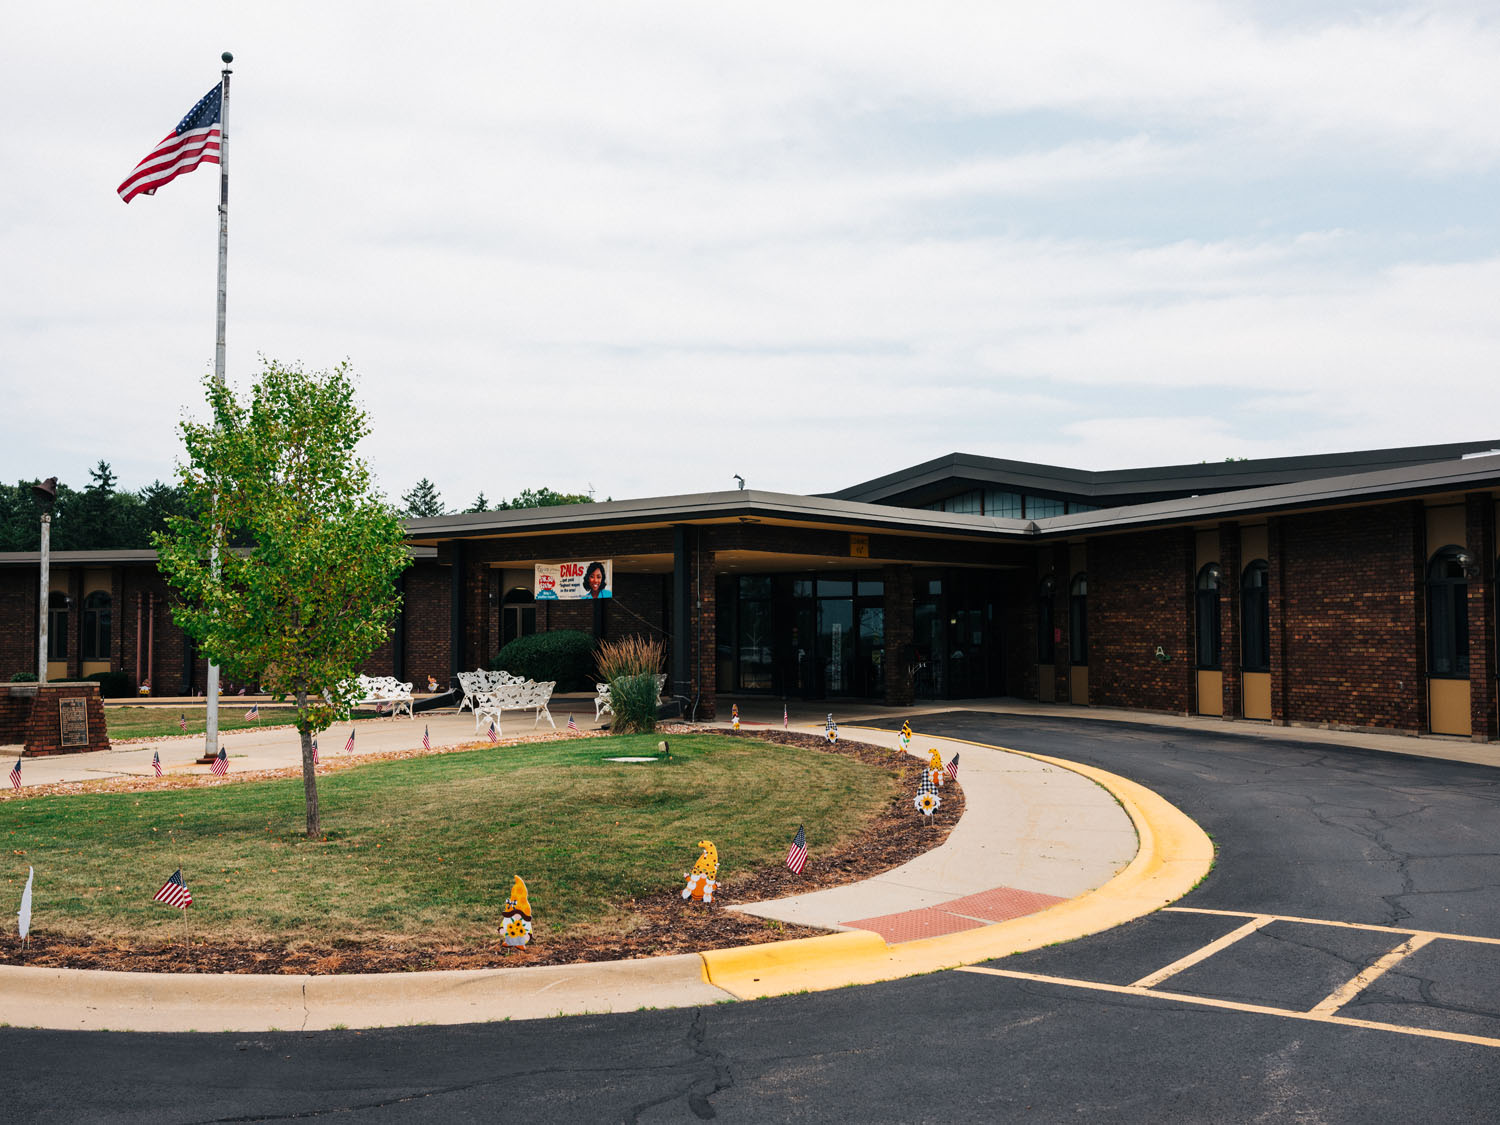
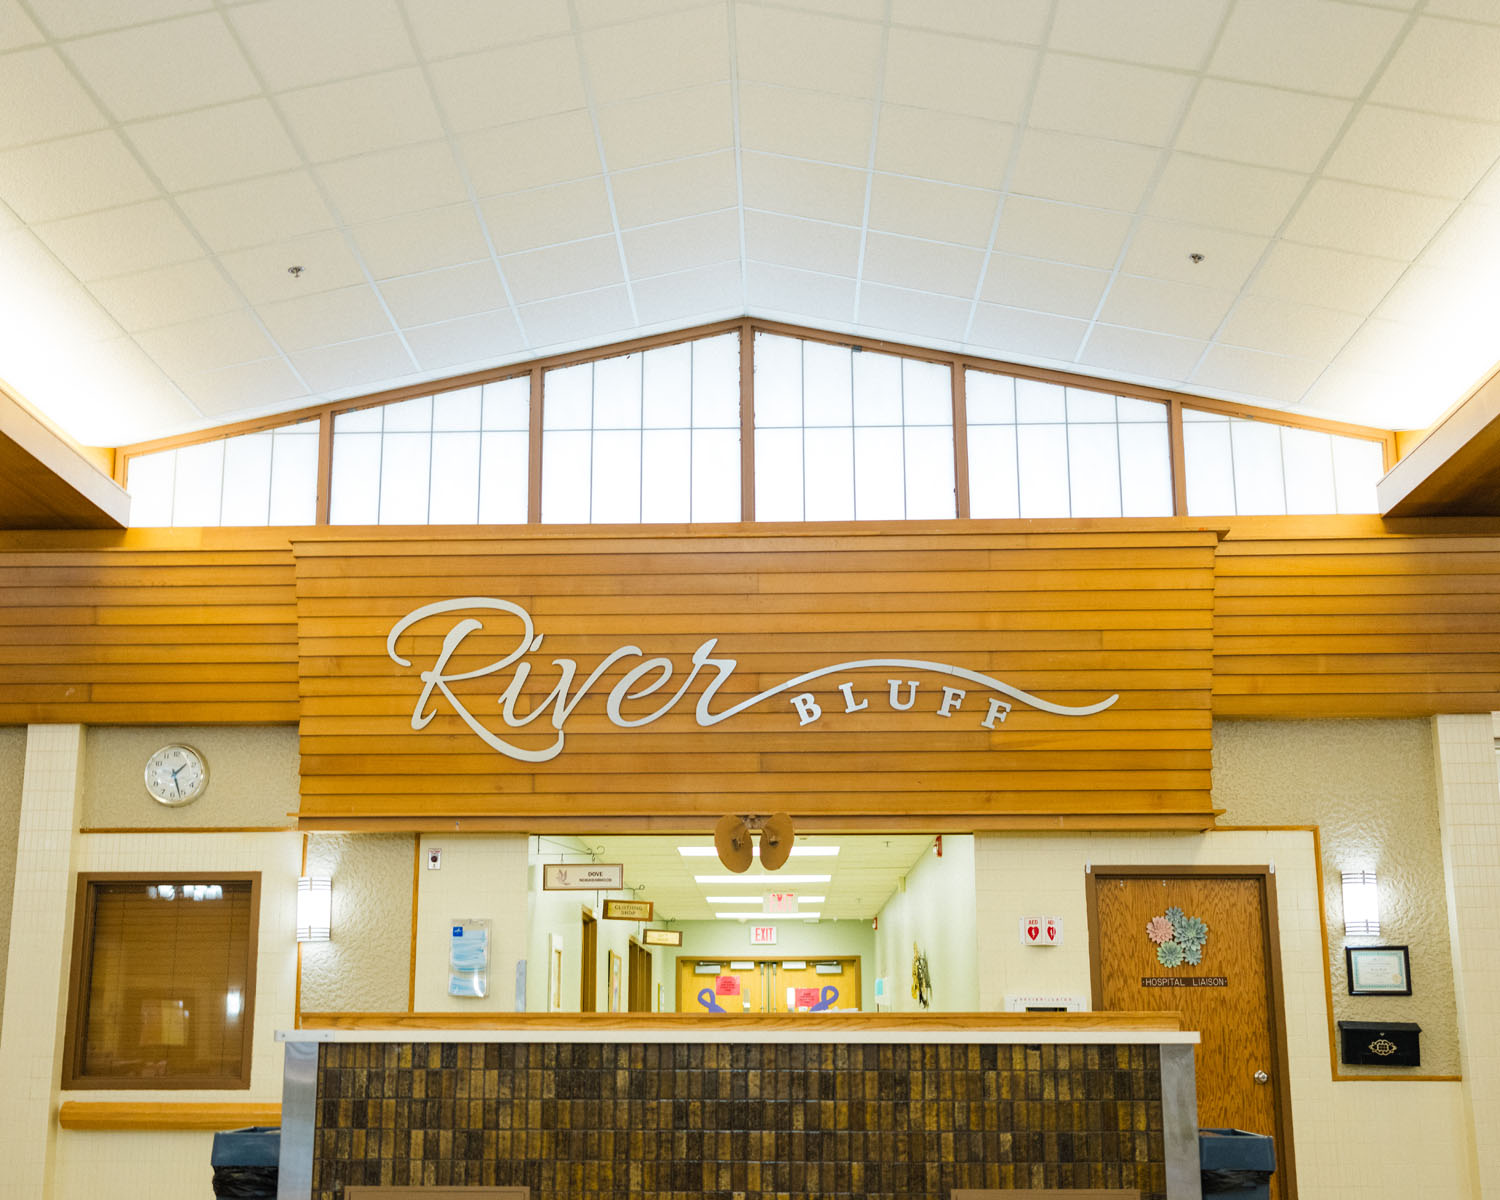
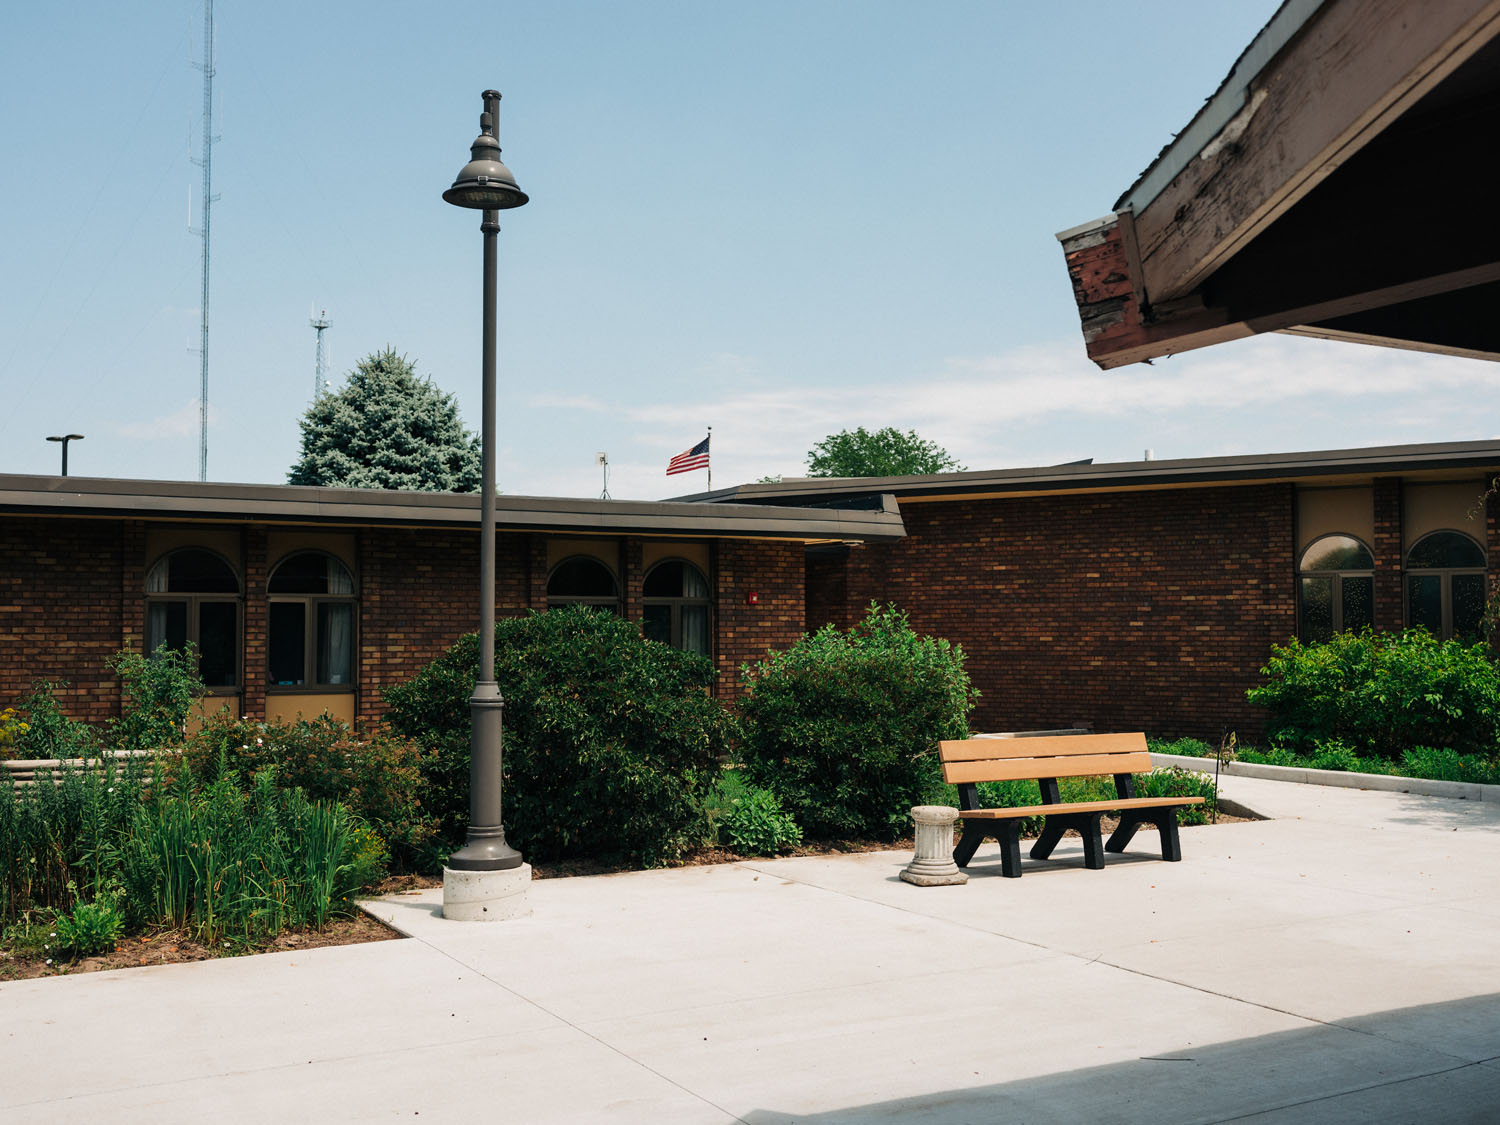
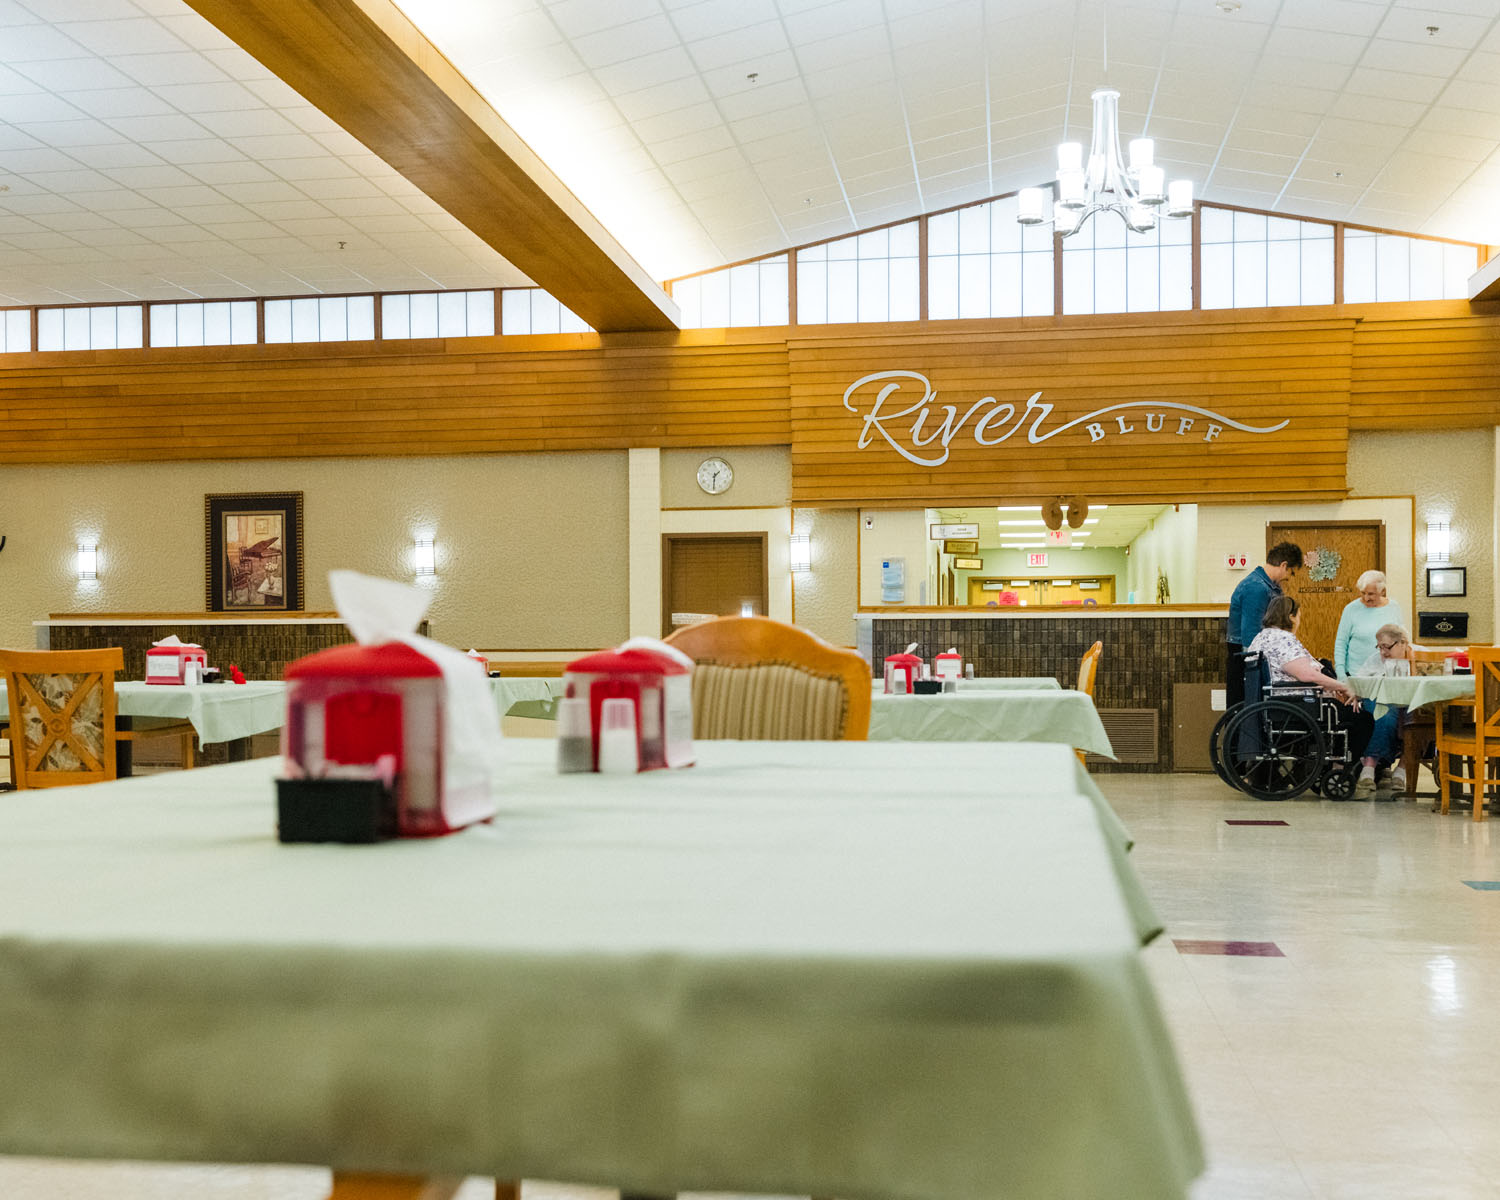
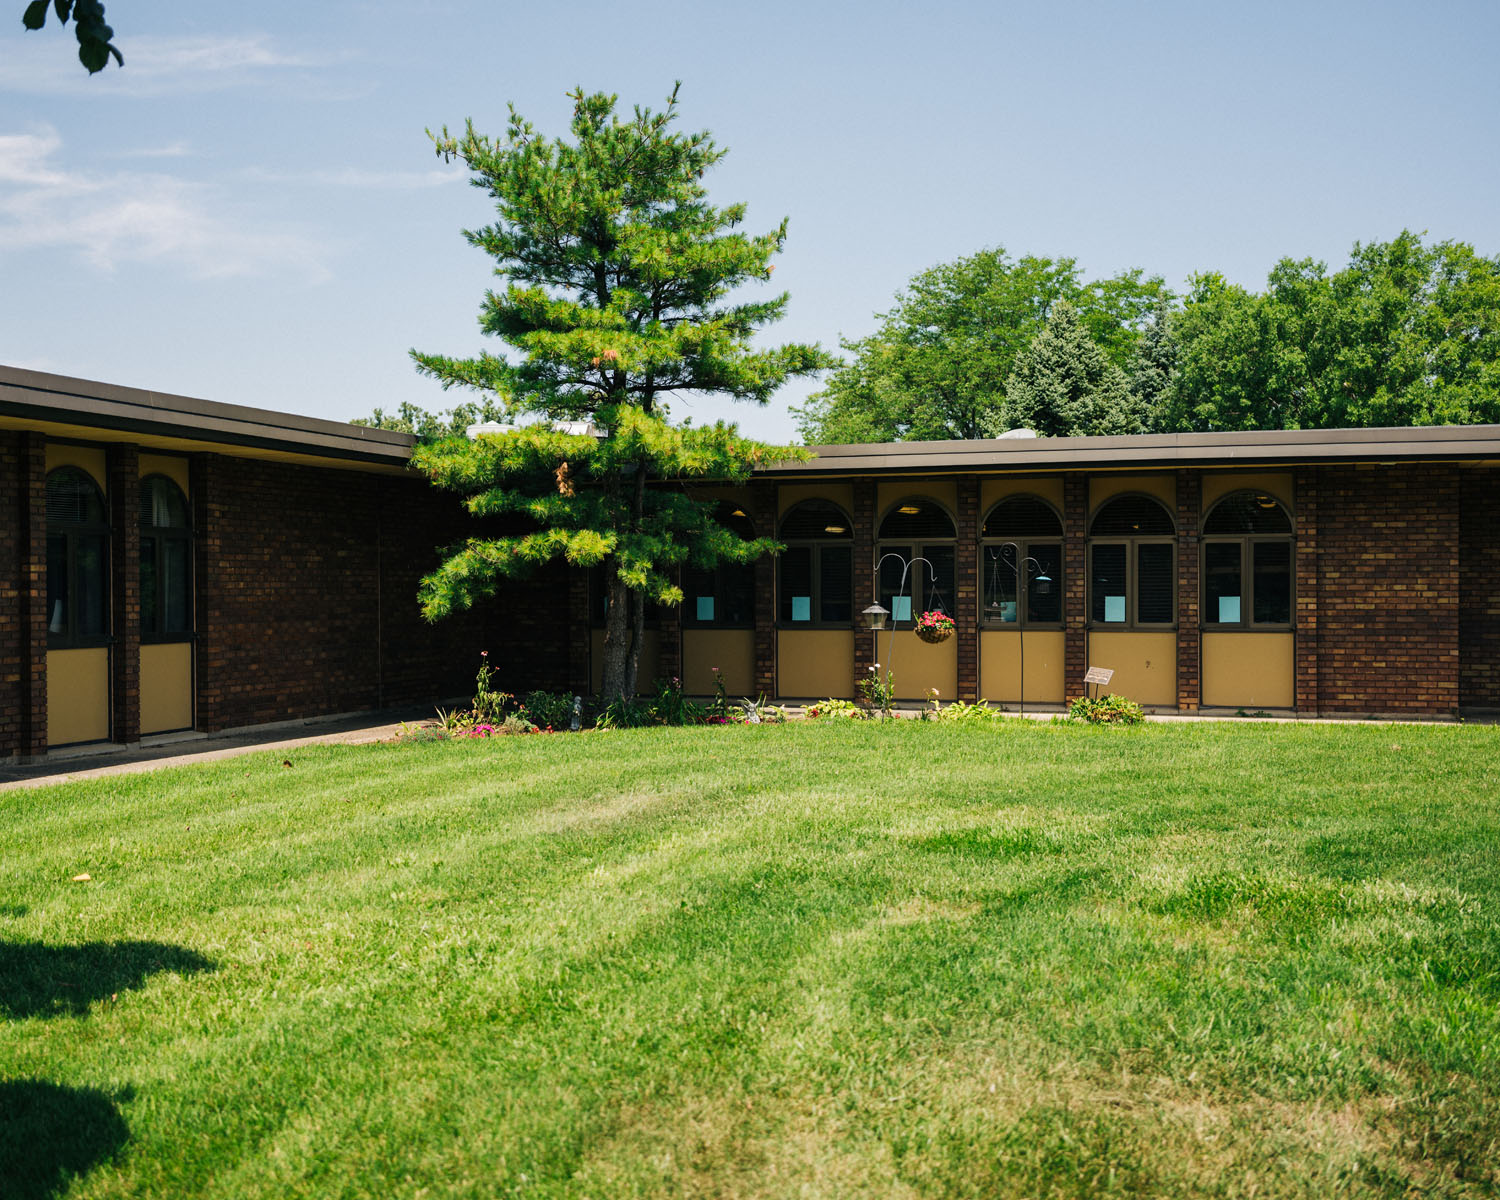
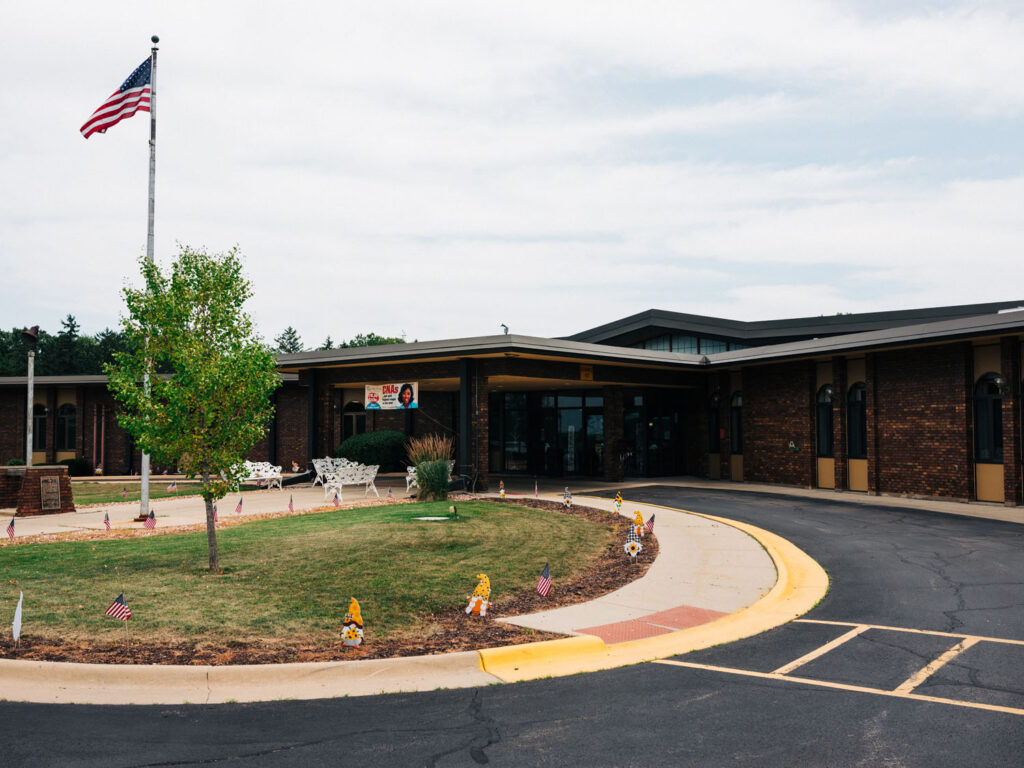
Lodged along the serene landscapes of Rockford, Illinois, lies the cherished haven known as River Bluff Nursing Home. Within its walls, a compassionate staff stands ready to embrace and uplift every resident, creating a nurturing environment that feels like a true home. As a participant in Medicare and Medicaid programs, it opens its doors to those seeking quality care, irrespective of their financial circumstances. With a spacious capacity of 300 beds and county ownership, it stands as a pillar of support and compassion within the community it serves.

Beyond the confines of the home, the surrounding neighborhood envelops River Bluff Nursing Home in a vibrant embrace, fostering a sense of community and belonging. Laughter dances through the halls as residents come together for spirited rounds of bingo, forging lasting connections and cherished memories. Its essence lies in the bonds that form, the smiles that brighten each day, and the belief that every individual deserves the highest standard of care and love.

Quality ratings

Measured by Centers for Medicare & Medicaid Services (CMS)

Overall rating Info Official CMS rating based on health inspections, staffing and quality measures.
3/5
Illinois average: 2.5/5
Health Inspection Info Official CMS rating based on deficiencies found during state health inspections.
4/5
Illinois average: 2.8/5
Staffing Info Official CMS rating based on nurse staffing hours per resident per day.
4/5
Illinois average: 2.1/5
Quality Measures Info Official CMS rating based on clinical outcomes for residents.
1/5
Illinois average: 2.8/5

Nursing care per resident

Info Average daily nursing hours per resident (adjusted for acuity). Higher values indicate more nursing time per resident.
4h 8m per day

This home provides 33% more nursing time per resident than the Illinois average.

Illinois average: 3h 6m per day

Staffing hours breakdown

Info Hours of care per resident per day, broken down by staff type. Data from CMS Medicare.
Staff type Facility State avg National avg
Registered Nurse (RN) Info Registered nurse hours per resident per day. 49m per day 44m per day 41m per day
Nurse Aide Info Nurse aide hours per resident per day. 2h 48m per day 2h 8m per day 2h 21m per day
Total Nursing (Weekend) Info Total number of nurse staff hours per resident per day on weekends. 4h 10m per day 3h 5m per day 3h 26m per day
Physical Therapist Info Physical therapist staff hours per resident per day. 1m per day 3m per day 4m per day
RN (Weekend) Info Registered nurse hours per resident per day on weekends. 36m per day 34m per day 29m per day

Capacity and availability

High-capacity home

May provide extensive amenities, services and programs.

Total beds 304

This home usually has availability

Lower occupancy suggests more openings may be available.

Lower demand than the Illinois average
Occupancy rate 45.6%
Residents per day (avg) 145
Occupancy rate
45.6%
Residents per day (avg)
145

Who this home usually serves

TYPE OF STAY

Mostly long-term care residents

Most residents stay for extended periods and receive ongoing daily care.

Might be optimal for
Long-term daily care Ongoing support needs

Breakdown by payment type

Medicare

31% of new residents, usually for short-term rehab.

Typical stay 28 days

Private pay

24% of new residents, often for short stays.

Typical stay 5 - 6 months

Medicaid

44% of new residents, often for long-term daily care.

Typical stay 1 - 2 years

Finances and operations

Governmental community
Operated by county authorities.
Home revenue
$19.7M
Operating deficit
-$1.8M
Governmental community Operated by county authorities.
Home revenue
$19,728,887.00
Operating deficit
$-1,837,951.00
Payroll costs Info The portion of the home's budget spent on staff, including nurses, caregivers, and other employees who support care and operations.
$7.2M
36.7% of revenue
Other operating costs Info All remaining costs needed to run the home, such as food, utilities, building maintenance, supplies and administrative expenses.
$14.3M
Total costs $21.6M

What does this home offer?

Accepts Medicaid icon

Accept Medicaid: Yes

Building type icon
Building type icon

Building Type: Single-story

Dining services icon

Dining Services

Beauty services icon

Beauty Services

Social and recreational activities icon

Social and Recreational Activities

Rehabilitative support icon

Rehabilitative Support

On-site medical care and health services icon

On-site Medical Care and Health Services

Types of Care at River Bluff Nursing Home

Nursing Home Memory Care Hospice Care

Health Inspection History

Inspections
Total health inspections 10

Illinois average 10.4


Last Health inspection on Jul 2025

Total health citations 30
Citations per inspection
3

Health citations are formal notices following inspections when they fail to comply with safety and care standards.

23 of 30 citations resulted from standard inspections; and 7 of 30 resulted from complaint investigations.

Breakdown of citation severity (last 3 years)
Critical Health citations More info 0
100% better than Illinois average

Illinois average: 0.7


Serious Health citations More info 2
44% better than Illinois average

Illinois average: 3.6

0 critical citations More info Illinois average: 0.7

2 serious citations More info Illinois average: 3.6

27 moderate citations More info Illinois average: 32

1 minor citation More info Illinois average: 0.5
Citations history (last 3 years)
Environmental moderate citation Jul 17, 2025
Corrected

Infection Control moderate citation Apr 10, 2025
Corrected

Pharmacy moderate citation Apr 10, 2025
Corrected

Quality of Care moderate citation Apr 10, 2025
Corrected

Compare Nursing Homes around Rockford

The information below is reported by the Illinois Department of Public Health, Office of Health Care Regulation.
River Bluff Nursing Home
SNF

Nursing Homes 24/7 care needed

Rockford
304
33
COUNTY OF WINNEBAGO
45.6%
$15,291,278.00
$7,244,415.00
47.4%
145
3/5
4.1268
4/5
4/5
1/5
2
30
2
-37%
+33%
-34%
Amberwood Care Centre
AL

Assisted Living For seniors needing help with daily tasks but not full-time nursing.

IL

Independent Living For self-sufficient seniors seeking community and minimal assistance.

MC

Memory Care Specialized care for those with Memory Loss, Alzheimer's, or dementia, ensuring safety and support.

SNF

Nursing Homes 24/7 care needed

Rockford
141
47
TODD STERN 2015 TRUST
86.1%
$14,237,994.00
$5,976,044.00
42%
123.40
3/5
2.6111
3/5
2/5
3/5
-
43
-
-22%
-16%
+24%
Rock River Healthcare
AL

Assisted Living For seniors needing help with daily tasks but not full-time nursing.

IL

Independent Living For self-sufficient seniors seeking community and minimal assistance.

MC

Memory Care Specialized care for those with Memory Loss, Alzheimer's, or dementia, ensuring safety and support.

SNF

Nursing Homes 24/7 care needed

Rockford
130
60
SMF HEALTHCARE LLC
54.2%
$6,279,802.00
$2,509,181.00
40%
78.30
2/5
2.0057
2/5
2/5
2/5
3
44
4
-10%
-35%
-22%
Alden Park Strathmoor
AL

Assisted Living For seniors needing help with daily tasks but not full-time nursing.

IL

Independent Living For self-sufficient seniors seeking community and minimal assistance.

MC

Memory Care Specialized care for those with Memory Loss, Alzheimer's, or dementia, ensuring safety and support.

SNF

Nursing Homes 24/7 care needed

Rockford
189
33
KULJANIN, NIKOLINA
73.8%
$15,096,682.00
$6,131,060.00
40.6%
154.00
2/5
2.4800
2/5
1/5
5/5
2
28
4
+19%
-20%
+7%
Citadel PA Peterson
AL

Assisted Living For seniors needing help with daily tasks but not full-time nursing.

IL

Independent Living For self-sufficient seniors seeking community and minimal assistance.

MC

Memory Care Specialized care for those with Memory Loss, Alzheimer's, or dementia, ensuring safety and support.

SNF

Nursing Homes 24/7 care needed

Rockford
158
31
-
85.5%
$22,264,541.00
$6,288,890.00
28.2%
121.10
1/5
2.6986
2/5
1/5
2/5
2
63
4
-17%
-13%
+23%

Places of interest near River Bluff Nursing Home

Address 4.1 miles from city center — 3.91 miles to nearest hospital (UW Health SwedishAmerican Hospital)

Address 4401 N Main St, Rockford, IL 61103

Calculate Travel Distance to River Bluff Nursing Home

Add your location

Address

Staffing Data

Source: CMS Payroll-Based Journal (Q2 2025)

214
Total Staff
179
Employees
35
Contractors
70,199
Total Hours (Quarter)
99
Avg Staff/Day
7.8
Avg Shift (hrs)
Nursing Staff Breakdown
Role Count Avg Shift (hrs) Uses Contractors?
Registered Nurse198.7 Yes
Licensed Practical Nurse378.5 Yes
Certified Nursing Assistant1157.6 Yes
Staff by Category
Administration
1 staff
8hs shift avg
Nursing Staff
171 staff
7.9hs shift avg
Physicians & Practitioners
9 staff
7.9hs shift avg
Therapy Services
13 staff
6hs shift avg
Activities & Recreation
0 staff
0hs shift avg
Social Services
3 staff
2.1hs shift avg
Dietary Services
12 staff
7.5hs shift avg
Other Services
5 staff
7.7hs shift avg
Contractor Analysis
7.7%
of total hours from contractors
5,404 contractor hours this quarter
Certified Nursing Assistant: 1 Licensed Practical Nurse: 14 Registered Nurse: 4 Speech Language Pathologist: 2 Respiratory Therapy Technician: 3 Physical Therapy Aide: 5 Physical Therapy Assistant: 2 Qualified Social Worker: 3 Occupational Therapy Aide: 1
Role Employees Contractors Total Staff Total Hours Days Worked % of Days Avg Shift (hrs)
Certified Nursing Assistant114111537,51191100%7.6
Licensed Practical Nurse23143712,55991100%8.5
Registered Nurse154196,38691100%8.7
Other Dietary Services Staff120125,05291100%7.5
Clinical Nurse Specialist8083,5448088%8
Dental Services Staff4041,7636470%7.7
Physical Therapy Aide0555846875%5.9
Administrator1014966268%8
Nurse Practitioner1014886369%7.7
Speech Language Pathologist0224626066%5.9
Physical Therapy Assistant0224186066%7
Mental Health Service Worker1014135257%7.9
Respiratory Therapy Technician0333406673%5.1
Occupational Therapy Aide0111321618%8.3
Qualified Social Worker033522527%2.1

Facility Characteristics

Source: CMS Long-Term Care Facility Characteristics (Data as of Jan 2026)

Total census
139 residents
Residents by payment source
Medicare
8 residents (5.8%)
Medicaid
115 residents (82.7%)
Private pay or other
16 residents (11.5%)
Programs & Services
Residents' Group

Residents meet regularly to discuss policies, care quality, and activities

Active Resident Council

Organized group of residents that meets regularly to discuss facility policies, quality of life, and activities.

Quality of care over time

These measures show how residents usually do over time at this home, based on health outcomes and preventive care.

High-risk clinical events score Info A composite score based on pressure ulcers, falls with injury, weight loss, walking ability decline, and activities of daily living decline. 12.6
30% worse than Illinois average

Illinois average: 9.7

Functional decline score Info A composite score based on activities of daily living decline, walking ability decline, and incontinence. 26.7
44% worse than Illinois average

Illinois average: 18.6

Long-stay resident measures
Below average Illinois avg: 3.6 Info CMS star rating based on long-stay quality measure performance. 5 stars = significantly above average, 1 star = significantly below average.
Need for Help with Daily Activities Increased Info Percent of long-stay residents whose need for help with daily activities has increased 25.2%
63% worse than Illinois average

Illinois average: 15.5%

Walking Ability Worsened Info Percent of long-stay residents whose ability to move independently worsened 26.0%
41% worse than Illinois average

Illinois average: 18.4%

Low Risk Residents with Bowel/Bladder Incontinence Info Percent of low risk long-stay residents who lose control of their bowels or bladder 28.9%
34% worse than Illinois average

Illinois average: 21.6%

Falls with Major Injury Info Percent of long-stay residents experiencing one or more falls with major injury 1.4%
57% better than Illinois average

Illinois average: 3.4%

High Risk Residents with Pressure Ulcers Info Percent of long-stay high risk residents with pressure ulcers 3.9%
26% better than Illinois average

Illinois average: 5.3%

Urinary Tract Infection Info Percent of long-stay residents with a urinary tract infection 7.5%
315% worse than Illinois average

Illinois average: 1.8%

Lost Too Much Weight Info Percent of long-stay residents who lose too much weight 6.4%
In line with Illinois average

Illinois average: 6.5%

Depressive Symptoms Info Percent of long-stay residents who have depressive symptoms 7.5%
85% better than Illinois average

Illinois average: 48.1%

Antipsychotic Use Info Percent of long-stay residents who received an antipsychotic medication 26.0%
29% worse than Illinois average

Illinois average: 20.2%

Pneumococcal Vaccine Info Percent of long-stay residents assessed and appropriately given the pneumococcal vaccine 99.8%
12% better than Illinois average

Illinois average: 89.2%

Influenza Vaccine Info Percent of long-stay residents assessed and appropriately given the seasonal influenza vaccine 100.0%
9% better than Illinois average

Illinois average: 91.6%

Hospitalizations per 1,000 days Info Number of hospitalizations per 1,000 long-stay resident days. 2.68
31% worse than Illinois average

Illinois average: 2.05

ED visits per 1,000 days Info Number of outpatient emergency department visits per 1,000 long-stay resident days. 1.84
18% better than Illinois average

Illinois average: 2.25

Short-stay resident measures
Significantly below average Illinois avg: 2.0 Info CMS star rating based on short-stay quality measure performance. 5 stars = much above average, 1 star = much below average.
Pneumococcal Vaccine Info Percent of short-stay residents assessed and appropriately given the pneumococcal vaccine 97.8%
43% better than Illinois average

Illinois average: 68.3%

Antipsychotic medication increase Info Percent of short-stay residents who newly received an antipsychotic medication 0.0%
100% better than Illinois average

Illinois average: 2.3%

Influenza Vaccine Info Percent of short-stay residents assessed and appropriately given the seasonal influenza vaccine 95.7%
52% better than Illinois average

Illinois average: 63.0%

Re-hospitalized after SNF stay Info Percentage of short-stay residents who were re-hospitalized after their nursing home admission. 32.0%
22% worse than Illinois average

Illinois average: 26.2%

Emergency department visits Info Percentage of short-stay residents who had an outpatient emergency department visit. 10.9%
22% better than Illinois average

Illinois average: 14.0%

Falls with major injury Info Percentage of SNF residents who experience falls with major injury during their stay. 0.0%
100% better than Illinois average

Illinois average: 0.8%

Ability to care for self at discharge Info Percentage of residents at or above expected ability to care for themselves at discharge. 39.5%
26% worse than Illinois average

Illinois average: 53.7%

Successful return to home or community Info Rate of successful return to home or community from a skilled nursing facility. 40.3%
20% worse than Illinois average

Illinois average: 50.6%

Penalties and fines

Federal penalties imposed by CMS for regulatory violations, including civil money penalties (fines) and denials of payment for new Medicare/Medicaid admissions.

Source: CMS Penalties Database (Data as of Jan 2026)

Total fines amount $10K
93% lower than Illinois average

Illinois average: $143K

Number of fines 1
66% fewer fines than Illinois average

Illinois average: 3.0

Payment Denials Info Serious action where Medicare and/or Medicaid temporarily stops payments for new residents until issues are fixed. 1
6% fewer payment denials than Illinois average

Illinois average: 1.1

Fines amount comparison
This facility $10K
Illinois average $143K
Penalty History

Penalties are imposed by CMS for violations of federal nursing home regulations.

Civil Money Penalty Info Fines imposed for noncompliance, which can be assessed per day or per instance of violation. May 14, 2024
$10K
Payment Denial Info Serious action where Medicare and/or Medicaid temporarily stops payments for new residents until issues are fixed. Mar 7, 2024
21 days

Last updated: Jan 2026

Guides for Better Senior Living

Care Cost Calculator: See Prices in Your Area

Nursing Home Data Explorer

Don’t Wait Too Long: 7 Red Flag Signs Your Parent Needs Assisted Living Now

The True Cost of Assisted Living in 2025 – And How Families Are Paying For It

Understanding Senior Living Costs: Pricing Models, Discounts & Financial Assistance

Financial Aid for Illinois Seniors

Get financial aid guidance

Community Care Program

Illinois CCP

Age 60+, Illinois resident, at risk of nursing home placement.

~$1,215/month (individual).

$17,500 (individual, excludes home, car).

High demand in urban areas; waitlists possible.

Illinois Respite Program

IL Respite (via NFCSP)

Caregiver of someone 60+ (or with dementia), Illinois resident.

No strict limit; prioritizes low-income.

Not applicable.

Limited slots; urban/rural balance.

Supportive Living Program (SLP)

Illinois Medicaid Supportive Living Program

Age 65+ or 22-64 with disability, Illinois resident, Medicaid-eligible, needs moderate assistance (not nursing home-level).

~$2,829/month (300% FBR, individual); QIT allowed.

$2,000 (individual), $3,000 (couple) (excludes home, car).

~200 SLP sites statewide; room/board not covered.

Persons Who Are Elderly Waiver

Illinois Medicaid Elderly Waiver

Age 65+, Illinois resident, Medicaid-eligible, nursing home-level care need.

~$2,829/month (300% FBR, individual).

$2,000 (individual), $3,000 (couple).

Part of HealthChoice Illinois; consumer-directed options available.

Medicare Savings Program (MSP)

Illinois Medicare Savings Program

Age 65+ or disabled, Illinois resident, Medicare Part A/B.

~$2,510/month (QMB), ~$3,380/month (SLMB), ~$3,598/month (QI)—individual.

$9,430 (individual), $14,130 (couple).

Three tiers; no waitlist.

Senior Community Service Employment Program (SCSEP)

Illinois SCSEP

Age 55+, unemployed, low-income, Illinois resident.

~$1,983/month (125% FPL).

Not specified; income-focused.

Priority for veterans, rural residents.

Optional State Supplementation (OSS)

Illinois Optional State Supplementation

Age 65+ or disabled, Illinois resident, in approved facility, SSI recipient or low-income.

~$1,004/month (including SSI).

$2,000 (individual), $3,000 (couple).

~$50-$500/month based on facility type.

VA Aid and Attendance (A&A) and Housebound Benefits

Illinois VA Aid and Attendance/Housebound

Age 65+ or disabled veteran/spouse, Illinois resident, wartime service, need for ADL help (A&A) or homebound.

Net income < ~$1,984/month (veteran with dependent, A&A); pension offsets income.

~$155,356 (net worth limit).

High veteran demand in urban/rural areas.

Tour Icon
Planning a tour? Check our touring checklist.
Chat Icon
Thinking of living here? We can help you speak to a current resident