River Garden Senior Services

Nursing Home in Jacksonville

CMS overall rating Info The Overall CMS Rating is scored from 1 to 5 stars and combines results from health inspections, staffing levels, and quality measures. Health inspections carry the most weight. Staffing and quality scores can increase or decrease the final rating based on performance compared to state and national standards.

Overview of River Garden Senior Services

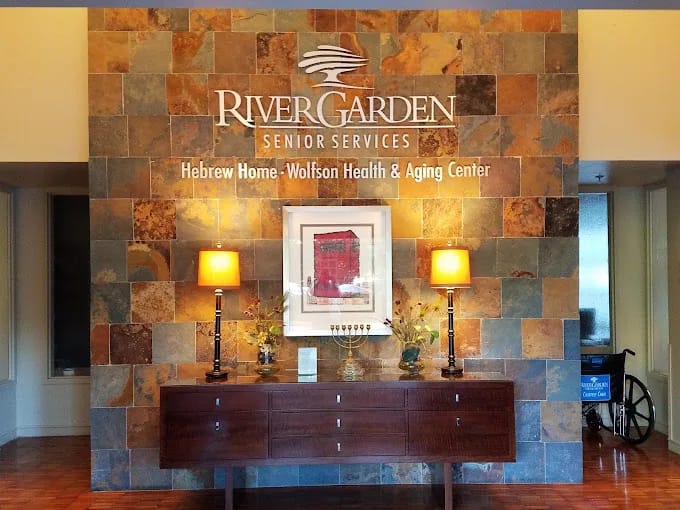
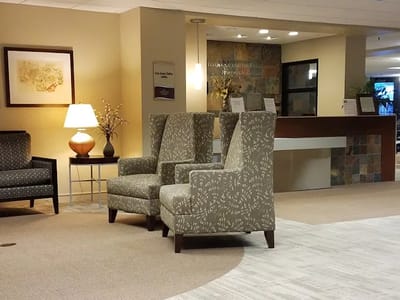
River Garden Senior Services is a highly esteemed Hebrew home that has been serving the community with compassion and excellence since 1946. As a non-profit organization organized by the Jacksonville Jewish community, it takes pride in its top-rated care, providing a wide range of services to support seniors in various stages of their healthcare journey. From short-stay rehabilitation to outpatient therapies, specialized care for Parkinson’s, long-term skilled nursing care, memory care, palliative care, home health care, and independent living, the facility offers a comprehensive and holistic approach to cater to the diverse needs of its residents.
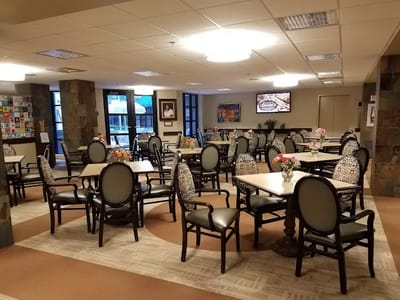
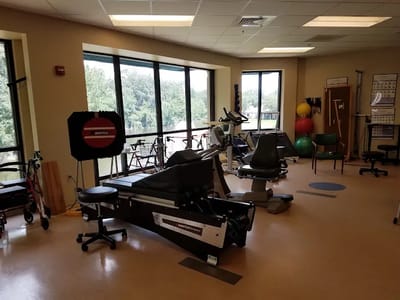
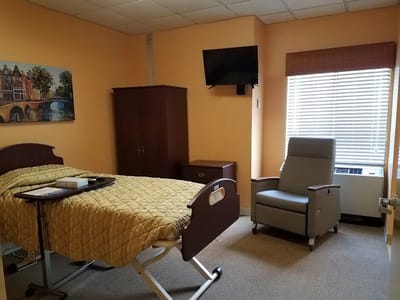
The home spans a lush 40-acre campus. The facility is known for its bright rooms and serene surroundings, providing a calming effect that promotes healing and well-being. Residents can also enjoy a wide range of activities such as zumba classes, arts and crafts, religious services, bingo, and more, as well as state-of-the-art gym equipment to promote physical fitness. River Garden Senior Services is dedicated to being accessible to all, participating in Medicare and Medicaid programs to ensure that quality care is available to those in need. 

(904) 260-1818

Quality ratings

Measured by Centers for Medicare & Medicaid Services (CMS)

Overall rating Info The Overall CMS Rating combines results from health inspections, staffing levels and quality measures. Health inspections carry the most weight. Staffing and quality scores can increase or decrease the final rating based on performance compared to state and national standards.
5/5 ▲ 1.8 Florida average: 3.2/5
Health Inspection Info Based on the results of the facility's three most recent standard inspections and any complaint investigations. CMS reviews the number, scope, and severity of deficiencies, with more recent findings weighted more heavily.
5/5 ▲ 2.2 Florida average: 2.8/5
Staffing Info Measures average nursing staff hours per resident per day, including Registered Nurses (RNs) and total nursing staff. Ratings are adjusted based on the level of care residents require and are compared to state and national benchmarks.
5/5 ▲ 1.6 Florida average: 3.4/5
Quality Measures Info Based on clinical and physical health indicators reported to CMS, such as hospital readmissions, falls, pressure ulcers, and improvements in mobility. These measures reflect how well residents' health needs are being managed.
4/5 ▼ 0.1 Florida average: 4.1/5

Staffing hours breakdown

Info Daily nursing hours per resident by staff type, reported to CMS. Higher is generally better — compare this facility to state and national averages to see where staffing stands.

Hours per resident per day — compared to Florida state averages

Total nursing care / resident Info This home is ranked 19th out of 175 homes in Florida.

Total adjusted nursing hours per resident per day, combining RN, LPN, and aide time. CMS adjusts this for case-mix so facilities can be fairly compared.
5h 27m per day
Rank #19 / 175Nurse hours — state benchmarkedThis home is ranked 19th out of 175 homes in Florida.Shows adjusted nurse hours per resident per day benchmarked to the Florida average, with a ranking across 175 Florida SNFs. More hours mean more direct care. The national average is about 3.5 hrs; below 3.0 is a red flag.
This facility Florida avg (4h 2m per day)
vs Florida avg
+35%

0 of 5 metrics below state avg

Standout metric Nurse Aide is +27% above state avg
Staff typeHours / dayvs state avg
Registered Nurse (RN) Info RNs hold the highest nursing license and can assess residents, interpret test results, and direct care plans. More RN hours per day often signals stronger clinical oversight and faster response to health changes. 55m per day ▲ 25% State avg: 44m per day · National avg: 41m per day
Nurse Aide Info Certified Nurse Aides (CNAs) provide the most direct day-to-day assistance: bathing, dressing, feeding, and mobility. Nurse aide hours are typically the largest staffing category and directly affect residents' quality of life. 2h 58m per day ▲ 27% State avg: 2h 20m per day · National avg: 2h 21m per day
Total Nursing (Weekend) Info Combined nursing hours (RN + LPN + Nurse Aide) per resident per day on weekends. Staffing often drops on weekends — this figure reveals whether the facility maintains adequate coverage outside of weekday hours. 4h 20m per day ▲ 23% State avg: 3h 31m per day · National avg: 3h 26m per day
Physical Therapist Info Hours per resident per day provided by licensed Physical Therapists (PTs) or PT Assistants. PT services help residents recover mobility after injury or illness and are especially important for post-acute (short-stay) rehabilitation. 5m per day ■ Avg State avg: 5m per day · National avg: 4m per day
RN (Weekend) Info Registered nurse hours specifically on weekends. Facilities sometimes reduce RN presence on Saturdays and Sundays — a low weekend RN figure compared to weekday hours can indicate reduced clinical oversight when most administrative staff are absent. 37m per day ▲ 16% State avg: 32m per day · National avg: 29m per day

Capacity and availability

This home usually has limited availability

Occupancy between 85% and 95% suggests balanced demand.

Higher occupancy than the Florida average: 84.3%
Occupancy rate 89.2% Rank #85 / 176Occupancy rate — state benchmarkedThis home is ranked 85th out of 176 homes in Florida.Shows this facility's occupancy rate versus the Florida average, with its statewide rank out of 176. Higher occupancy signals strong local demand and financial stability.
Avg. Length of Stay 69 days
Occupancy rate
89.2% Rank #85 / 176Occupancy rate — state benchmarkedThis home is ranked 85th out of 176 homes in Florida.Shows this facility's occupancy rate versus the Florida average, with its statewide rank out of 176. Higher occupancy signals strong local demand and financial stability.
Avg. Length of Stay
69 days

Who this home usually serves

TYPE OF STAY

Mostly short-term rehab stays

Most residents typically stay for a few weeks or months before returning home or moving on.

Might be optimal for
Short stays Recovery Medicare-covered care

Breakdown by payment type

Medicare

72% of new residents, usually for short-term rehab.

Typical stay 17 days

Private pay

25% of new residents, often for short stays.

Typical stay 2 - 3 months

Medicaid

3% of new residents, often for long-term daily care.

Typical stay 3 years

Finances and operations

Voluntary non-profit community
Home revenue
$35.1M
Operating deficit
-$5.7M
Voluntary non-profit community
Home revenue
$35.1M Rank #5 / 177Revenue — state benchmarkedThis home is ranked 5th out of 177 homes in Florida.Shows this facility's annual revenue compared to the Florida SNF average. Higher revenue generally means more resources for staffing and capital — read alongside Payroll %.
Operating deficit
-$5.7M
Payroll costs Info The portion of the home's budget spent on staff, including nurses, caregivers, and other employees who support care and operations. Rank #18 / 177Payroll — state benchmarkedThis home is ranked 18th out of 177 homes in Florida.Shows total annual staff payroll benchmarked to the Florida average. Higher payroll investment relative to peers often signals better staffing and less reliance on cheaper contract labor.
$13.7M
39% of revenue Rank #89 / 177Payroll % — state benchmarkedThis home is ranked 89th out of 177 homes in Florida.Shows payroll as a percentage of revenue versus the Florida average. Well-run SNFs often land around 55–65%. Below 25% may signal understaffing or heavy agency use — read with Staffing ratings.
Other operating costs Info All remaining costs needed to run the home, such as food, utilities, building maintenance, supplies and administrative expenses.
$27.1M
Total costs $40.8M
Walk Score
Walk Score: 13 / 100 Rank #122 / 147Walk Score — state benchmarkedThis home is ranked 122nd out of 147 homes in Florida.Shows how walkable this facility's neighborhood is compared to the average Walk Score across Florida SNFs. Higher scores benefit residents, families, and staff.
Car-dependent. Most errands require a car, with limited nearby walkable options.

Contact River Garden Senior Services

Health Inspection History

Inspections
Total health inspections 1

Florida average 4.3


Last Health inspection on Apr 2021

Total health citations
2 Rank #2 / 177Health citations — state benchmarkedThis home is ranked 2nd out of 177 homes in Florida.Shows this facility's total health deficiency citations benchmarked to the Florida state average, with a ranking across all 177 FL SNFs. Lower citation counts earn a better rank.

Florida average 19.7

Citations per inspection
2

Florida average 4.48


Health citations are formal notices following inspections when they fail to comply with safety and care standards.

All 2 citations resulted from standard inspections.

Breakdown of citation severity (last 3 years)
Critical Health citations More info
0
100% better than Florida average

Florida average: 0.8


Serious Health citations More info 0
100% better than Florida average

Florida average: 0.4

0 critical citations More info Florida average: 0.8

0 serious citations More info Florida average: 0.4

2 moderate citations More info Florida average: 18.4

0 minor citations More info Florida average: 0.2
Citations history (last 3 years)
Nutrition moderate citation Info Issues related to food quality, meal service, and resident's nutritional needs. Apr 29, 2021
Corrected

Quality of Care moderate citation Info Issues related to how well residents receive appropriate treatment and support for their medical and daily care needs. Apr 29, 2021
Corrected

Compare Nursing Homes around Jacksonville The information below is reported by the Florida Agency for Health Care Administration (AHCA).

5 facilities compared · CMS & FL Dept. of Health data · Updated Apr 2026

Filter by care type
River Garden Senior Services
NH

Nursing Home Licensed facility providing 24/7 skilled nursing care for residents with complex, ongoing medical needs. Staffed by RNs, LPNs, and CNAs. Inspected and star-rated annually by CMS. Accepts Medicare (short-term rehab) and Medicaid (long-term care).

AL

Assisted Living A licensed, long-term care setting for seniors or individuals with disabilities who need help with daily activities — like bathing, dressing, and medication management — but not 24-hour skilled nursing. Offers housing, meals, and around-the-clock support while aiming to maximize resident independence.

Jacksonville (Del Rio)180 89.2% +6%5.45 +30%+35%022.00159- 13 River Garden Hebrew Home For The Aged$35.1M$13.7M39%105016
Fountains Rehabilitation at Mill Cove
NH

Nursing Home Licensed facility providing 24/7 skilled nursing care for residents with complex, ongoing medical needs. Staffed by RNs, LPNs, and CNAs. Inspected and star-rated annually by CMS. Accepts Medicare (short-term rehab) and Medicaid (long-term care).

AL

Assisted Living A licensed, long-term care setting for seniors or individuals with disabilities who need help with daily activities — like bathing, dressing, and medication management — but not 24-hour skilled nursing. Offers housing, meals, and around-the-clock support while aiming to maximize resident independence.

IL

Independent Living Lifestyle-focused communities for older adults offering dining, activities, and transportation with minimal personal care. Best for active, independent seniors who want community without medical support.

MC

Memory Care Secured, specialized care for people living with Alzheimer's or dementia. Staff trained in cognitive impairment, with higher staff-to-resident ratios and an environment designed to reduce confusion and wandering risk.

Jacksonville (Regency)221 95.5% +13%3.81 -30%-6%082.7077A- 44 Atrium Snf Holdings Llc$21.1M$9.0M42.6%105927
Cathedral Care
NH

Nursing Home Licensed facility providing 24/7 skilled nursing care for residents with complex, ongoing medical needs. Staffed by RNs, LPNs, and CNAs. Inspected and star-rated annually by CMS. Accepts Medicare (short-term rehab) and Medicaid (long-term care).

AL

Assisted Living A licensed, long-term care setting for seniors or individuals with disabilities who need help with daily activities — like bathing, dressing, and medication management — but not 24-hour skilled nursing. Offers housing, meals, and around-the-clock support while aiming to maximize resident independence.

Jacksonville (Downtown)120 63.8% -24%3.75 -1%-7%0164.00103- 88 Ashley Street Snf Intermediary Holdings Llc$2.3M$1.3M56.6%105834
Signature HealthCARE of Jacksonville
NH

Nursing Home Licensed facility providing 24/7 skilled nursing care for residents with complex, ongoing medical needs. Staffed by RNs, LPNs, and CNAs. Inspected and star-rated annually by CMS. Accepts Medicare (short-term rehab) and Medicaid (long-term care).

AL

Assisted Living A licensed, long-term care setting for seniors or individuals with disabilities who need help with daily activities — like bathing, dressing, and medication management — but not 24-hour skilled nursing. Offers housing, meals, and around-the-clock support while aiming to maximize resident independence.

Jacksonville (Southwest)180 72.6% -14%4.31 -6%+7%1123.04172- 55 Jacksonville Rehabilitation And Nursing Member Llc$15.4M$6.4M41.5%105287
Bartram Crossing Skilled Nursing – Brooks Rehabilitation -
NH

Nursing Home Licensed facility providing 24/7 skilled nursing care for residents with complex, ongoing medical needs. Staffed by RNs, LPNs, and CNAs. Inspected and star-rated annually by CMS. Accepts Medicare (short-term rehab) and Medicaid (long-term care).

AL

Assisted Living A licensed, long-term care setting for seniors or individuals with disabilities who need help with daily activities — like bathing, dressing, and medication management — but not 24-hour skilled nursing. Offers housing, meals, and around-the-clock support while aiming to maximize resident independence.

Jacksonville (Southside)---------000.00-- 21 -----

Financial Assistance for
Nursing Home in Florida

Get Financial aid guidance

Long-Term Care Waiver

Florida Medicaid LTC Waiver

Age 65+ or 21+ disabled
General Florida resident, Medicaid- eligible, nursing home-level care need.
Income Limits (2025) ~$2,829/month 300% FBR, individual
Asset Limits $2,000 (individual), $3,000 (couple).
FL

High demand; waitlists common.

Benefits
In-home care (6-8 hours/day) Assisted living Respite (240 hours/year) Case management

Community Care for the Elderly (CCE)

Florida CCE

Age 60+
General Florida resident, at risk of nursing home.
Income Limits ~$2,000/month varies
Asset Limits $5,000 individual
FL

Limited funding; regional variation.

Benefits
Homemaker services (3-5 hours/week) Adult day care (~$60/day) Respite (up to 10 days/year)

Home Care for the Elderly (HCE)

Florida Home Care for the Elderly

Age 60+
General Florida resident, at risk of nursing home placement; caregiver must be approved.
Income Limits (2025) ~$2,829/month individual, aligned with Medicaid thresholds
Asset Limits ~$2,000 (individual); varies by case manager discretion.
FL

Limited funding (~3,500 served annually); prioritizes low-income frail seniors.

Benefits
Basic subsidy (~$160/month) for housing/medical costs; special subsidies for supplies/services (e.g., incontinence supplies, ~$50-$200/month)

Program of All-Inclusive Care for the Elderly (PACE)

Florida Medicaid PACE

Age 55+
General Florida resident, nursing home-level care need, safe with PACE support.
Income Limits (2025) ~$2,829/month 300% FBR
Asset Limits $2,000 (individual), $3,000 (couple).
FL

Limited to specific counties (e.g., Hillsborough, Miami-Dade); ~10 sites statewide.

Benefits
Personal care (5-7 hours/day) Medical care Meals Transportation Therapy

Optional State Supplementation (OSS)

Florida Optional State Supplementation

Age 65+ or disabled
General Florida resident, living in approved facility, receiving SSI or low-income.
Income Limits (2025) ~$1,004/month individual, including SSI
Asset Limits $2,000 (individual), $3,000 (couple).
FL

Limited to specific facility types; ~$78.40/month max supplement.

Benefits
Cash payment (~$78.40/month) for room/board or personal needs in facilities

Senior Community Service Employment Program (SCSEP)

Florida SCSEP (federally funded, state-administered)

Age 55+
General unemployed, low-income, Florida resident.
Income Limits (2025) ~$1,983/month 125% FPL, individual
Asset Limits Not specified; income-focused.
FL

Priority for veterans, rural residents; ~1,000 slots/year.

Benefits
Paid training (~20 hours/week at ~$7.25/hour) Job placement

Places of interest near River Garden Senior Services

Address 13.9 miles from city center Info Estimated distance in miles from Jacksonville's city center to River Garden Senior Services's address, calculated via Google Maps. — 1.71 miles to nearest hospital (Fresh Heads Lice Removal - Jacksonville)

Calculate Travel Distance to River Garden Senior Services

Add your location

Address

Staffing Data (Q2 2025)

This data corresponds to Q2 2025 and is based on CMS Payroll-Based Journal.

Total staff 267
Employees 201
Contractors 66
Staff to resident ratio 1.57:1
0% compared with Florida average

Florida average ratio: 1.52:1

Avg staff/day 121
Average shift 7.6 hours
0% compared with Florida average

Florida average: 7.9 hours

Total staff hours (quarter) 83,557
Nursing staff breakdown
Registered Nurse

Manages medical care and health needs.

Total count 41
Average shift length Info Average shift length. Calculated as total hours divided by days worked and average staff per day. 7.6 hours

This role is partially covered by contractors.

Licensed Practical Nurse

Assists with medical care and medications.

Total count 48
Average shift length Info Average shift length. Calculated as total hours divided by days worked and average staff per day. 7.8 hours

This role is partially covered by contractors.

Certified Nursing Assistant

Helps with daily care and mobility.

Total count 120
Average shift length Info Average shift length. Calculated as total hours divided by days worked and average staff per day. 7.7 hours

This role is partially covered by contractors.

Contractor staffing

Total hours from contractors

11.8%

9,824 contractor hours this quarter

Licensed Practical Nurse: 21 Registered Nurse: 11 Respiratory Therapy Technician: 9 Physical Therapy Aide: 7 Physical Therapy Assistant: 5 Speech Language Pathologist: 5 Therapeutic Recreation Specialist: 2 Qualified Social Worker: 2 Certified Nursing Assistant: 1 Feeding Assistant: 1 Medical Director: 1 Other Physician: 1
Staff by category
Certified Nursing Assistant119112043,77491100%7.7
Registered Nurse30114112,81091100%7.6
Licensed Practical Nurse27214811,17991100%7.8
Mental Health Service Worker9092,0447380%7.9
Clinical Nurse Specialist5051,8276774%8
Physical Therapy Assistant0551,7158088%7.1
Other Dietary Services Staff3031,3068088%7.9
Speech Language Pathologist0551,2288290%6
Respiratory Therapy Technician0991,06691100%6.2
Physical Therapy Aide0771,0368391%6.9
Occupational Therapy Aide2029926571%8
Therapeutic Recreation Specialist0228776976%7.6
RN Director of Nursing2026796369%7
Dental Services Staff1015206571%8
Administrator1014725965%8
Qualified Social Worker0224646369%6.8
Dietitian1014645864%8
Nurse Practitioner1014565763%8
Other Physician0113785459%7
Feeding Assistant0112162730%8
Medical Director011545459%1
120 Certified Nursing Assistant
% of Days 100%
41 Registered Nurse
% of Days 100%
48 Licensed Practical Nurse
% of Days 100%
9 Mental Health Service Worker
% of Days 80%
5 Clinical Nurse Specialist
% of Days 74%
5 Physical Therapy Assistant
% of Days 88%
3 Other Dietary Services Staff
% of Days 88%
5 Speech Language Pathologist
% of Days 90%
9 Respiratory Therapy Technician
% of Days 100%
7 Physical Therapy Aide
% of Days 91%
2 Occupational Therapy Aide
% of Days 71%
2 Therapeutic Recreation Specialist
% of Days 76%
2 RN Director of Nursing
% of Days 69%
1 Dental Services Staff
% of Days 71%
1 Administrator
% of Days 65%
2 Qualified Social Worker
% of Days 69%
1 Dietitian
% of Days 64%
1 Nurse Practitioner
% of Days 63%
1 Other Physician
% of Days 59%
1 Feeding Assistant
% of Days 30%
1 Medical Director
% of Days 59%

Facility Characteristics

Source: CMS Long-Term Care Facility Characteristics (Data as of Jan 2026)

Total residents 170
Medicare
43
25.3% of residents
Medicaid
79
46.5% of residents
Private pay or other
48
28.2% of residents
Programs & Services
Residents Group

Residents meet regularly to discuss policies, care quality, and activities

Family Member Group

Family members meet regularly to discuss policies, care quality, and activities

Active Family Council

Organized group of family members that meets regularly to discuss facility policies, resident care, and activities.

Active Resident Council

Organized group of residents that meets regularly to discuss facility policies, quality of life, and activities.

Quality of care over time

These measures show how residents usually do over time at this home, based on health outcomes and preventive care.

High-risk clinical events score Info A composite score based on pressure ulcers, falls with injury, weight loss, walking ability decline, and activities of daily living decline. 7.8
In line with Florida average

Florida average: 7.4

Functional decline score Info A composite score based on activities of daily living decline, walking ability decline, and incontinence. 11.3
9% better than Florida average

Florida average: 12.4

Long-stay resident measures
Significantly above average Florida avg: 4.6 Info CMS star rating based on long-stay quality measure performance. 5 stars = significantly above average, 1 star = significantly below average.
Need for Help with Daily Activities Increased Info Percent of long-stay residents whose need for help with daily activities has increased 14.3%
36% worse than Florida average

Florida average: 10.5%

Walking Ability Worsened Info Percent of long-stay residents whose ability to move independently worsened 13.2%
In line with Florida average

Florida average: 12.9%

Low Risk Residents with Bowel/Bladder Incontinence Info Percent of low risk long-stay residents who lose control of their bowels or bladder 6.4%
53% better than Florida average

Florida average: 13.5%

Falls with Major Injury Info Percent of long-stay residents experiencing one or more falls with major injury 4.8%
83% worse than Florida average

Florida average: 2.6%

High Risk Residents with Pressure Ulcers Info Percent of long-stay high risk residents with pressure ulcers 3.6%
33% better than Florida average

Florida average: 5.4%

Urinary Tract Infection Info Percent of long-stay residents with a urinary tract infection 0.4%
54% better than Florida average

Florida average: 0.9%

Lost Too Much Weight Info Percent of long-stay residents who lose too much weight 3.0%
50% better than Florida average

Florida average: 6.0%

Depressive Symptoms Info Percent of long-stay residents who have depressive symptoms 1.5%
55% better than Florida average

Florida average: 3.3%

Antipsychotic Use Info Percent of long-stay residents who received an antipsychotic medication 18.3%
128% worse than Florida average

Florida average: 8.0%

Pneumococcal Vaccine Info Percent of long-stay residents assessed and appropriately given the pneumococcal vaccine 98.7%
In line with Florida average

Florida average: 97.7%

Influenza Vaccine Info Percent of long-stay residents assessed and appropriately given the seasonal influenza vaccine 100.0%
In line with Florida average

Florida average: 99.2%

Hospitalizations per 1,000 days Info Number of hospitalizations per 1,000 long-stay resident days. 2.09
In line with Florida average

Florida average: 2.10

ED visits per 1,000 days Info Number of outpatient emergency department visits per 1,000 long-stay resident days. 0.78
34% better than Florida average

Florida average: 1.18

Short-stay resident measures
Average Florida avg: 2.9 Info CMS star rating based on short-stay quality measure performance. 5 stars = much above average, 1 star = much below average.
Pneumococcal Vaccine Info Percent of short-stay residents assessed and appropriately given the pneumococcal vaccine 90.7%
In line with Florida average

Florida average: 94.0%

Antipsychotic medication increase Info Percent of short-stay residents who newly received an antipsychotic medication 0.5%
69% better than Florida average

Florida average: 1.5%

Influenza Vaccine Info Percent of short-stay residents assessed and appropriately given the seasonal influenza vaccine 100.0%
6% better than Florida average

Florida average: 94.7%

Re-hospitalized after SNF stay Info Percentage of short-stay residents who were re-hospitalized after their nursing home admission. 29.9%
14% worse than Florida average

Florida average: 26.2%

Emergency department visits Info Percentage of short-stay residents who had an outpatient emergency department visit. 11.2%
20% worse than Florida average

Florida average: 9.3%

Falls with major injury Info Percentage of SNF residents who experience falls with major injury during their stay. 0.2%
75% better than Florida average

Florida average: 0.8%

Ability to care for self at discharge Info Percentage of residents at or above expected ability to care for themselves at discharge. 42.2%
21% worse than Florida average

Florida average: 53.7%

Successful return to home or community Info Rate of successful return to home or community from a skilled nursing facility. 59.4%
18% better than Florida average

Florida average: 50.6%

Guides for Better Senior Living

Care Cost Calculator: See Prices in Your Area

Nursing Home Data Explorer

Don’t Wait Too Long: 7 Red Flag Signs Your Parent Needs Assisted Living Now

The True Cost of Assisted Living in 2025 – And How Families Are Paying For It

Understanding Senior Living Costs: Pricing Models, Discounts & Financial Assistance

Tour Icon
Planning a tour? Check our touring checklist.
Chat Icon
Thinking of living here? We can help you speak to a current resident
Explore Open Rooms
1 Contact details
2 What type of senior care service are you looking for?
3 What budget do you have in mind for senior care?
4 How soon do you need to find care?
5 Additional details

Thank you for your interest!

Our team will be in touch shortly to help with next steps.