Explore Open Rooms

1 Contact details
2 What type of senior care service are you looking for?
3 What budget do you have in mind for senior care?
4 How soon do you need to find care?
5 Additional details

Thank you for your interest!

Our team will be in touch shortly to help with next steps.

Nursing Home

Riverside Health and Rehab

Nursing Home

Riverside Health and Rehab

2375 Baker Hospital Blvd, North Charleston, SC 29405 View map
Overview of Riverside Health and Rehab

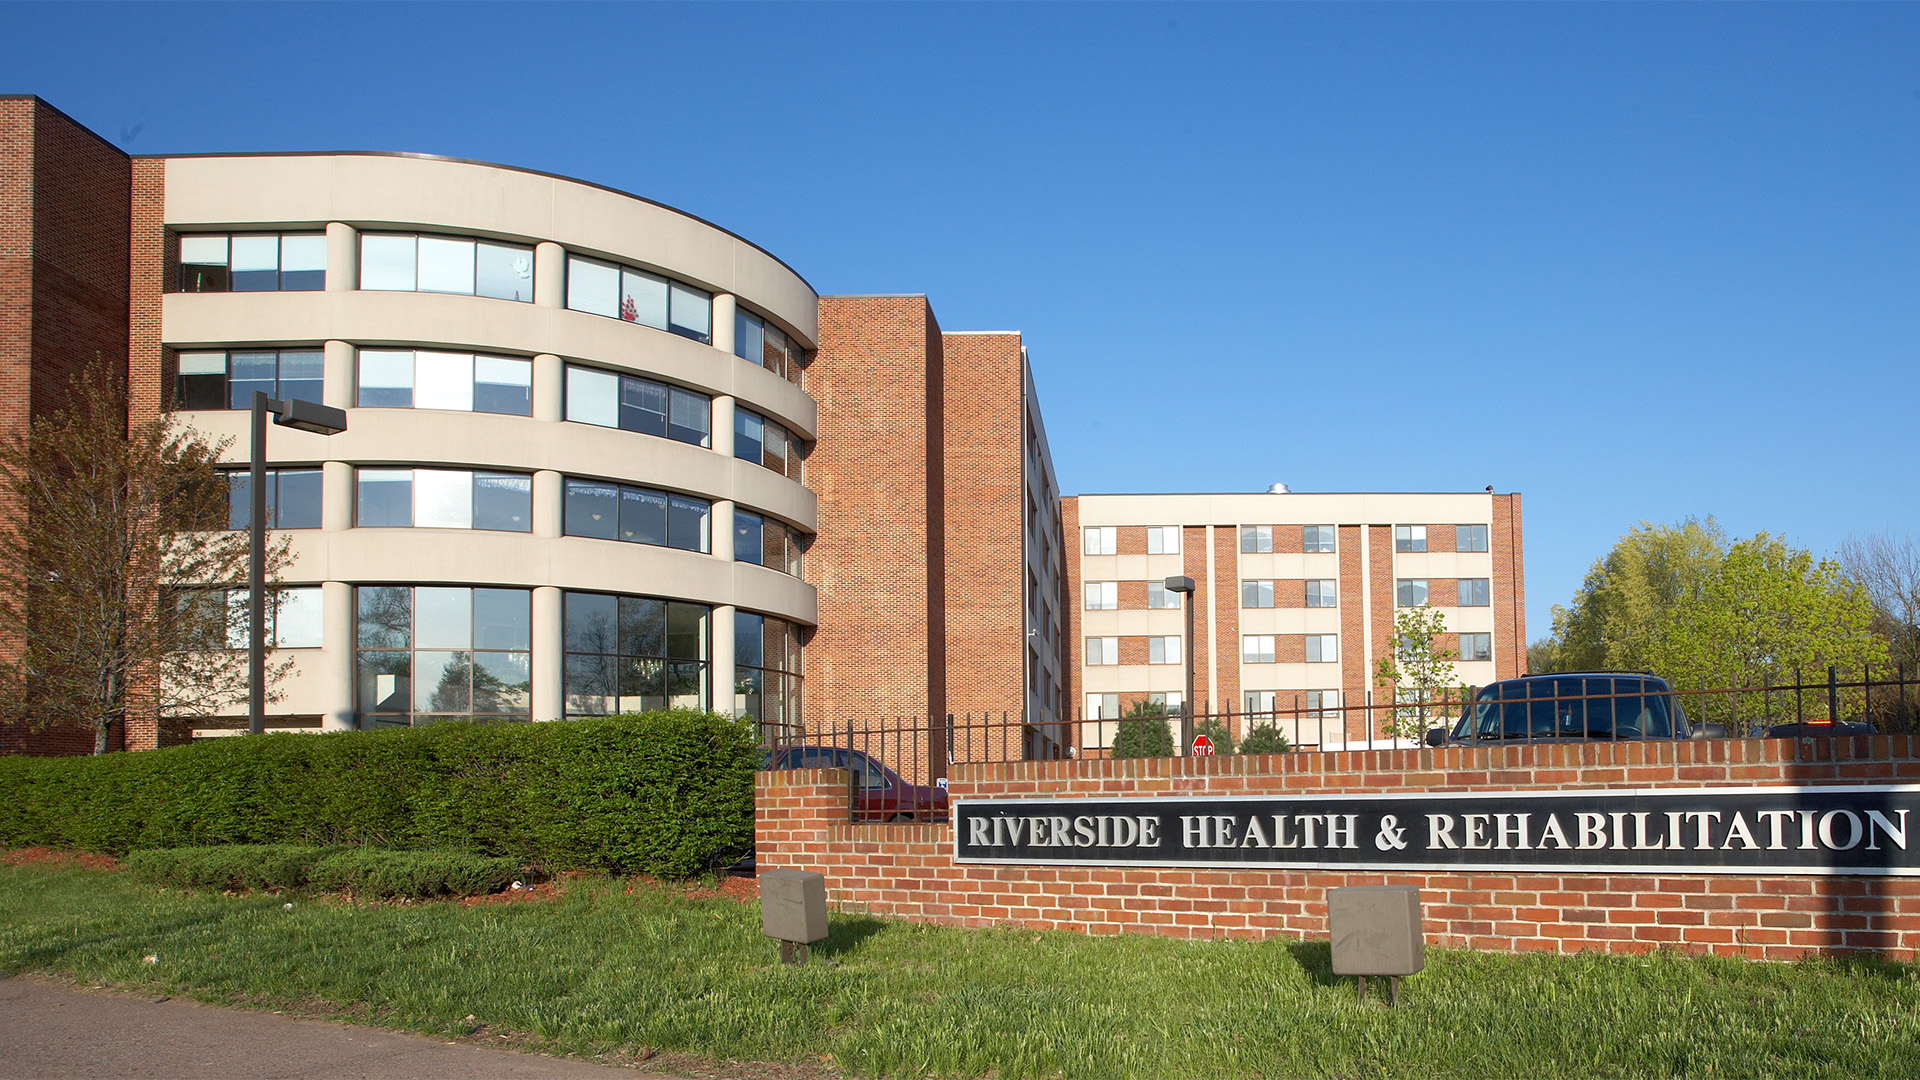
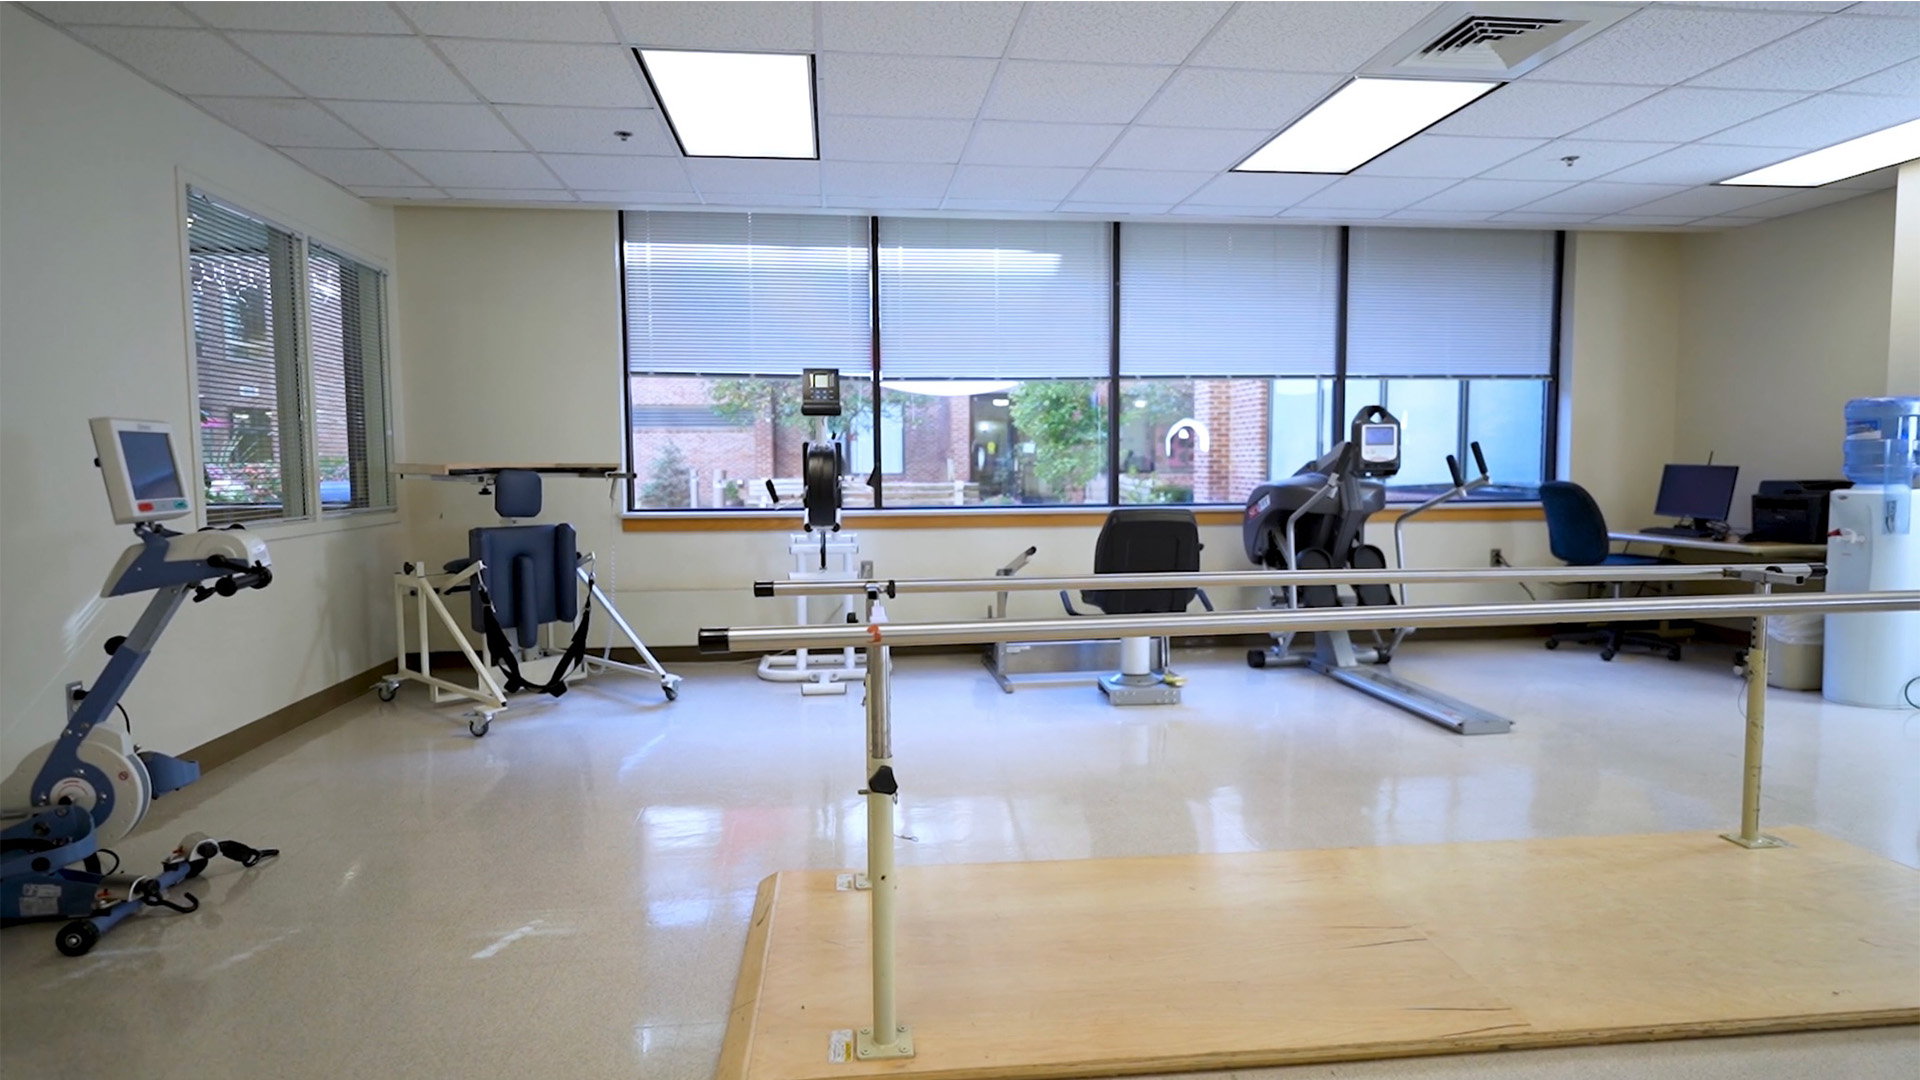
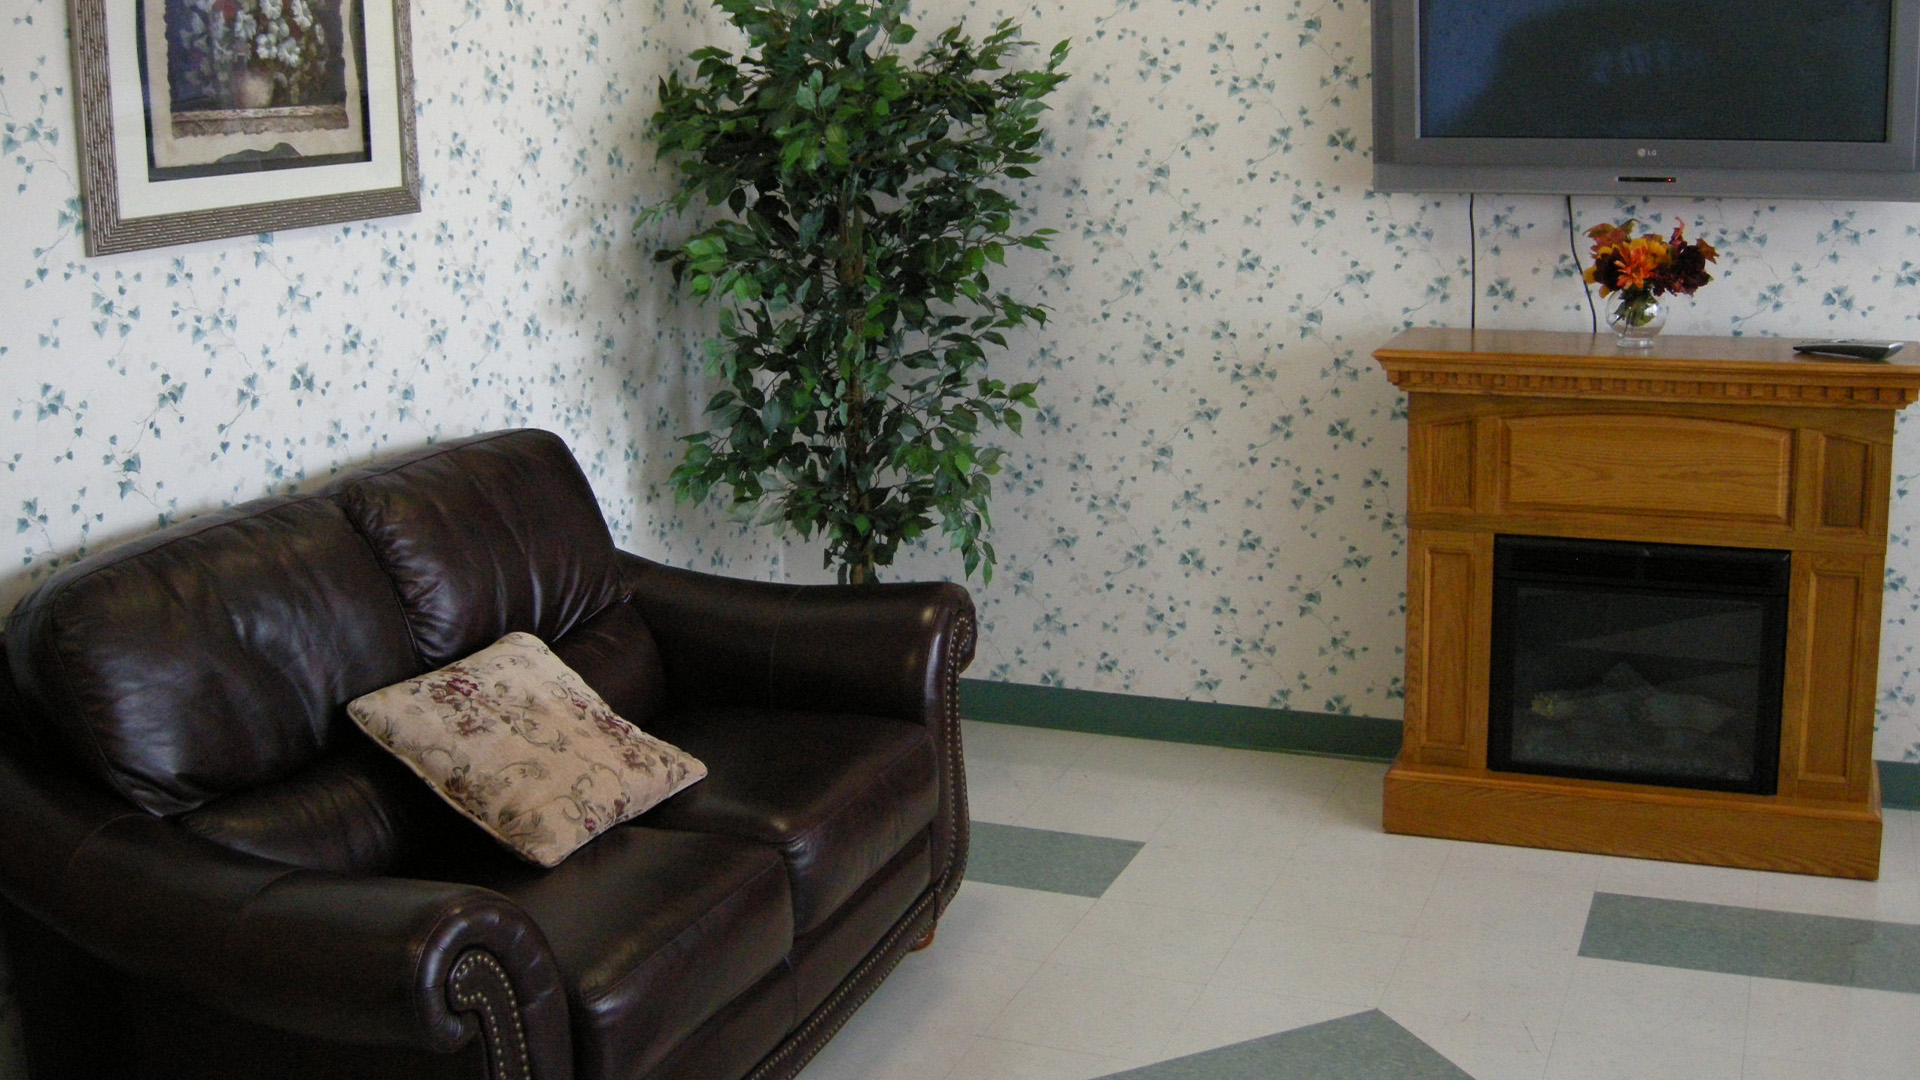
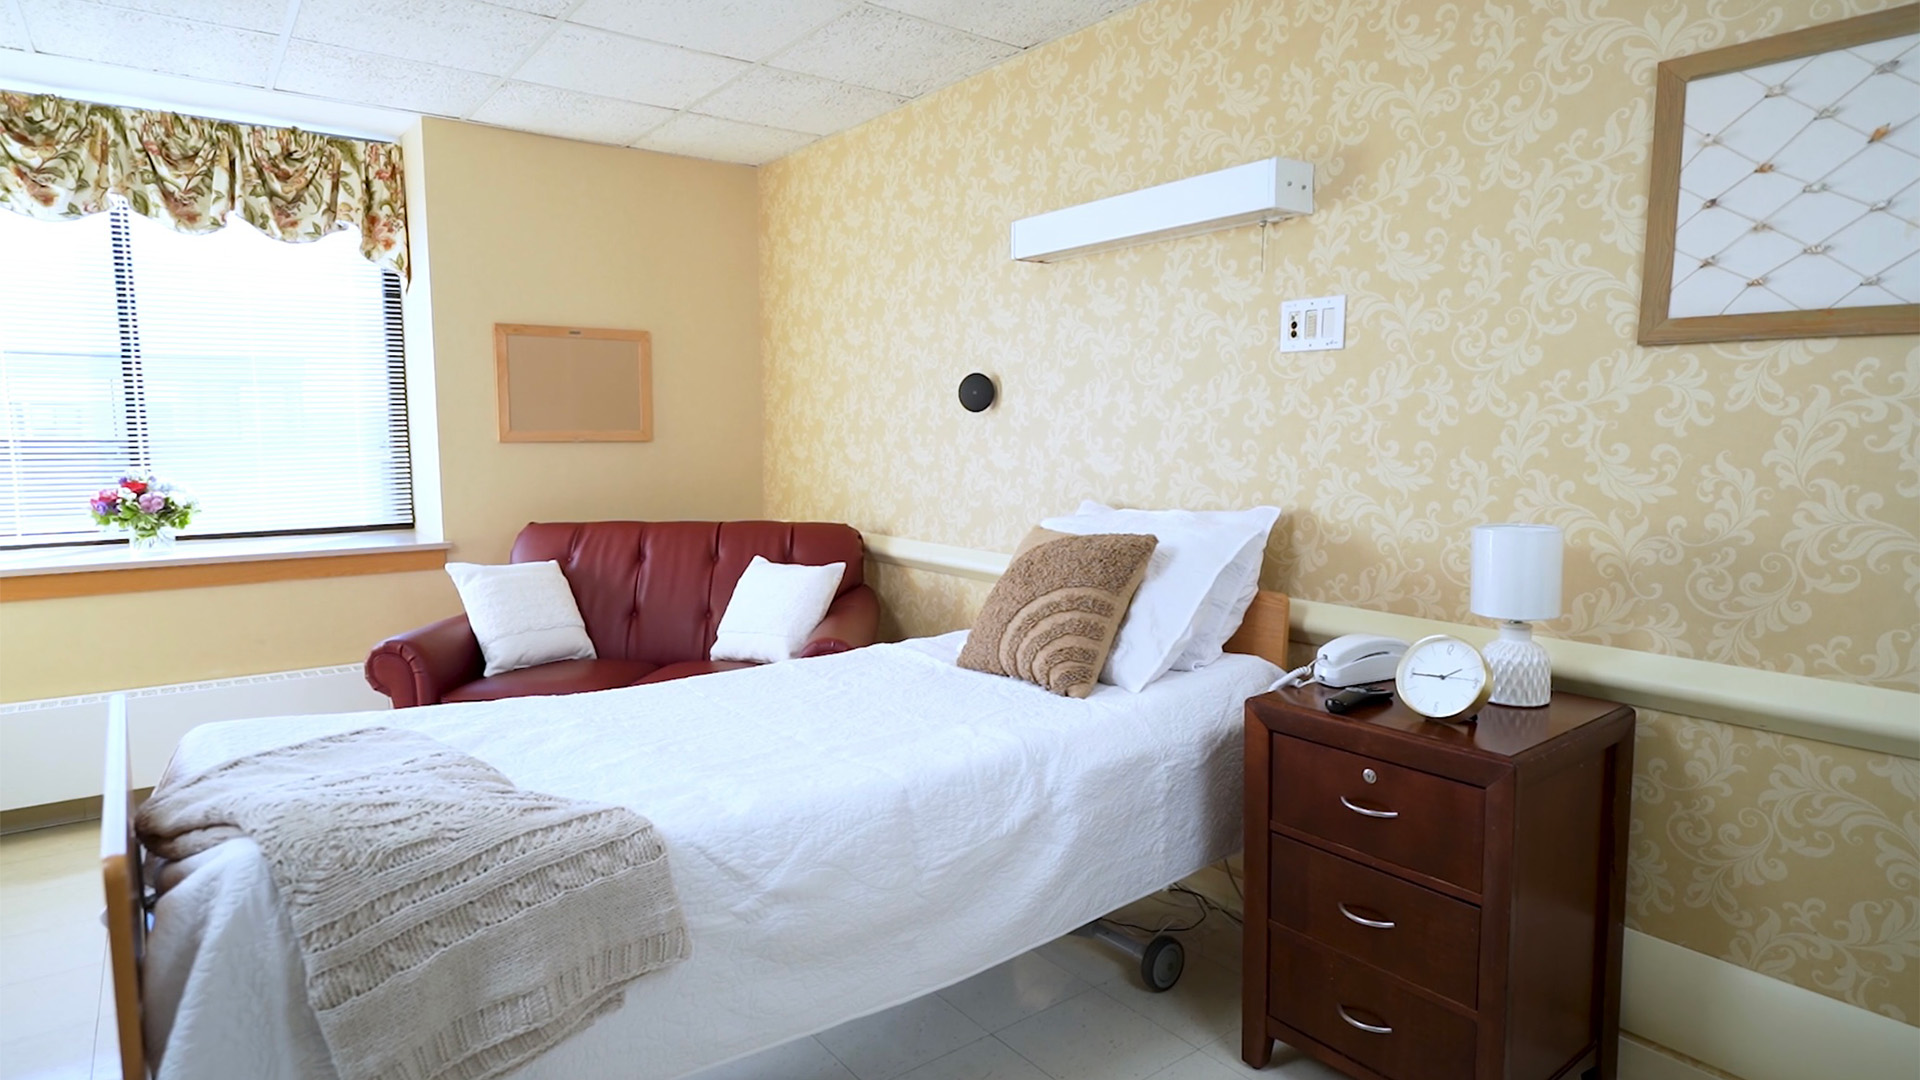
As a reputable 160-bed skilled nursing facility, Riverside Health and Rehab offers specialized care alongside a broad spectrum of services, including short-term rehabilitation, skilled nursing care, long-term care, hospice care, and respite care. It has a central location in Charleston, South Carolina, provides effortless access to Charleston’s renowned hospitals, and is known for its state-of-the-art CardioPulmonary Pavilion. Complementing this specialty unit, Riverside offers an extensive range of therapies, encompassing Respiratory Therapy, Physical Therapy, Speech Therapy, and Occupational Therapy.

This community extends its care to diverse patient profiles, catering to short- and long-term care requirements. Within Riverside’s comprehensive programs, residents benefit from a holistic approach to well-being, featuring exercise regimens, lifestyle education, recreational therapy, informative materials, and personalized nutrition counseling. Guided by constant communication with attending physicians, these programs are meticulously crafted to deliver individualized plans of care that precisely align with each resident’s unique needs. The dedicated Cardio Pulmonary Pavilion focuses on providing tailored care to individuals who have recently encountered cardiac or pulmonary events.

Quality ratings

Measured by Centers for Medicare & Medicaid Services (CMS)

Overall rating Info The Overall CMS Rating combines results from health inspections, staffing levels and quality measures. Health inspections carry the most weight. Staffing and quality scores can increase or decrease the final rating based on performance compared to state and national standards.
1/5
South Carolina average: 2.9/5
Health Inspection Info Based on the results of the facility's three most recent standard inspections and any complaint investigations. CMS reviews the number, scope, and severity of deficiencies, with more recent findings weighted more heavily.
1/5
South Carolina average: 2.7/5
Staffing Info Measures average nursing staff hours per resident per day, including Registered Nurses (RNs) and total nursing staff. Ratings are adjusted based on the level of care residents require and are compared to state and national benchmarks.
1/5
South Carolina average: 3.0/5
Quality Measures Info Based on clinical and physical health indicators reported to CMS, such as hospital readmissions, falls, pressure ulcers, and improvements in mobility. These measures reflect how well residents' health needs are being managed.
2/5
South Carolina average: 3.5/5

Nursing care per resident

Info This shows how many total hours of nursing staff time are available per resident each day. Higher numbers usually mean more staff support.
2h 31m per day

This home provides 38% less nursing time per resident than the South Carolina average.

South Carolina average: 4h 5m per day

Staffing hours breakdown

Info Hours of care per resident per day, broken down by staff type. Data from CMS Medicare.
Staff type Facility State avg National avg
Registered Nurse (RN) Info Registered nurse hours per resident per day. 21m per day 38m per day 41m per day
Nurse Aide Info Nurse aide hours per resident per day. 1h 35m per day 2h 13m per day 2h 21m per day
Total Nursing (Weekend) Info Total number of nurse staff hours per resident per day on weekends. 2h 35m per day 3h 20m per day 3h 26m per day
Physical Therapist Info Physical therapist staff hours per resident per day. 2m per day 5m per day 4m per day
RN (Weekend) Info Registered nurse hours per resident per day on weekends. 18m per day 24m per day 29m per day

Capacity and availability

Medium-capacity home

Offers a balance of services and community atmosphere.

Total beds 160

This home usually has limited availability

Occupancy is moderate, suggesting balanced demand.

Similar demand to the South Carolina average
Occupancy rate 91.9%
Residents per day (avg) 147
Occupancy rate
91.9%
Residents per day (avg)
147

Who this home usually serves

TYPE OF STAY

Primarily short stays

Residents typically stay for brief periods, with frequent admissions and discharges throughout the year.

Might be optimal for
Post-acute recovery Temporary care Transitional stays

Breakdown by payment type

Medicare

19% of new residents, usually for short-term rehab.

Typical stay 2 - 3 months

Private pay

67% of new residents, often for short stays.

Typical stay 1 - 2 months

Medicaid

15% of new residents, often for long-term daily care.

Typical stay 3 - 4 years

Finances and operations

Privately-owned community
Home revenue
$19.0M
Profit
$808.0K
Privately-owned community
Home revenue
$19,001,511.00
Profit
$808,006.00
Payroll costs Info The portion of the home's budget spent on staff, including nurses, caregivers, and other employees who support care and operations.
$6.5M
34.1% of revenue
Other operating costs Info All remaining costs needed to run the home, such as food, utilities, building maintenance, supplies and administrative expenses.
$11.7M
Total costs $18.2M
Bed community size
160-bed community
A large-scale community that may provide a wide range of amenities, services, and structured programs.
Walk Score
Walk Score: 24 / 100
Car-dependent. Most errands require a car, with limited nearby walkable options.

About this community

Occupancy

Occupancy rate
92%
In line with South Carolina average
Occupied beds
147 / 160
Average residents 90 per day

License details

Facility type
Nursing Homes
Status Active
Expiration August 31, 2026
County: Charleston

Additional licensing details

License number: NCF-0870
CMS Certification Number: 425082

Ownership & operating entity

Riverside Health and Rehab is legally operated by THI OF SOUTH CAROLINA AT CHARLESTON LLC, and administrated by OEHLER, JOHN FRITZ.

Ownership type: Ltd. Liability

Type Of Units

Nursing Home
160 units
Total beds
160 units

Care Services

Offers Alzheimer's Care
Dedicated Alzheimer's Unit
Nursing Services
Rehabilitation Services
Skilled Nursing
Licensed Nurses/CNAs
24-Hour Staffing

Contact Information

Programs & Activities

Activities
Visiting hours are recommended from 8:00 a.m. until 9:00 p.m.
Specific Programs
24-hour nursing care, Skilled nursing care, Rehabilitation Care, Long-Term Care, Wound Care, IV Therapy, Physical Therapy, Occupational Therapy, Speech/Language Therapy, Hospice care, Restorative Care, Medicare/Insurance Case Management, Social Work/Discharge Planning
Operating Hours
Planned admissions are accepted 24 hours a day, 7 days a week, including holidays.

Types of Care at Riverside Health and Rehab

Skilled Nursing Hospice Care Respite Care
Contact Riverside Health and Rehab

Inspection History

In South Carolina, the Department of Public Health, Bureau of Healthcare Quality conducts unannounced inspections to ensure care providers meet all health and safety codes.

6 visits/inspections

3 visits/inspections triggered by complaints

1 routine inspections

Results

6 with issues

0 without issues

Latest inspection

Date:April 15, 2025
Type:Routine

29 deficiencies

Deficiencies indicate regulatory issues. A higher number implies the facility had several areas requiring improvement.

Health Inspection History

Inspections
Total health inspections 6

South Carolina average 3.9


Last Health inspection on Apr 2025

Total health citations 29

South Carolina average 13.7

Citations per inspection
4.83

South Carolina average 3.44


Health citations are formal notices following inspections when they fail to comply with safety and care standards.

21 of 29 citations resulted from standard inspections; and 8 of 29 resulted from complaint investigations.

Breakdown of citation severity (last 3 years)
Critical Health citations More info 3
200% worse than South Carolina average

South Carolina average: 1


Serious Health citations More info 0
100% better than South Carolina average

South Carolina average: 0.3

3 critical citations More info South Carolina average: 1

0 serious citations More info South Carolina average: 0.3

25 moderate citations More info South Carolina average: 12.3

1 minor citation More info South Carolina average: 0.1
Citations history (last 3 years)
Infection Control moderate citation Info Issues related to preventing and controlling infections, including hygiene practices and safety protocols. Apr 15, 2025
Corrected

Nursing Services minor citation Info Issues related to the availability and quality of nursing staff and the care they provide. Apr 15, 2025
Corrected

Nutrition moderate citation Info Issues related to food quality, meal service, and resident's nutritional needs. Apr 15, 2025
Corrected

Nutrition moderate citation Info Issues related to food quality, meal service, and resident's nutritional needs. Apr 15, 2025
Corrected

Compare Nursing Homes around North Charleston The information below is reported by the South Carolina Department of Public Health, Bureau of Healthcare Quality.

2 facilities compared · CMS & SC Dept. of Health data · Updated Mar 2026

Life Care Center of Charleston
NH

Nursing Home Licensed facility providing 24/7 skilled nursing care for residents with complex, ongoing medical needs. Staffed by RNs, LPNs, and CNAs. Inspected and star-rated annually by CMS. Accepts Medicare (short-term rehab) and Medicaid (long-term care).

AL

Assisted Living A licensed, long-term care setting for seniors or individuals with disabilities who need help with daily activities — like bathing, dressing, and medication management — but not 24-hour skilled nursing. Offers housing, meals, and around-the-clock support while aiming to maximize resident independence.

N

Nursing

North Charleston
148
74.0%
-10%
3.42
-21%
-14%
2
9
2
112
A+
27
Cliett, Beth
$20,4M
$7,5M
36.7%
425332
Riverside Health and Rehab
NH

Nursing Home Licensed facility providing 24/7 skilled nursing care for residents with complex, ongoing medical needs. Staffed by RNs, LPNs, and CNAs. Inspected and star-rated annually by CMS. Accepts Medicare (short-term rehab) and Medicaid (long-term care).

HC

Home Care Professional care delivered in the person's own home — from companionship and errands to skilled nursing and therapy. Allows seniors to age in place. Medicare covers skilled home health when medically necessary.

N

Nursing

RC

Respite Care Short-term temporary care — days to weeks — to give family caregivers a break. Full care provided during the stay. Often used after hospitalization or to trial a facility before a permanent placement decision.

North Charleston
160
87.7%
+7%
2.51
-25%
-37%
4
29
3
147
-
24
Castle, Patty
$18,7M
$6,5M
34.7%
425082

Places of interest near Riverside Health and Rehab

Address 5.4 miles from city center — 1.5 miles to nearest hospital (University Medical Associates)

Address 2375 Baker Hospital Blvd, North Charleston, SC 29405

Calculate Travel Distance to Riverside Health and Rehab

Add your location

Address

Staffing Data (Q2 2025)

This data corresponds to Q2 2025 and is based on CMS Payroll-Based Journal.

Total staff 247
Employees 103
Contractors 144
Staff to resident ratio 1.68:1
6% worse than South Carolina average

South Carolina average ratio: 1.80:1

Avg staff/day 60
Average shift 8.3 hours
5% better than South Carolina average

South Carolina average: 7.9 hours

Total staff hours (quarter) 45,053
Nursing staff breakdown
Registered Nurse

Manages medical care and health needs.

Total count 18
Average shift length Info Average shift length. Calculated as total hours divided by days worked and average staff per day. 9.7 hours

This role is partially covered by contractors.

Licensed Practical Nurse

Assists with medical care and medications.

Total count 52
Average shift length Info Average shift length. Calculated as total hours divided by days worked and average staff per day. 9.9 hours

This role is partially covered by contractors.

Certified Nursing Assistant

Helps with daily care and mobility.

Total count 117
Average shift length Info Average shift length. Calculated as total hours divided by days worked and average staff per day. 8 hours

This role is partially covered by contractors.

Contractor staffing

Total hours from contractors

37.4%

16,830 contractor hours this quarter

Certified Nursing Assistant: 76 Licensed Practical Nurse: 35 Speech Language Pathologist: 9 Qualified Social Worker: 6 Registered Nurse: 5 Physical Therapy Aide: 4 Respiratory Therapy Technician: 4 Physical Therapy Assistant: 2 Clinical Nurse Specialist: 1 Occupational Therapy Aide: 1 Medical Director: 1
Staff by category
Certified Nursing Assistant417611719,51391100%8
Licensed Practical Nurse17355210,68591100%9.9
Registered Nurse135182,84091100%9.7
Qualified Activities Professional8081,7629099%9.1
Clinical Nurse Specialist4151,6996470%8
RN Director of Nursing3031,2196369%8
Other Dietary Services Staff3039038897%6.6
Dental Services Staff3038786673%7.4
Physical Therapy Aide0448026976%6.4
Speech Language Pathologist0997157178%5.8
Administrator2026646268%8
Qualified Social Worker0665687380%6.3
Nurse Aide in Training5055313943%7.3
Dietitian1015277178%7.4
Respiratory Therapy Technician0445037178%6.6
Nurse Practitioner1014886167%8
Physical Therapy Assistant0224676875%6.6
Occupational Therapy Aide0111301820%7.2
Mental Health Service Worker2021091516%7.3
Medical Director011502730%1.9
117 Certified Nursing Assistant
% of Days 100%
52 Licensed Practical Nurse
% of Days 100%
18 Registered Nurse
% of Days 100%
8 Qualified Activities Professional
% of Days 99%
5 Clinical Nurse Specialist
% of Days 70%
3 RN Director of Nursing
% of Days 69%
3 Other Dietary Services Staff
% of Days 97%
3 Dental Services Staff
% of Days 73%
4 Physical Therapy Aide
% of Days 76%
9 Speech Language Pathologist
% of Days 78%
2 Administrator
% of Days 68%
6 Qualified Social Worker
% of Days 80%
5 Nurse Aide in Training
% of Days 43%
1 Dietitian
% of Days 78%
4 Respiratory Therapy Technician
% of Days 78%
1 Nurse Practitioner
% of Days 67%
2 Physical Therapy Assistant
% of Days 75%
1 Occupational Therapy Aide
% of Days 20%
2 Mental Health Service Worker
% of Days 16%
1 Medical Director
% of Days 30%

Facility Characteristics

Source: CMS Long-Term Care Facility Characteristics (Data as of Jan 2026)

Total census
147 residents
Residents by payment source
Medicare
11 residents (7.5%)
Medicaid
109 residents (74.1%)
Private pay or other
27 residents (18.4%)
Programs & Services
Residents' Group

Residents meet regularly to discuss policies, care quality, and activities

CCRC

Part of a Continuing Care Retirement Community offering multiple care levels

Active Resident Council

Organized group of residents that meets regularly to discuss facility policies, quality of life, and activities.

Quality of care over time

These measures show how residents usually do over time at this home, based on health outcomes and preventive care.

High-risk clinical events score Info A composite score based on pressure ulcers, falls with injury, weight loss, walking ability decline, and activities of daily living decline. 10.0
15% worse than South Carolina average

South Carolina average: 8.7

Functional decline score Info A composite score based on activities of daily living decline, walking ability decline, and incontinence. 12.1
22% better than South Carolina average

South Carolina average: 15.5

Long-stay resident measures
Average South Carolina avg: 4.0 Info CMS star rating based on long-stay quality measure performance. 5 stars = significantly above average, 1 star = significantly below average.
Need for Help with Daily Activities Increased Info Percent of long-stay residents whose need for help with daily activities has increased 7.1%
45% better than South Carolina average

South Carolina average: 13.1%

Walking Ability Worsened Info Percent of long-stay residents whose ability to move independently worsened 19.2%
19% worse than South Carolina average

South Carolina average: 16.2%

Low Risk Residents with Bowel/Bladder Incontinence Info Percent of low risk long-stay residents who lose control of their bowels or bladder 10.0%
41% better than South Carolina average

South Carolina average: 17.0%

Falls with Major Injury Info Percent of long-stay residents experiencing one or more falls with major injury 1.7%
44% better than South Carolina average

South Carolina average: 3.0%

High Risk Residents with Pressure Ulcers Info Percent of long-stay high risk residents with pressure ulcers 8.6%
41% worse than South Carolina average

South Carolina average: 6.1%

Urinary Tract Infection Info Percent of long-stay residents with a urinary tract infection 2.3%
38% worse than South Carolina average

South Carolina average: 1.6%

Lost Too Much Weight Info Percent of long-stay residents who lose too much weight 13.5%
119% worse than South Carolina average

South Carolina average: 6.2%

Depressive Symptoms Info Percent of long-stay residents who have depressive symptoms 3.0%
9% worse than South Carolina average

South Carolina average: 2.8%

Antipsychotic Use Info Percent of long-stay residents who received an antipsychotic medication 12.6%
13% better than South Carolina average

South Carolina average: 14.5%

Pneumococcal Vaccine Info Percent of long-stay residents assessed and appropriately given the pneumococcal vaccine 62.8%
31% worse than South Carolina average

South Carolina average: 90.5%

Influenza Vaccine Info Percent of long-stay residents assessed and appropriately given the seasonal influenza vaccine 70.8%
22% worse than South Carolina average

South Carolina average: 90.6%

Hospitalizations per 1,000 days Info Number of hospitalizations per 1,000 long-stay resident days. 2.77
36% worse than South Carolina average

South Carolina average: 2.03

ED visits per 1,000 days Info Number of outpatient emergency department visits per 1,000 long-stay resident days. 2.29
20% worse than South Carolina average

South Carolina average: 1.91

Short-stay resident measures
Significantly below average South Carolina avg: 3.4 Info CMS star rating based on short-stay quality measure performance. 5 stars = much above average, 1 star = much below average.
Pneumococcal Vaccine Info Percent of short-stay residents assessed and appropriately given the pneumococcal vaccine 27.8%
65% worse than South Carolina average

South Carolina average: 79.5%

Antipsychotic medication increase Info Percent of short-stay residents who newly received an antipsychotic medication 2.7%
61% worse than South Carolina average

South Carolina average: 1.7%

Influenza Vaccine Info Percent of short-stay residents assessed and appropriately given the seasonal influenza vaccine 42.5%
46% worse than South Carolina average

South Carolina average: 78.0%

Re-hospitalized after SNF stay Info Percentage of short-stay residents who were re-hospitalized after their nursing home admission. 24.3%
In line with South Carolina average

South Carolina average: 24.7%

Emergency department visits Info Percentage of short-stay residents who had an outpatient emergency department visit. 9.9%
30% better than South Carolina average

South Carolina average: 14.1%

Falls with major injury Info Percentage of SNF residents who experience falls with major injury during their stay. 1.0%
27% worse than South Carolina average

South Carolina average: 0.8%

Ability to care for self at discharge Info Percentage of residents at or above expected ability to care for themselves at discharge. 23.3%
57% worse than South Carolina average

South Carolina average: 53.7%

Successful return to home or community Info Rate of successful return to home or community from a skilled nursing facility. 51.8%
In line with South Carolina average

South Carolina average: 50.6%

Penalties and fines

Federal penalties imposed by CMS for regulatory violations, including civil money penalties (fines) and denials of payment for new Medicare/Medicaid admissions.

Source: CMS Penalties Database (Data as of Jan 2026)

Total fines amount $34K
In line with South Carolina average

South Carolina average: $34K

Number of fines 4
64% more fines than South Carolina average

South Carolina average: 2.4

Payment Denials Info Serious action where Medicare and/or Medicaid temporarily stops payments for new residents until issues are fixed. 1
761% more payment denials than South Carolina average

South Carolina average: 0.1

Fines amount comparison
This facility $34K
South Carolina average $34K
Penalty History

Penalties are imposed by CMS for violations of federal nursing home regulations.

Civil Money Penalty Info Fines imposed for noncompliance, which can be assessed per day or per instance of violation. Nov 19, 2024
$5K
Civil Money Penalty Info Fines imposed for noncompliance, which can be assessed per day or per instance of violation. Nov 19, 2024
$5K
Civil Money Penalty Info Fines imposed for noncompliance, which can be assessed per day or per instance of violation. Mar 15, 2024
$17K
Civil Money Penalty Info Fines imposed for noncompliance, which can be assessed per day or per instance of violation. Apr 26, 2023
$6K

Last updated: Jan 2026

Guides for Better Senior Living

Care Cost Calculator: See Prices in Your Area

Nursing Home Data Explorer

Don’t Wait Too Long: 7 Red Flag Signs Your Parent Needs Assisted Living Now

The True Cost of Assisted Living in 2025 – And How Families Are Paying For It

Understanding Senior Living Costs: Pricing Models, Discounts & Financial Assistance

Financial Aid for South Carolina Seniors

Get financial aid guidance

Community Long Term Care (CLTC)

SC Medicaid CLTC

Age 65+ or disabled, South Carolina resident, Medicaid-eligible, nursing home-level care need.

~$2,829/month (300% FBR, individual).

$2,000 (individual), $3,000 (couple).

High rural demand; waitlists possible.

South Carolina Respite Care Program

SC NFCSP Respite

Caregiver of someone 60+ (or with dementia), South Carolina resident.

No strict limit; prioritizes low-income.

Not applicable.

Limited slots; rural/urban balance.

Medicare Savings Program (MSP)

South Carolina Medicare Savings Program

Age 65+ or disabled, SC resident, Medicare Part A/B.

~$2,510/month (QMB), ~$3,380/month (SLMB), ~$3,598/month (QI)—individual.

$9,430 (individual), $14,130 (couple).

Three tiers; includes Extra Help for Part D; no waitlist.

Low-Income Home Energy Assistance Program (LIHEAP)

South Carolina LIHEAP

Age 60+ prioritized, SC resident, low-income household.

~$3,970/month (individual, 185% FPL).

Not assessed; income-focused.

Covers gas, electric, oil; emergency aid via ECAP (~$500 max).

Senior Community Service Employment Program (SCSEP)

South Carolina SCSEP

Age 55+, unemployed, low-income, SC resident.

~$1,983/month (125% FPL).

Not specified; income-focused.

Priority for veterans, rural residents; Goodwill/AARP partnership.

VA Aid and Attendance (A&A) and Housebound Benefits

South Carolina VA Aid and Attendance/Housebound

Age 65+ or disabled veteran/spouse, SC resident, wartime service, need for ADL help (A&A) or homebound.

Net income < ~$1,984/month (veteran with dependent, A&A); pension offsets income.

~$155,356 (net worth limit).

High veteran population; supports rural/urban care needs.

Senior Farmers’ Market Nutrition Program (SFMNP)

South Carolina SFMNP

Age 60+, SC resident, low-income.

~$2,322/month (individual, 185% FPL).

Not assessed.

Vouchers (~$50/season); serves ~20,000 annually via 10 AAAs.

Homestead Exemption Program

South Carolina Homestead Exemption

Age 65+ (or disabled/blind), SC resident 1+ year, homeowner.

None; tax-based eligibility.

Not assessed; home-focused.

Saves ~$500-$1,000/year avg.; applies to primary residence.

Elderly Simplified Application Project (ESAP)

South Carolina ESAP (SNAP for Seniors)

Age 60+, SC resident, no earned income, not on SCCAP.

~$1,732/month (133% FPL, individual).

$4,250 (individual, higher than standard SNAP).

Simplified process; serves ~50,000 seniors annually.

Tour Icon
Planning a tour? Check our touring checklist.
Chat Icon
Thinking of living here? We can help you speak to a current resident