Explore Open Rooms

1 Contact details
2 What type of senior care service are you looking for?
3 What budget do you have in mind for senior care?
4 How soon do you need to find care?
5 Additional details

Thank you for your interest!

Our team will be in touch shortly to help with next steps.

Nursing Home in Wabash County

CMS overall rating Info The Overall CMS Rating combines results from health inspections, staffing levels and quality measures. Health inspections carry the most weight. Staffing and quality scores can increase or decrease the final rating based on performance compared to state and national standards.

Rolling Meadows Health and Rehabilitation

604 Rennaker St, La Fontaine, IN 46940 View map
Overview of Rolling Meadows Health and Rehabilitation

Rolling Meadows Health and Rehabilitation is the premier choice in La Fontaine. The upscale facility aims to reinvent the meaning of nursing care for seniors through the exceptional care delivered by its compassionate, qualified, experienced staff. Specializing in long-term skilled nursing, short-term rehabilitation, and memory care services, residents of all housing options are encouraged and empowered to thrive. The results-driven community aims to fulfill and maintain a healthy and well-balanced lifestyle for each resident to redirect them to recovery.
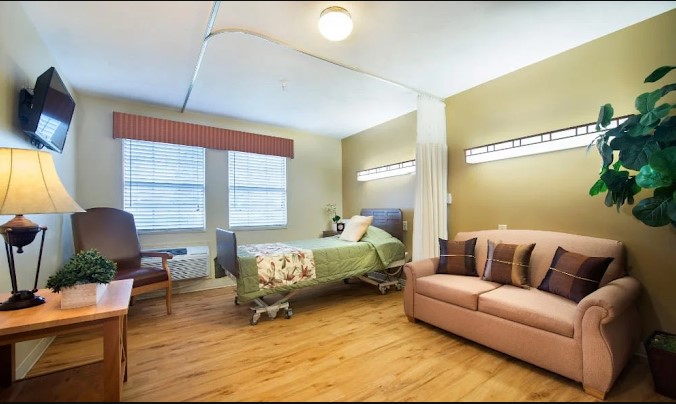
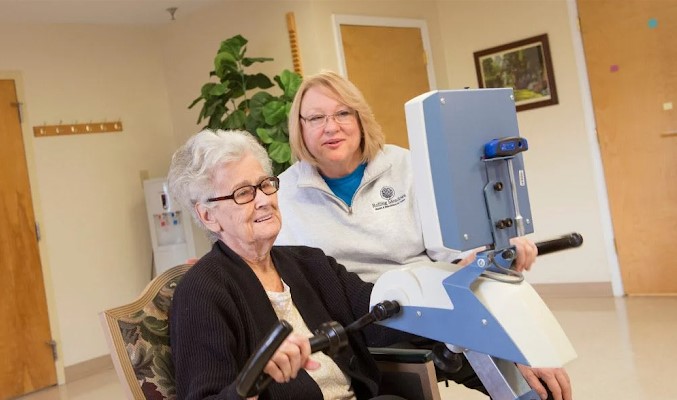
The Rolling Meadows lifestyle is focused on comfort, relaxation, and guidance. All individuals are eligible for personalized care plans that help residents reach their full potential. Featured accommodations include therapists, pathologists, 24/7 care staff, specialized memory care training, and ADLs. Amenities include a rehabilitation gym, a life enrichment center, and a private dining room.

(765) 981-2081

Quality ratings

Measured by Centers for Medicare & Medicaid Services (CMS)

Overall rating Info The Overall CMS Rating combines results from health inspections, staffing levels and quality measures. Health inspections carry the most weight. Staffing and quality scores can increase or decrease the final rating based on performance compared to state and national standards.
5/5
Indiana average: 3.0/5
Health Inspection Info Based on the results of the facility's three most recent standard inspections and any complaint investigations. CMS reviews the number, scope, and severity of deficiencies, with more recent findings weighted more heavily.
4/5
Indiana average: 2.7/5
Staffing Info Measures average nursing staff hours per resident per day, including Registered Nurses (RNs) and total nursing staff. Ratings are adjusted based on the level of care residents require and are compared to state and national benchmarks.
2/5
Indiana average: 2.6/5
Quality Measures Info Based on clinical and physical health indicators reported to CMS, such as hospital readmissions, falls, pressure ulcers, and improvements in mobility. These measures reflect how well residents' health needs are being managed.
5/5
Indiana average: 4.1/5

Nursing care per resident

Info This shows how many total hours of nursing staff time are available per resident each day. Higher numbers usually mean more staff support.
3h 21m per day

This home provides 6% less nursing time per resident than the Indiana average.

Indiana average: 3h 32m per day

Staffing hours breakdown

Info Hours of care per resident per day, broken down by staff type. Data from CMS Medicare.
Staff type Facility State avg National avg
Registered Nurse (RN) Info Registered nurse hours per resident per day. 18m per day 40m per day 41m per day
Nurse Aide Info Nurse aide hours per resident per day. 2h 15m per day 2h 16m per day 2h 21m per day
Total Nursing (Weekend) Info Total number of nurse staff hours per resident per day on weekends. 3h 17m per day 3h 14m per day 3h 26m per day
Physical Therapist Info Physical therapist staff hours per resident per day. 3m per day 4m per day 4m per day
RN (Weekend) Info Registered nurse hours per resident per day on weekends. 11m per day 27m per day 29m per day

Capacity and availability

Medium-capacity home

Offers a balance of services and community atmosphere.

Total beds 115

This home usually has availability

Lower occupancy suggests more openings may be available.

Lower demand than the Indiana average
Occupancy rate 76.5%
Residents per day (avg) 87
Occupancy rate
76.5%
Residents per day (avg)
87

Who this home usually serves

TYPE OF STAY

Primarily short stays

Residents typically stay for brief periods, with frequent admissions and discharges throughout the year.

Might be optimal for
Post-acute recovery Temporary care Transitional stays

Breakdown by payment type

Medicare

26% of new residents, usually for short-term rehab.

Typical stay 1 - 2 months

Private pay

74% of new residents, often for short stays.

Typical stay 10 - 11 months

Finances and operations

Governmental community
Operated by county authorities.
Home revenue
$11.9M
Surplus of revenue
$323.6K
Governmental community Operated by county authorities.
Home revenue
$11,871,468.00
Surplus of revenue
$323,583.00
Payroll costs Info The portion of the home's budget spent on staff, including nurses, caregivers, and other employees who support care and operations.
$4.2M
35.7% of revenue
Other operating costs Info All remaining costs needed to run the home, such as food, utilities, building maintenance, supplies and administrative expenses.
$7.3M
Total costs $11.5M
Bed community size
115-bed community
A larger shared setting that may offer more common spaces and organized community services.
Years in operation
1 year in operation
A newer community that may feature more recent facilities and programs.
Walk Score
Walk Score: 8 / 100
Car-dependent. Most errands require a car, with limited nearby walkable options.

About this community

Occupancy

Occupancy rate
77%
12% higher than Indiana average

Indiana average: 68%

Occupied beds
88 / 115
Average residents 70 per day

License Details

Facility TypeNursing Home (skilled Nursing Facility)
IssuanceJanuary 3, 2025
ExpirationFebruary 28, 2026

Additional Licensing Details

License Number25-000447-1
CMS Certification Number155551

Ownership & Operating Entity

Rolling Meadows Health and Rehabilitation is legally operated by Riverview Hospital, and administrated by Peyton Byrd.

Profit StatusNON-PROFIT

Type Of Units

SNF/NF (Combined)
115 units
Total beds
115 units

Staffing

Key information about the people who lead and staff this community.

Leadership

Medical DirectorShankaran Srikanth
Director of NursingCARMEN MORRISON
ContactMs. Cindy Cooper, Administrator

Therapy & Rehabilitation

2 services
Rehabilitation Services
Short-Term Rehab

Staffing & Medical

1 service
Skilled Nursing

Additional Services

1 service
Rehabilitation

Contact Information

Fax(765) 981-4954

Amenities & Lifestyle

0 amenities
Specific ProgramsMemory Care, Skilled Nursing, Rehabilitation Services

Types of Care at Rolling Meadows Health and Rehabilitation

Memory Care Nursing Home

Inspection History

In Indiana, the Department of Health, Division of Long Term Care is the primary regulatory body that performs onsite inspections and quality of care reviews for all licensed facilities.

Inspection Overview

25 total visits · Indiana avg: 19

Ranked 276th of 388 in Indiana

14 Inspections Indiana avg: 13 8% above Indiana avg
14 Complaint Visits Indiana avg: 8 75% above Indiana avg Ranked 301st of 367 2 formal complaints filed · avg: 5 Formal complaints can result in multiple visits
6 Visits with Citations Indiana avg: 7 14% below Indiana avg
9 Citations Total Indiana avg: 34 74% below Indiana avg Ranked 61st of 385
19 Visits without Citations Indiana avg: 12 58% above Indiana avg

2 complaints

Formal expressions of dissatisfaction or concern made by residents, or their families regarding various aspects of the care, services, and environment provided.

Indiana average: 5 complaints

Latest inspection

Date July 1, 2025
Re Inspection

9 total citations

Citations indicate regulatory violations. A higher number implies the facility had several areas requiring improvement.

Indiana average: 34 citations

16 deficiencies

Deficiencies indicate regulatory issues. A higher number implies the facility had several areas requiring improvement.

Indiana average: 36 deficiencies

Inspection Report Summary for Rolling Meadows Health and Rehabilitation

The most recent inspection on July 1, 2025, found Rolling Meadows Health Care Center to be in compliance with no deficiencies cited during the post-survey revisit of a complaint investigation. Earlier inspections showed a mixed pattern, with some deficiencies related primarily to fall prevention, medication administration, and PASRR submissions for residents with mental health conditions. Complaint investigations were mostly unsubstantiated or found no deficiencies, though some substantiated complaints did not result in citations. The facility did not have any fines, immediate jeopardy findings, or license actions listed in the available reports. The overall trend suggests some improvement in compliance, especially with the most recent inspection showing no deficiencies after prior issues were addressed.

Health Inspection History

Inspections
Total health inspections 4

Indiana average 6


Last Health inspection on Jun 2025

Total health citations 5

Indiana average 25

Citations per inspection
1.25

Indiana average 4.12


Health citations are formal notices following inspections when they fail to comply with safety and care standards.

3 of 5 citations resulted from standard inspections; and 2 of 5 resulted from complaint investigations.

Breakdown of citation severity (last 3 years)
Critical Health citations More info 0
100% better than Indiana average

Indiana average: 0.2


Serious Health citations More info 1
67% worse than Indiana average

Indiana average: 0.6

0 critical citations More info Indiana average: 0.2

1 serious citation More info Indiana average: 0.6

4 moderate citations More info Indiana average: 23.8

0 minor citations More info Indiana average: 0.4
Citations history (last 3 years)
Quality of Care serious citation Info Issues related to how well residents receive appropriate treatment and support for their medical and daily care needs. Jun 02, 2025
Corrected

Pharmacy moderate citation Info Issues related to medication management, including how drugs are stored, administered, and monitored. Oct 30, 2024
Corrected

Care Planning moderate citation Info Issues related to creating and updating personalized care plans for residents based on their needs and conditions. Oct 30, 2024
Corrected

Nursing Services moderate citation Info Issues related to the availability and quality of nursing staff and the care they provide. Apr 29, 2024
Corrected

Compare Nursing Homes around Wabash County The information below is reported by the Indiana Department of Health, Division of Long Term Care.

2 facilities compared · CMS & IN Dept. of Health data · Updated Apr 2026

Filter by care type
Rolling Meadows Health and Rehabilitation
MC

Memory Care Secured, specialized care for people living with Alzheimer's or dementia. Staff trained in cognitive impairment, with higher staff-to-resident ratios and an environment designed to reduce confusion and wandering risk.

NH

Nursing Home Licensed facility providing 24/7 skilled nursing care for residents with complex, ongoing medical needs. Staffed by RNs, LPNs, and CNAs. Inspected and star-rated annually by CMS. Accepts Medicare (short-term rehab) and Medicaid (long-term care).

La Fontaine
115
74.8%
+8%
3.35
0%
-3%
0
5
1.3
1
87
-
8
Riverview Hospital
$11.8M
$4.2M
35.8%
155551
Autumn Ridge Rehabilitation Centre
AL

Assisted Living A licensed, long-term care setting for seniors or individuals with disabilities who need help with daily activities — like bathing, dressing, and medication management — but not 24-hour skilled nursing. Offers housing, meals, and around-the-clock support while aiming to maximize resident independence.

IL

Independent Living Lifestyle-focused communities for older adults offering dining, activities, and transportation with minimal personal care. Best for active, independent seniors who want community without medical support.

MC

Memory Care Secured, specialized care for people living with Alzheimer's or dementia. Staff trained in cognitive impairment, with higher staff-to-resident ratios and an environment designed to reduce confusion and wandering risk.

NH

Nursing Home Licensed facility providing 24/7 skilled nursing care for residents with complex, ongoing medical needs. Staffed by RNs, LPNs, and CNAs. Inspected and star-rated annually by CMS. Accepts Medicare (short-term rehab) and Medicaid (long-term care).

Wabash
75
49.3%
-29%
3.54
+14%
+3%
0
7
3.5
0
39
A+
35
Hatfield, Rebecca
$4.4M
$2.7M
61.1%
155162

Places of interest near Rolling Meadows Health and Rehabilitation

Address 12 miles from city center — 7.56 miles to nearest hospital (Eric Schreier, DO)

Address 604 Rennaker St, La Fontaine, IN 46940

Calculate Travel Distance to Rolling Meadows Health and Rehabilitation

Add your location

Address

Staffing Data (Q2 2025)

This data corresponds to Q2 2025 and is based on CMS Payroll-Based Journal.

Total staff 126
Employees 113
Contractors 13
Staff to resident ratio 1.33:1
1326216% better than Indiana average

Indiana average ratio: 0.00:1

Avg staff/day 46
Average shift 7.8 hours
0% compared with Indiana average

Indiana average: 7.7 hours

Total staff hours (quarter) 32,572
Nursing staff breakdown
Registered Nurse

Manages medical care and health needs.

Total count 12
Average shift length Info Average shift length. Calculated as total hours divided by days worked and average staff per day. 8.5 hours

No contractors work on this role.

Licensed Practical Nurse

Assists with medical care and medications.

Total count 21
Average shift length Info Average shift length. Calculated as total hours divided by days worked and average staff per day. 9 hours

No contractors work on this role.

Certified Nursing Assistant

Helps with daily care and mobility.

Total count 50
Average shift length Info Average shift length. Calculated as total hours divided by days worked and average staff per day. 7.7 hours

This role is partially covered by contractors.

Contractor staffing

Total hours from contractors

7.6%

2,485 contractor hours this quarter

Physical Therapy Aide: 4 Physical Therapy Assistant: 2 Qualified Social Worker: 2 Speech Language Pathologist: 2 Respiratory Therapy Technician: 1 Certified Nursing Assistant: 1 Qualified Activities Professional: 1
Staff by category
Certified Nursing Assistant4915013,44691100%7.7
Licensed Practical Nurse210217,38591100%9
Medication Aide/Technician100102,09591100%8
Registered Nurse120121,76591100%8.5
Other Dietary Services Staff5051,67191100%6.5
RN Director of Nursing6061,0646774%7.4
Physical Therapy Aide0446056268%6.7
Administrator1015206571%8
Nurse Practitioner1015206571%8
Mental Health Service Worker1015206571%8
Clinical Nurse Specialist3035016976%6.6
Dental Services Staff1014886167%8
Dietitian1014666066%7.8
Qualified Social Worker0224616369%7.3
Respiratory Therapy Technician0114166268%6.7
Physical Therapy Assistant0222774651%6
Speech Language Pathologist0222116268%3.3
Nurse Aide in Training101971112%8.8
Qualified Activities Professional011631011%6.3
Occupational Therapy Aide101211%1.5
50 Certified Nursing Assistant
% of Days 100%
21 Licensed Practical Nurse
% of Days 100%
10 Medication Aide/Technician
% of Days 100%
12 Registered Nurse
% of Days 100%
5 Other Dietary Services Staff
% of Days 100%
6 RN Director of Nursing
% of Days 74%
4 Physical Therapy Aide
% of Days 68%
1 Administrator
% of Days 71%
1 Nurse Practitioner
% of Days 71%
1 Mental Health Service Worker
% of Days 71%
3 Clinical Nurse Specialist
% of Days 76%
1 Dental Services Staff
% of Days 67%
1 Dietitian
% of Days 66%
2 Qualified Social Worker
% of Days 69%
1 Respiratory Therapy Technician
% of Days 68%
2 Physical Therapy Assistant
% of Days 51%
2 Speech Language Pathologist
% of Days 68%
1 Nurse Aide in Training
% of Days 12%
1 Qualified Activities Professional
% of Days 11%
1 Occupational Therapy Aide
% of Days 1%

Facility Characteristics

Source: CMS Long-Term Care Facility Characteristics (Data as of Jan 2026)

Total census
95 residents
Residents by payment source
Medicare
3 residents (3.2%)
Medicaid
74 residents (77.9%)
Private pay or other
18 residents (18.9%)
Programs & Services
Residents' Group

Residents meet regularly to discuss policies, care quality, and activities

CCRC

Part of a Continuing Care Retirement Community offering multiple care levels

Active Resident Council

Organized group of residents that meets regularly to discuss facility policies, quality of life, and activities.

Quality of care over time

These measures show how residents usually do over time at this home, based on health outcomes and preventive care.

High-risk clinical events score Info A composite score based on pressure ulcers, falls with injury, weight loss, walking ability decline, and activities of daily living decline. 10.7
34% worse than Indiana average

Indiana average: 8.0

Functional decline score Info A composite score based on activities of daily living decline, walking ability decline, and incontinence. 20.2
18% worse than Indiana average

Indiana average: 17.1

Long-stay resident measures
Significantly above average Indiana avg: 4.3 Info CMS star rating based on long-stay quality measure performance. 5 stars = significantly above average, 1 star = significantly below average.
Need for Help with Daily Activities Increased Info Percent of long-stay residents whose need for help with daily activities has increased 13.1%
9% worse than Indiana average

Indiana average: 12.0%

Walking Ability Worsened Info Percent of long-stay residents whose ability to move independently worsened 20.0%
39% worse than Indiana average

Indiana average: 14.4%

Low Risk Residents with Bowel/Bladder Incontinence Info Percent of low risk long-stay residents who lose control of their bowels or bladder 27.4%
11% worse than Indiana average

Indiana average: 24.6%

Falls with Major Injury Info Percent of long-stay residents experiencing one or more falls with major injury 4.4%
14% worse than Indiana average

Indiana average: 3.9%

High Risk Residents with Pressure Ulcers Info Percent of long-stay high risk residents with pressure ulcers 4.9%
11% worse than Indiana average

Indiana average: 4.4%

Urinary Tract Infection Info Percent of long-stay residents with a urinary tract infection 0.9%
26% better than Indiana average

Indiana average: 1.2%

Lost Too Much Weight Info Percent of long-stay residents who lose too much weight 11.1%
96% worse than Indiana average

Indiana average: 5.7%

Depressive Symptoms Info Percent of long-stay residents who have depressive symptoms 5.1%
79% better than Indiana average

Indiana average: 24.1%

Antipsychotic Use Info Percent of long-stay residents who received an antipsychotic medication 3.7%
71% better than Indiana average

Indiana average: 12.4%

Pneumococcal Vaccine Info Percent of long-stay residents assessed and appropriately given the pneumococcal vaccine 96.8%
In line with Indiana average

Indiana average: 93.7%

Influenza Vaccine Info Percent of long-stay residents assessed and appropriately given the seasonal influenza vaccine 100.0%
5% better than Indiana average

Indiana average: 95.4%

Hospitalizations per 1,000 days Info Number of hospitalizations per 1,000 long-stay resident days. 0.47
71% better than Indiana average

Indiana average: 1.60

ED visits per 1,000 days Info Number of outpatient emergency department visits per 1,000 long-stay resident days. 0.75
49% better than Indiana average

Indiana average: 1.48

Short-stay resident measures
Significantly above average Indiana avg: 2.6 Info CMS star rating based on short-stay quality measure performance. 5 stars = much above average, 1 star = much below average.
Pneumococcal Vaccine Info Percent of short-stay residents assessed and appropriately given the pneumococcal vaccine 53.2%
35% worse than Indiana average

Indiana average: 81.7%

Antipsychotic medication increase Info Percent of short-stay residents who newly received an antipsychotic medication 0.0%
100% better than Indiana average

Indiana average: 1.4%

Influenza Vaccine Info Percent of short-stay residents assessed and appropriately given the seasonal influenza vaccine 65.1%
18% worse than Indiana average

Indiana average: 79.0%

Re-hospitalized after SNF stay Info Percentage of short-stay residents who were re-hospitalized after their nursing home admission. 13.4%
40% better than Indiana average

Indiana average: 22.4%

Emergency department visits Info Percentage of short-stay residents who had an outpatient emergency department visit. 0.0%
100% better than Indiana average

Indiana average: 10.5%

Falls with major injury Info Percentage of SNF residents who experience falls with major injury during their stay. 0.0%
100% better than Indiana average

Indiana average: 0.8%

Successful return to home or community Info Rate of successful return to home or community from a skilled nursing facility. 46.4%
8% worse than Indiana average

Indiana average: 50.6%

Guides for Better Senior Living

Care Cost Calculator: See Prices in Your Area

Nursing Home Data Explorer

Don’t Wait Too Long: 7 Red Flag Signs Your Parent Needs Assisted Living Now

The True Cost of Assisted Living in 2025 – And How Families Are Paying For It

Understanding Senior Living Costs: Pricing Models, Discounts & Financial Assistance

Financial Aid for Indiana Seniors

Get financial aid guidance

Aged and Disabled Waiver

Indiana Medicaid A&D Waiver

Age 65+ or disabled, Indiana resident, Medicaid-eligible, nursing home-level care need.

~$2,829/month (300% FBR, individual).

$2,000 (individual), $3,000 (couple).

Requires level-of-care determination.

CHOICE Program

Indiana CHOICE

Age 60+, Indiana resident, at risk of nursing home.

~$2,000/month (varies).

$10,000 (individual).

Limited funding; regional variation.

Residential Care Assistance Program (RCAP)

Indiana Residential Care Assistance Program

Age 65+, or blind, or disabled, Indiana resident, in approved facility, low-income or SSI recipient.

~$1,004/month (including SSI).

$2,000 (individual), $3,000 (couple).

~50 facilities statewide; per diem rate set by FSSA.

Medicare Savings Program (MSP)

Indiana Medicare Savings Program

Age 65+ or disabled, Indiana resident, Medicare Part A/B.

~$2,510/month (QMB), ~$3,380/month (SLMB), ~$3,598/month (QI)—individual.

$9,430 (individual), $14,130 (couple).

Three tiers; no waitlist.

National Family Caregiver Support Program (NFCSP) Respite

Indiana NFCSP Respite Care

Caregivers of 60+ needing care or 55+ caregivers of others; Indiana resident; functional needs (2+ ADLs).

Prioritizes ~$24,980/year (individual); no strict cap.

Not assessed; need-based.

16 AAAs; prioritizes low-income, rural caregivers.

Senior Community Service Employment Program (SCSEP)

Indiana SCSEP

Age 55+, unemployed, low-income, Indiana resident.

~$1,983/month (125% FPL).

Not specified; income-focused.

Priority for veterans, rural residents.

VA Aid and Attendance (A&A) and Housebound Benefits

Indiana VA Aid and Attendance/Housebound

Age 65+ or disabled veteran/spouse, Indiana resident, wartime service, need for ADL help (A&A) or homebound.

Net income < ~$1,984/month (veteran with dependent, A&A); pension offsets income.

~$155,356 (net worth limit).

High veteran demand statewide.