Roseville Care Center

Nursing Home
Overview of Roseville Care Center

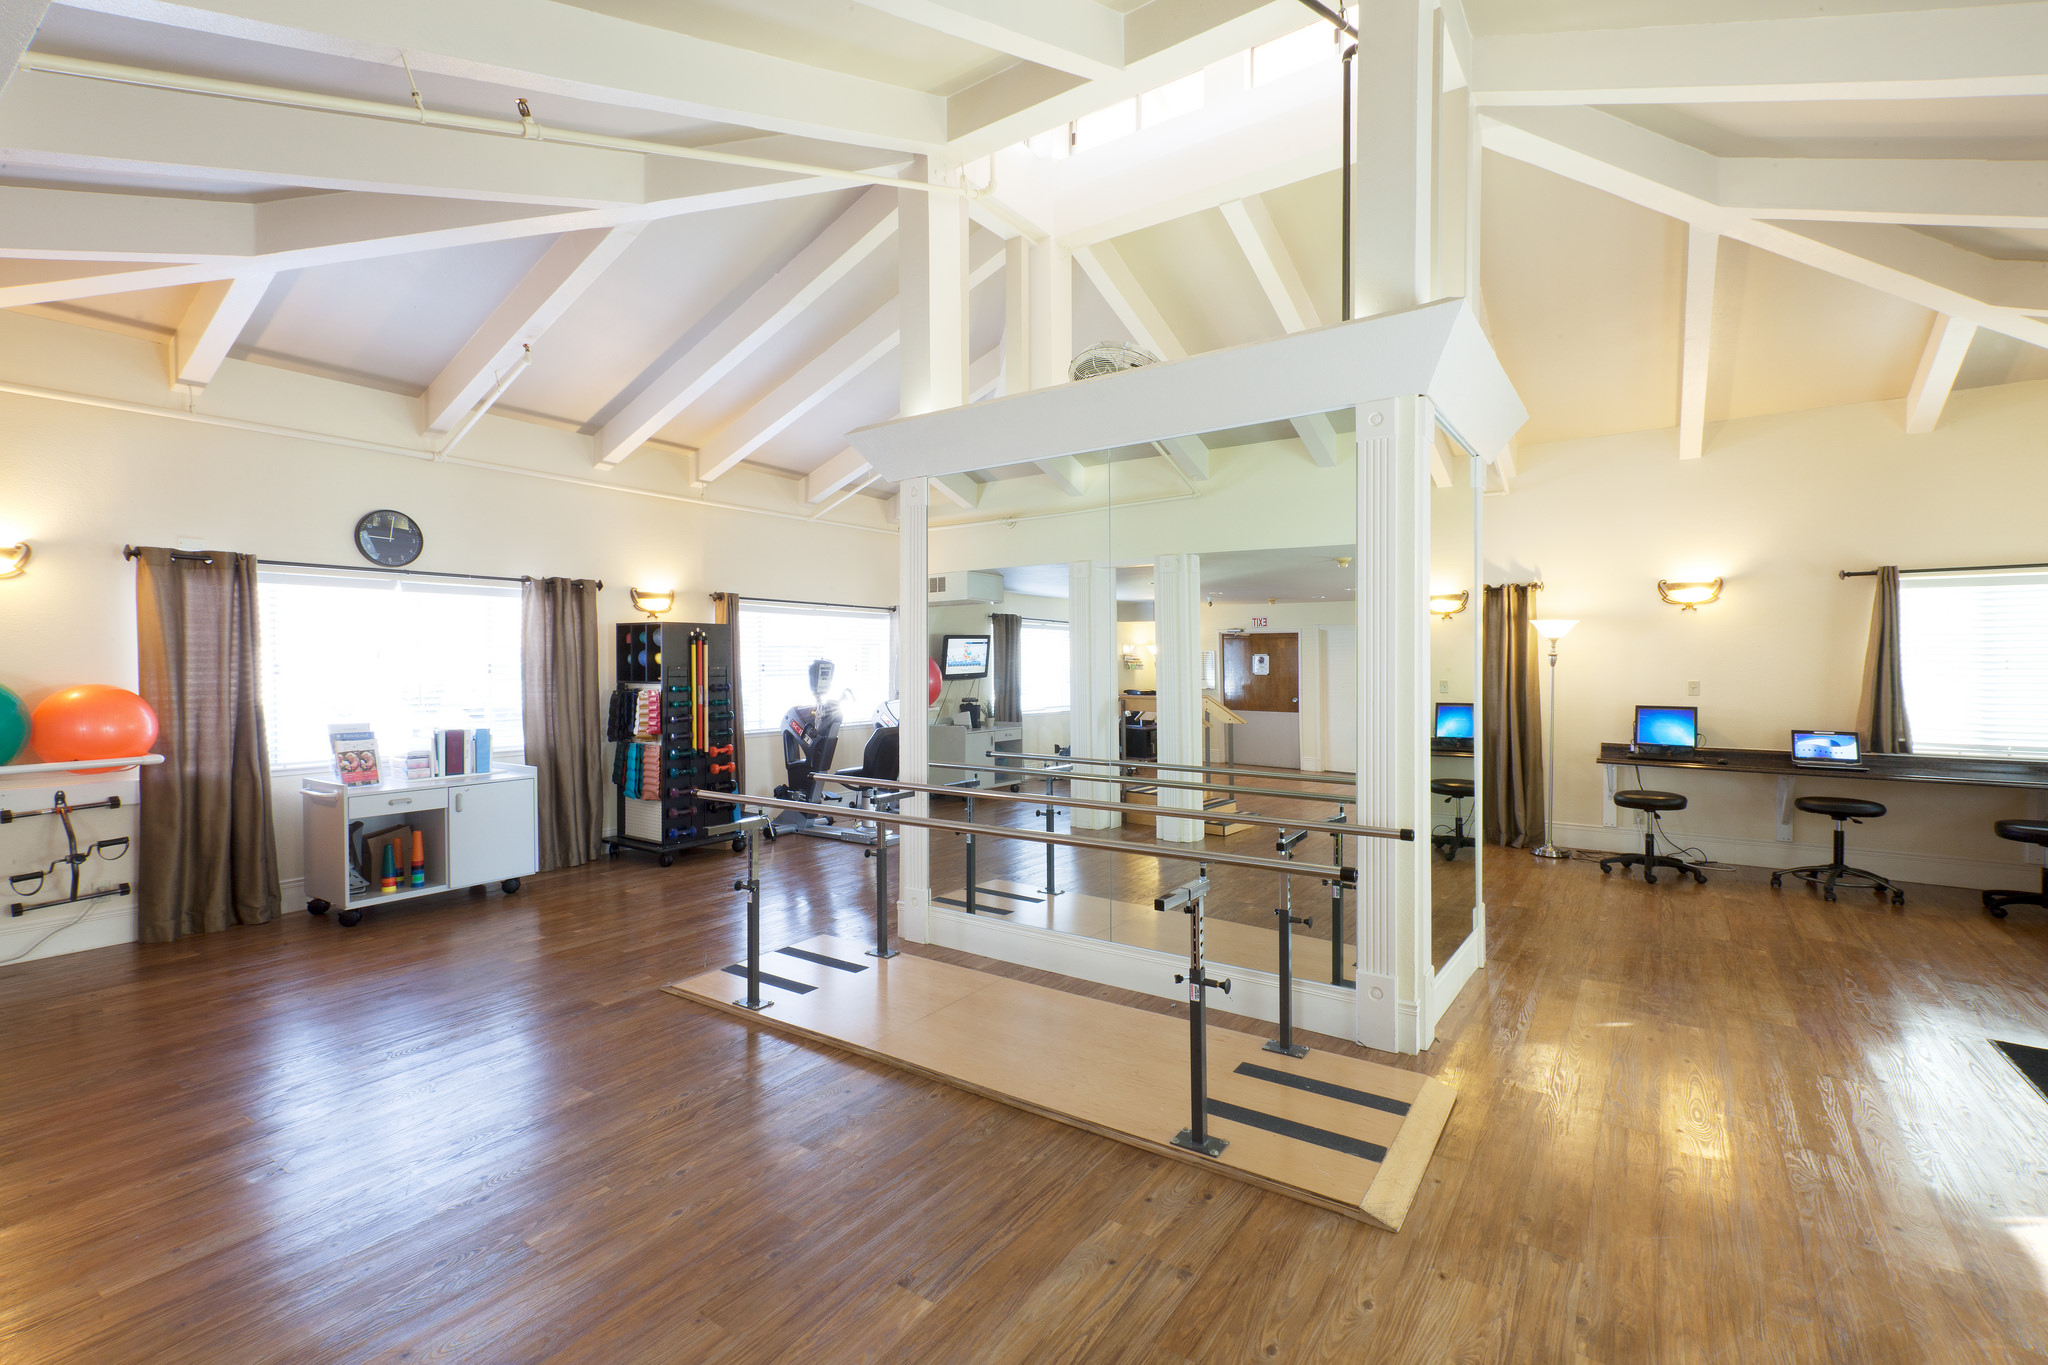
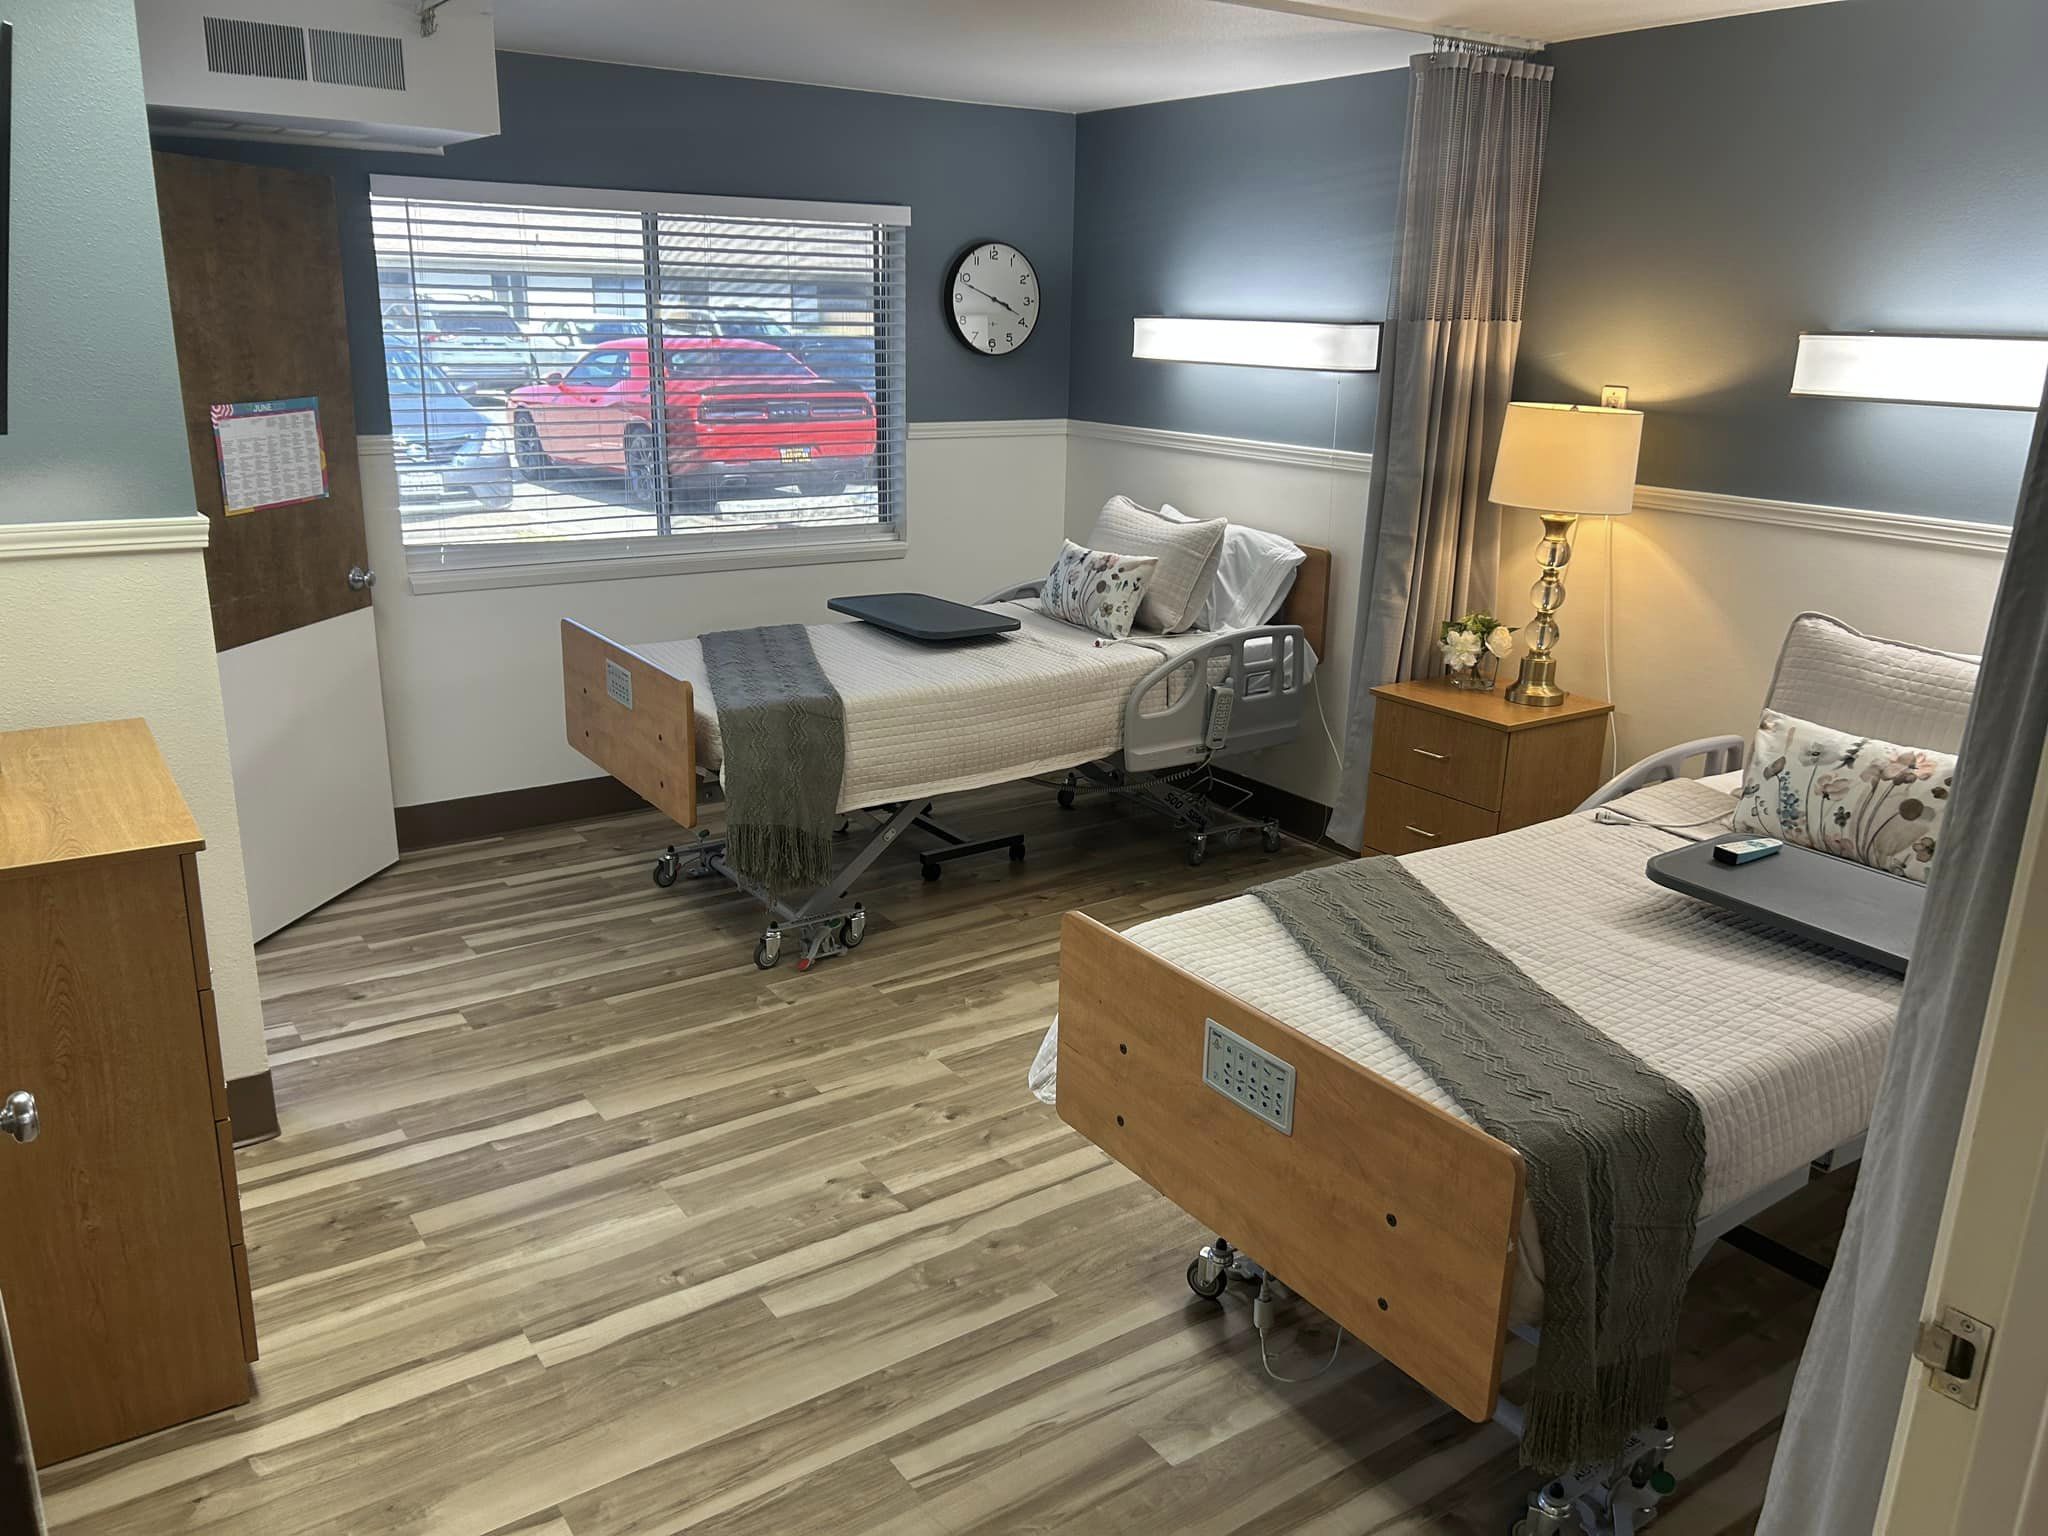
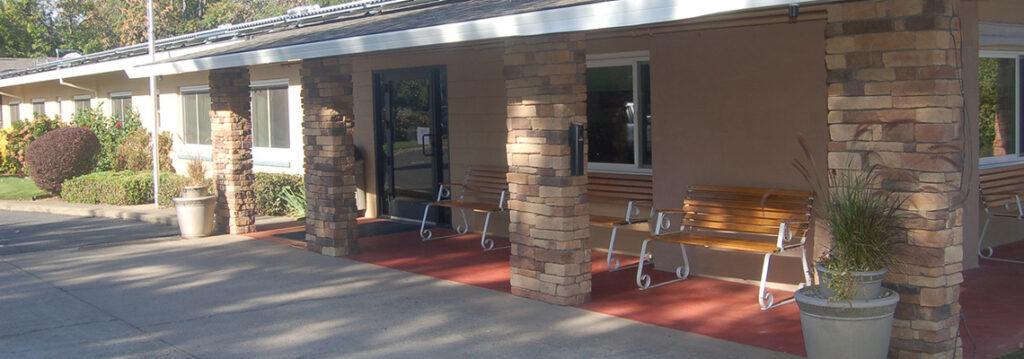
Roseville Care Center, located in Roseville, CA, is a facility offering quality skilled nursing and rehabilitation services. This facility provides their skilled nursing residents with 24/7 nursing care, medication management, as well as meal provisions through their nutrition and hydration programs.

Additionally, this skilled nursing facility’s staff are also well versed when it comes to memory care, providing specialized services in Alzheimer’s and dementia care. Their diabetes management on the other hand, helps residents with menu and exercise planning, glucose monitoring, as well as insulin administration.

(916) 782-1238

Managed by Your Care

Licensed Nursing Home Administrator (LNHA)

Your Care serves as the Licensed Nursing Home Administrator at Roseville Care Center, directing all facility operations, staffing, services, and programs. As the leader of the community, they ensure a coordinated approach to care alongside the Medical Director and other department directors, fostering a dedicated and skilled team focused on quality and patient recovery.

Quality ratings

Measured by Centers for Medicare & Medicaid Services (CMS)

Overall rating Info Official CMS rating based on health inspections, staffing and quality measures.
3/5
California average: 3.1/5
Health Inspection Info Official CMS rating based on deficiencies found during state health inspections.
2/5
California average: 2.8/5
Staffing Info Official CMS rating based on nurse staffing hours per resident per day.
3/5
California average: 3.1/5
Quality Measures Info Official CMS rating based on clinical outcomes for residents.
5/5
California average: 4.1/5

Nursing care per resident

Info Average daily nursing hours per resident (adjusted for acuity). Higher values indicate more nursing time per resident.
3h 42m per day

This home provides 12% less nursing time per resident than the state average.

California average: 4h 13m per day

Staffing hours breakdown

Info Hours of care per resident per day, broken down by staff type. Data from CMS Medicare.
Staff type Facility State avg National avg
Registered Nurse (RN) Info Registered nurse hours per resident per day. 28m per day 39m per day 41m per day
LPN / LVN Info Licensed Practical Nurse / Licensed Vocational Nurse hours per resident per day. 1h 21m per day 1h 13m per day 52m per day
Nurse Aide Info Nurse aide hours per resident per day. 2h 14m per day 2h 39m per day 2h 21m per day
Total Nursing (Weekend) Info Total number of nurse staff hours per resident per day on weekends. 3h 44m per day 4h 5m per day 3h 26m per day
Physical Therapist Info Physical therapist staff hours per resident per day. 9m per day 5m per day 4m per day
RN (Weekend) Info Registered nurse hours per resident per day on weekends. 23m per day 30m per day 29m per day

Capacity and availability

High-capacity home

May provide extensive amenities, services and programs.

Total beds 210

This home usually has availability

Lower occupancy suggests more openings may be available.

Lower demand than the California average
Occupancy rate 80.4%
Residents per day (avg) 176
Occupancy rate
80.4%
Residents per day (avg)
176

Who this home usually serves

TYPE OF STAY

Primarily short stays

Residents typically stay for brief periods, with frequent admissions and discharges throughout the year.

Might be optimal for
Post-acute recovery Temporary care Transitional stays

Breakdown by payment type

Medicare

27% of new residents, usually for short-term rehab.

Typical stay 1 - 2 months

Private pay

72% of new residents, often for short stays.

Typical stay 1 - 2 months

Medicaid

1% of new residents, often for long-term daily care.

Typical stay 1 - 2 years

Finances and operations

Proprietary home
Other
Home revenue
$45.0M
Profit
$2.7M
Proprietary home Other
Home revenue
$45,049,285.00
Profit
$2,679,946.00
Payroll costs Info The portion of the home's budget spent on staff, including nurses, caregivers, and other employees who support care and operations.
$16.1M
35.6% of revenue
Other operating costs Info All remaining costs needed to run the home, such as food, utilities, building maintenance, supplies and administrative expenses.
$26.3M
Total costs $42.4M
Walk Score
Walk Score: 68 / 100
Moderately walkable. Some errands can be accomplished on foot, with a mix of nearby amenities.

About this community

Additional licensing details

Awards: Top-rated skilled nursing facility

Safety & Compliance

Care Services

Accepts Medicare
Nursing Services
Rehabilitation Services
Respite Care
Skilled Nursing
Licensed Nurses/CNAs
24-Hour Staffing
Short-Term Rehab

All Levels of Care

Skilled Nursing
Rehabilitation
Respite Care

Additional Policies & Features

Pets Allowed

Amenities & Lifestyle

Private bathrooms with showers
expansive common areas
state-of-the-art rehab gym
spacious courtyards

Programs & Activities

Specific Programs
Skilled Nursing, Short-Term Rehab, Social Services, Activities
Operating Hours
Monday – Friday: 8 am to 8 pm, Weekends: 8 am to 8 pm

Types of Care at Roseville Care Center

Skilled Nursing
Contact Roseville Care Center

Compare Nursing Homes around Folsom

The information below is reported by the California Department of Social Services and Department of Public Health.
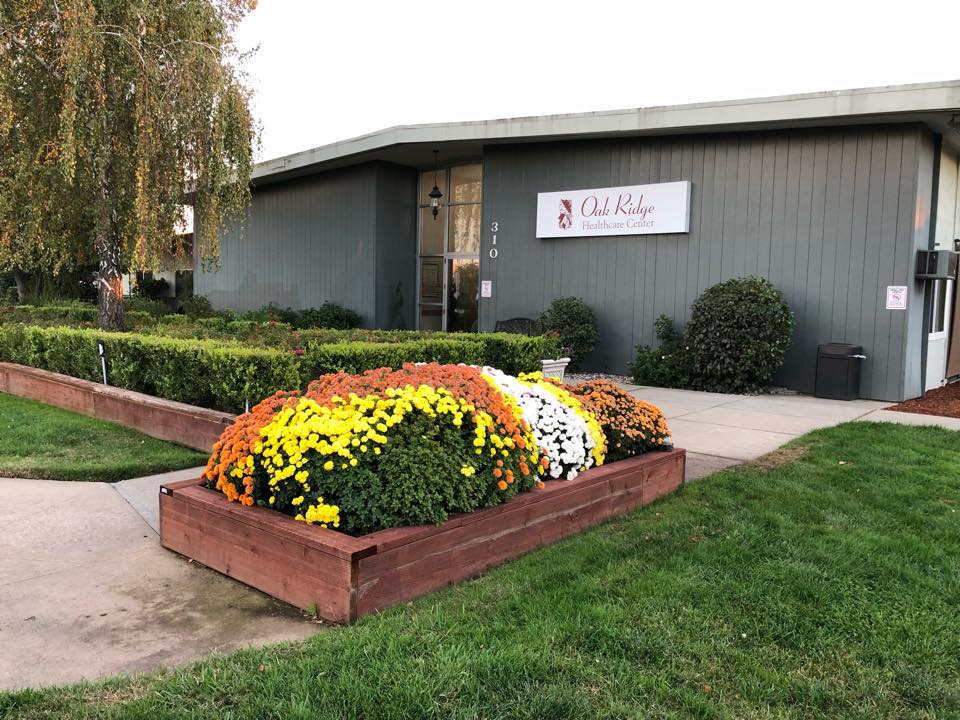
Oak Ridge Healthcare Center
AL

Assisted Living For seniors needing help with daily tasks but not full-time nursing.

SNF

Nursing Homes 24/7 care needed

Roseville (Sierra Gardens)
67
No
-
77
POLLOCK, JASON
89.5%
$7,600,340.00
$4,731,846.00
62.3%
63.90
5/5
4.3493
4/5
4/5
5/5
-
21
-70%
+3%
+6%
Pine Creek Care Center
AL

Assisted Living For seniors needing help with daily tasks but not full-time nursing.

SNF

Nursing Homes 24/7 care needed

Roseville (Cirby Side)
99
No
B-
48
TRUHAR, BRADLEY
93.9%
$27,348,098.00
$9,325,391.00
34.1%
94.50
5/5
3.6517
4/5
2/5
5/5
-
24
-24%
-13%
+11%
Roseville Care Center
AL

Assisted Living For seniors needing help with daily tasks but not full-time nursing.

SNF

Nursing Homes 24/7 care needed

Roseville (Cirby Side)
210
No
-
68
CHEEMA, CHANDAN
80.4%
$45,013,299.00
$16,056,781.00
35.7%
175.70
3/5
3.7068
2/5
3/5
5/5
1
47
-1%
-12%
-5%
Folsom Care Center
MC

Memory Care Specialized care for those with Memory Loss, Alzheimer's, or dementia, ensuring safety and support.

SNF

Nursing Homes 24/7 care needed

Folsom
99
Yes
-
-
-
-
-
-
-
-
-
-
-
-
-
-
-
-
-
-

Places of interest near Roseville Care Center

Address 2.9 miles from city center — 4.73 miles to nearest hospital (Mercy San Juan Medical Center)

Address 1161 Cirby Way, Roseville, CA 95661

Calculate Travel Distance to Roseville Care Center

Add your location

Address

Staffing Data

Source: CMS Payroll-Based Journal (Q2 2025)

284
Total Staff
260
Employees
24
Contractors
83,675
Total Hours (Quarter)
118
Avg Staff/Day
7.8
Avg Shift (hrs)
Nursing Staff Breakdown
Role Count Avg Shift (hrs) Uses Contractors?
Registered Nurse247.6 No
Licensed Practical Nurse647.7 No
Certified Nursing Assistant1327.8 Yes
Staff by Category
Administration
1 staff
8hs shift avg
Nursing Staff
226 staff
7.8hs shift avg
Physicians & Practitioners
4 staff
5.9hs shift avg
Therapy Services
34 staff
8.3hs shift avg
Activities & Recreation
1 staff
7.4hs shift avg
Social Services
6 staff
5.1hs shift avg
Dietary Services
9 staff
7.8hs shift avg
Other Services
3 staff
9hs shift avg
Contractor Analysis
0.4%
of total hours from contractors
365 contractor hours this quarter
Certified Nursing Assistant: 21 Physician Assistant: 1 Occupational Therapy Assistant: 1 Other Physician: 1
Role Employees Contractors Total Staff Total Hours Days Worked % of Days Avg Shift (hrs)
Certified Nursing Assistant1112113235,35591100%7.8
Licensed Practical Nurse6406420,07091100%7.7
Registered Nurse240246,25591100%7.6
Speech Language Pathologist8083,4837886%8.6
Physical Therapy Aide7073,4618695%8.2
Physical Therapy Assistant8082,7528492%8.1
Respiratory Therapy Technician8082,5418492%8.2
RN Director of Nursing6062,1238492%8
Other Dietary Services Staff7071,83391100%7.7
Dental Services Staff3031,7127886%9
Qualified Social Worker6067817380%5.1
Occupational Therapy Aide2027706470%7.5
Therapeutic Recreation Specialist1016639099%7.4
Dietitian2025847178%8
Administrator1015126470%8
Nurse Practitioner1015126470%8
Physician Assistant0111264246%3
Clinical Nurse Specialist101801011%8
Occupational Therapy Assistant0115278%7.4
Other Physician0111189%1.4

Health Inspection History

Inspections
Total health inspections 14

California average 12.5


Last Health inspection on Jul 2025

Total health citations 47
Citations per inspection
3.36

Health citations are formal notices following inspections when they fail to comply with safety and care standards.

35 of 47 citations resulted from standard inspections; and 12 of 47 resulted from complaint investigations.

Breakdown of citation severity (last 3 years)
Critical Health citations More info 0
100% better than California average

California average: 0.4


Serious Health citations More info 0
100% better than California average

California average: 1

0 critical citations More info California average: 0.4

0 serious citations More info California average: 1

47 moderate citations More info California average: 47.2

0 minor citations More info California average: 1.5
Citations history (last 3 years)
Abuse/Neglect moderate citation Jul 09, 2025
Corrected

Abuse/Neglect moderate citation Jun 27, 2025
Corrected

Environmental moderate citation Jun 27, 2025
Corrected

Infection Control moderate citation Jun 27, 2025
Corrected

Facility Characteristics

Source: CMS Long-Term Care Facility Characteristics (Data as of Jan 2026)

Ownership: For-Profit LLC
Part of: PACS
Resident Census by Payment Source
160 Total Residents
Medicare 76 (47.5%)
Medicaid 83 (51.9%)
Private Pay/Other 1 (0.6%)
Programs & Services
Residents' Group
Nurse Aide Training
Family Engagement

Active councils help families stay involved in care decisions and facility operations.

Quality of care over time

These measures show how residents usually do over time at this home, based on health outcomes and preventive care.

High-risk clinical events score Info A composite score based on pressure ulcers, falls with injury, weight loss, walking ability decline, and activities of daily living decline. 2.8
58% better than California average

California average: 6.6

Functional decline score Info A composite score based on activities of daily living decline, walking ability decline, and incontinence. 2.4
79% better than California average

California average: 11.3

Long-stay resident measures
Need for Help with Daily Activities Increased Info Percent of long-stay residents whose need for help with daily activities has increased 1.6%
85% better than California average

California average: 11.1%

Walking Ability Worsened Info Percent of long-stay residents whose ability to move independently worsened 3.0%
75% better than California average

California average: 12.0%

Low Risk Residents with Bowel/Bladder Incontinence Info Percent of low risk long-stay residents who lose control of their bowels or bladder 2.7%
76% better than California average

California average: 11.3%

Falls with Major Injury Info Percent of long-stay residents experiencing one or more falls with major injury 4.9%
197% worse than California average

California average: 1.7%

High Risk Residents with Pressure Ulcers Info Percent of long-stay high risk residents with pressure ulcers 1.5%
70% better than California average

California average: 5.0%

Urinary Tract Infection Info Percent of long-stay residents with a urinary tract infection 0.8%
36% better than California average

California average: 1.2%

Lost Too Much Weight Info Percent of long-stay residents who lose too much weight 3.1%
26% better than California average

California average: 4.2%

Depressive Symptoms Info Percent of long-stay residents who have depressive symptoms 4.5%
33% better than California average

California average: 6.7%

Antipsychotic Use Info Percent of long-stay residents who received an antipsychotic medication 4.9%
52% better than California average

California average: 10.1%

Pneumococcal Vaccine Info Percent of long-stay residents assessed and appropriately given the pneumococcal vaccine 100.0%
In line with California average

California average: 98.5%

Influenza Vaccine Info Percent of long-stay residents assessed and appropriately given the seasonal influenza vaccine 100.0%
In line with California average

California average: 98.2%

Hospitalizations per 1,000 days Info Number of hospitalizations per 1,000 long-stay resident days. 2.16
In line with California average

California average: 2.25

ED visits per 1,000 days Info Number of outpatient emergency department visits per 1,000 long-stay resident days. 1.21
24% better than California average

California average: 1.59

Short-stay resident measures
Pneumococcal Vaccine Info Percent of short-stay residents assessed and appropriately given the pneumococcal vaccine 100.0%
6% better than California average

California average: 94.0%

Antipsychotic medication increase Info Percent of short-stay residents who newly received an antipsychotic medication 0.4%
74% better than California average

California average: 1.5%

Influenza Vaccine Info Percent of short-stay residents assessed and appropriately given the seasonal influenza vaccine 100.0%
7% better than California average

California average: 93.2%

Re-hospitalized after SNF stay Info Percentage of short-stay residents who were re-hospitalized after their nursing home admission. 27.8%
20% worse than California average

California average: 23.2%

Emergency department visits Info Percentage of short-stay residents who had an outpatient emergency department visit. 13.8%
23% worse than California average

California average: 11.2%

Falls with major injury Info Percentage of SNF residents who experience falls with major injury during their stay. 0.9%
17% worse than California average

California average: 0.8%

Ability to care for self at discharge Info Percentage of residents at or above expected ability to care for themselves at discharge. 77.7%
45% better than California average

California average: 53.7%

Successful return to home or community Info Rate of successful return to home or community from a skilled nursing facility. 64.3%
27% better than California average

California average: 50.6%

Guides for Better Senior Living

Care Cost Calculator: See Prices in Your Area

Nursing Home Data Explorer

Don’t Wait Too Long: 7 Red Flag Signs Your Parent Needs Assisted Living Now

The True Cost of Assisted Living in 2025 – And How Families Are Paying For It

Understanding Senior Living Costs: Pricing Models, Discounts & Financial Assistance

Financial Aid for California Seniors

Get financial aid guidance

Multipurpose Senior Services Program

MSSP (Medi-Cal Waiver)

Age 65+, California resident, Medi-Cal eligible, nursing home risk.

~$2,829/month (300% FBR, individual).

$2,000 (individual), $3,000 (couple).

County-managed; waitlists possible.

In-Home Supportive Services (IHSS)

California IHSS

Age 65+, California resident, Medicaid-eligible or low-income.

~$1,732/month (individual, Medi-Cal threshold).

$2,000 (individual).

Can hire family as caregivers.

Multipurpose Senior Services Program (MSSP)

CA MSSP

Age 65+, California resident, Medi-Cal-eligible, nursing home-eligible but community-capable.

~$2,829/month (300% FBR, individual).

$2,000 (individual).

Available in 38 counties; waitlists common.

Property Tax Postponement Program (PTP)

CA PTP

Age 62+, California resident, own and live in home, 40% equity.

~$51,500/year (household, adjusted annually).

Equity-based; no strict asset cap.

Deferred taxes accrue interest (5% as of 2024); repaid upon sale/death.

Assisted Living Waiver (ALW)

CA ALW

Age 65+ or disabled, California resident, Medi-Cal-eligible, nursing home-eligible.

~$2,829/month (300% FBR, individual).

$2,000 (individual).

Available in 15 counties (e.g., LA, Sacramento); waitlists common.

California CARES Program

CA CARES

Caregivers of California residents 60+ needing help with 3+ daily activities; no caregiver age limit.

No strict limit; cost-sharing above ~$2,500/month threshold.

Not applicable; need-based.

High demand in urban areas; complements IHSS respite.

Low-Income Home Energy Assistance Program (LIHEAP)

CA LIHEAP

Age 60+ priority, California resident, low-income, utility/heating need.

~$2,510/month (200% of poverty level, individual).

Not applicable; income-focused.

High demand in inland/coastal extremes; weatherization capped at $5,000/home.

Who we are

Your Senior Care Partner, Every Step of the Way

We help families find affordable senior communities and unlock same day discounts, Medicaid, and Medicare options tailored to your needs.

Contact us Today
Tour Icon
Planning a tour? Check our touring checklist.
Chat Icon
Thinking of living here? We can help you speak to a current resident