


Total health inspections
6
California average 12.5
Last Health inspection on Jul 2025
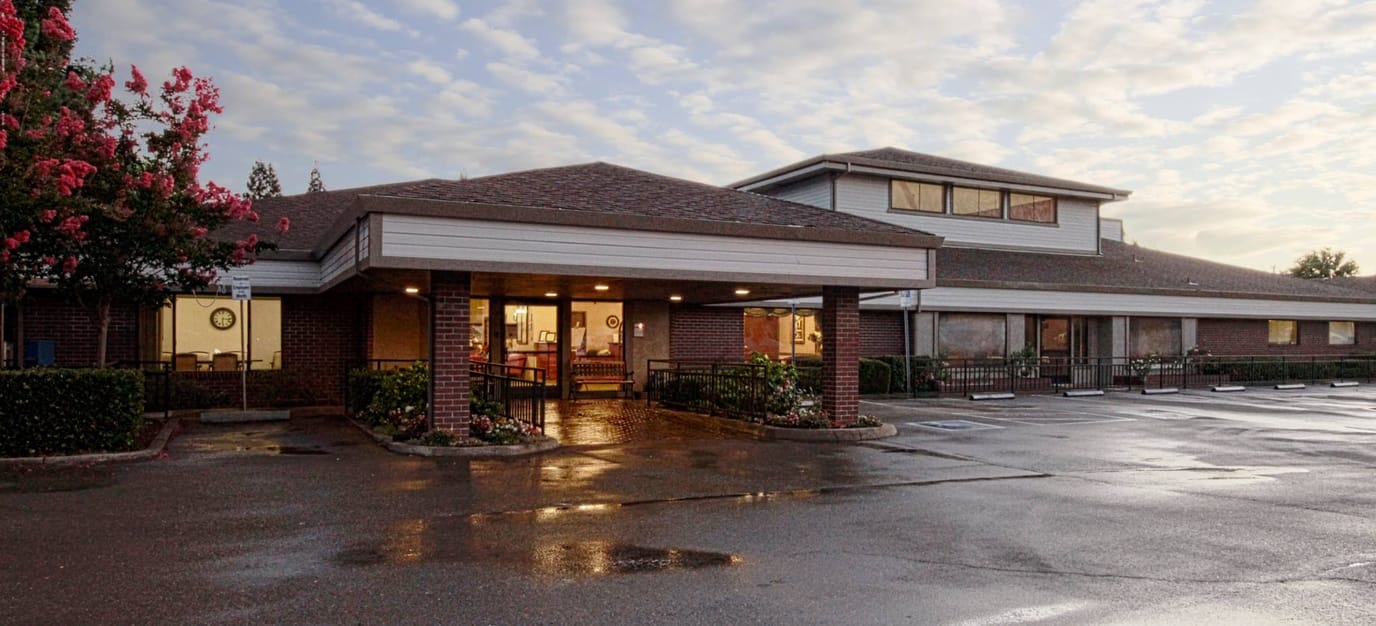
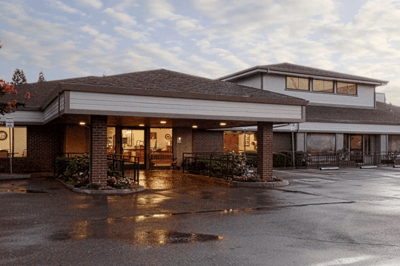
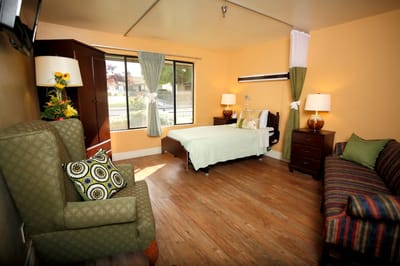
Pine Creek Care Center, located in Roseville, CA, is a premier skilled nursing facility offering nursing services, rehabilitation services and social services. They offer Medicare and Medicaid certified beds, and 24/7 nurse availability for supervision and assistance. The residents are provided individualized care where they may receive medication management & education, restorative nursing, dementia care, as well as hospice care.
Other skilled nursing services Pine Creek Care Center offers include nutrition & hydration programs, diabetic management, and laboratory services. Their experienced nurses can also help in managing and monitoring blood glucose, exercise planning, as well as meal planning.
| Staff type | Hours / Day / Resident | vs state avg |
|---|---|---|
|
Registered Nurse (RN)
|
30m per day | ▼ 23% State avg: 39m per day · National avg: 41m per day |
|
LPN / LVN
|
1h 28m per day | ▲ 21% State avg: 1h 13m per day · National avg: 52m per day |
|
Nurse Aide
|
2h 32m per day | ▼ 4% State avg: 2h 39m per day · National avg: 2h 21m per day |
|
Weekend Total Nursing
|
4h 0m per day | ■ Avg State avg: 4h 5m per day · National avg: 3h 26m per day |
|
Physical Therapist
|
5m per day | ▲ 5% State avg: 5m per day · National avg: 4m per day |
|
Weekend RN
|
22m per day | ▼ 27% State avg: 30m per day · National avg: 29m per day |
Key information about the people who lead and staff this community.
In California, the Department of Social Services (for assisted living facilities) and the Department of Public Health (for nursing homes) conduct inspections to ensure resident safety and regulatory compliance.
California average 12.5
Last Health inspection on Jul 2025
California average 50.2
California average 4.65
Health citations are formal notices following inspections when they fail to comply with safety and care standards.
20 of 24 citations resulted from standard inspections; 3 of 24 resulted from complaint investigations; and 1 of 24 came from combined inspections (standard and complaint).
California average: 0.4
California average: 1
Reporting period: October 1 – December 31, 2025 (Q4 2025). Source: CMS Payroll-Based Journal report.
Manages medical care and health needs.
Assists with medical care and medications.
Helps with daily care and mobility.
Total hours from contractors
1,335 contractor hours this quarter
| Certified Nursing Assistant | 76 | 59 | 135 | 22,294 | 92 | 100% | 7.6 |
| Licensed Practical Nurse | 41 | 10 | 51 | 11,446 | 92 | 100% | 8.4 |
| Registered Nurse | 15 | 2 | 17 | 3,872 | 92 | 100% | 8.3 |
| Speech Language Pathologist | 5 | 0 | 5 | 1,977 | 90 | 98% | 7.2 |
| Physical Therapy Assistant | 6 | 0 | 6 | 1,845 | 84 | 91% | 7.6 |
| RN Director of Nursing | 4 | 0 | 4 | 1,439 | 74 | 80% | 7.4 |
| Physical Therapy Aide | 3 | 0 | 3 | 1,277 | 69 | 75% | 7.5 |
| Dental Services Staff | 2 | 0 | 2 | 973 | 64 | 70% | 7.9 |
| Respiratory Therapy Technician | 3 | 0 | 3 | 766 | 67 | 73% | 7.1 |
| Other Dietary Services Staff | 2 | 0 | 2 | 689 | 77 | 84% | 7 |
| Qualified Social Worker | 3 | 0 | 3 | 626 | 64 | 70% | 6.6 |
| Administrator | 1 | 0 | 1 | 512 | 64 | 70% | 8 |
| Nurse Practitioner | 1 | 0 | 1 | 512 | 64 | 70% | 8 |
| Dietitian | 1 | 0 | 1 | 504 | 80 | 87% | 6.3 |
| Therapeutic Recreation Specialist | 1 | 0 | 1 | 485 | 60 | 65% | 8.1 |
Federal penalties imposed by CMS for regulatory violations, including civil money penalties (fines) and denials of payment for new Medicare/Medicaid admissions.
Source: CMS Penalties Database
No penalties in the past 3 years
No civil money penalties or payment denials were reported in the last 3 years.
These measures show how residents usually do over time at this home, based on health outcomes and preventive care.
California average: 6.6
California average: 11.3
California average: 11.1%
California average: 12.0%
California average: 11.3%
California average: 1.7%
California average: 5.0%
California average: 1.2%
California average: 4.2%
California average: 6.7%
California average: 10.1%
California average: 98.5%
California average: 98.2%
California average: 2.25
California average: 1.59
California average: 94.0%
California average: 1.5%
California average: 93.2%
California average: 23.2%
California average: 11.2%
California average: 0.8%
California average: 53.7%
California average: 50.6%
Quality measures are calculated from Minimum Data Set (MDS) assessments. For most measures, lower percentages indicate better care quality.
38% of new residents, usually for short-term rehab.
61% of new residents, often for short stays.
2% of new residents, often for long-term daily care.
Source: CMS Long-Term Care Facility Characteristics (Data as of Jan 2026)
Residents meet regularly to discuss policies, care quality, and activities
Organized group of residents that meets regularly to discuss facility policies, quality of life, and activities.
Data sourced from CMS Long-Term Care Facility Characteristics quarterly report. Payer mix reflects the current resident census by primary payment source.
Historical financial and operational data for Pine Creek Care Center from 2012–2023, based on CMS SNF Cost Reports.
Key figures below are for fiscal year ending in 12/2023.
Based on CMS SNF Cost Report for fiscal year ending in 12/2023.
Residents typically stay for brief periods, with frequent admissions and discharges throughout the year.
Most new residents arrive under private pay (61% of admissions), and a typical private pay stay runs around 1 - 2 months.
Coverage residents most often arrive under.
Coverage residents most often leave under.
Your Care is the Licensed Nursing Home Administrator at Pine Creek Care Center, overseeing all facility operations, staffing, services, and programs. They lead the leadership team to ensure quality care and smooth functioning of the community, working alongside the Medical Director and other department directors.
![]() 1.3 miles from city center
1.3 miles from city center
![]() Estimated distance in miles from Roseville's city center to Pine Creek Care Center's address, calculated via Google Maps.
— 4.73 miles to nearest hospital (Mercy San Juan Medical Center)
Estimated distance in miles from Roseville's city center to Pine Creek Care Center's address, calculated via Google Maps.
— 4.73 miles to nearest hospital (Mercy San Juan Medical Center)
Add your location
The information below is reported by the California Department of Social Services and Department of Public Health.
|
|
|
|
|
|
|
|
|
|
|
|
|
|
|
|
|
|
|
|
|
|
|
|
|
|
|
|---|---|---|---|---|---|---|---|---|---|---|---|---|---|---|---|---|---|---|---|---|---|---|---|---|---|
| Pine Creek Care Center |
NH
MC
SNF
|
Roseville (Cirby Side) |
99
Facility
99
CA AVG
104
Rank
#726 / 1648
|
96.0%
Facility
96.0%
CA AVG
73.8
Rank
#190 / 1496
| +30% |
3.65
Facility
3.65
CA AVG
4.22
Rank
#230 / 327
| -19% | -13% |
$0
Facility
$0
CA AVG
$56.5k
Rank
#1 / 334
| - |
24
Facility
24
CA AVG
50.2
Rank
#65 / 327
|
4.0
Facility
4.0
CA AVG
4.6
Rank
#153 / 327
| - | 95 | B- |
48
Facility
48
CA AVG
57
Rank
#1390 / 2087
| Bradley Truhar |
$22.7MFiscal year ending 12/2023
Facility
$22.7MFiscal year ending 12/2023
CA AVG
$17.0M
Rank
#68 / 327
|
$10.9MFiscal year ending 12/2023
Facility
$10.9MFiscal year ending 12/2023
CA AVG
$7.0M
Rank
#74 / 327
|
48.2%Fiscal year ending 12/2023
Facility
48.2%Fiscal year ending 12/2023
CA AVG
45.2%
Rank
#233 / 327
| 555801 | ||||
| Oak Ridge Healthcare Center |
NH
MC
SNF
|
Roseville (Sierra Gardens) |
67
Facility
67
CA AVG
104
Rank
#1025 / 1648
|
94.3%
Facility
94.3%
CA AVG
73.8
Rank
#229 / 1496
| +28% |
4.35
Facility
4.35
CA AVG
4.22
Rank
#116 / 327
| -46% | +3% |
$0
Facility
$0
CA AVG
$56.5k
Rank
#1 / 334
| - |
21
Facility
21
CA AVG
50.2
Rank
#42 / 327
|
3.5
Facility
3.5
CA AVG
4.6
Rank
#103 / 327
| - | 63 | - |
77
Facility
77
CA AVG
57
Rank
#509 / 2087
| Jason Pollock |
$10.8MFiscal year ending 12/2023
Facility
$10.8MFiscal year ending 12/2023
CA AVG
$17.0M
Rank
#298 / 327
|
$5.5MFiscal year ending 12/2023
Facility
$5.5MFiscal year ending 12/2023
CA AVG
$7.0M
Rank
#246 / 327
|
50.9%Fiscal year ending 12/2023
Facility
50.9%Fiscal year ending 12/2023
CA AVG
45.2%
Rank
#9 / 327
| 55491 | ||||
| Roseville Care Center |
NH
HOS
PC
RC
SNF
|
Roseville (Cirby Side) |
210
Facility
210
CA AVG
104
Rank
#135 / 1648
|
82.6%
Facility
82.6%
CA AVG
73.8
Rank
#611 / 1496
| +12% |
3.71
Facility
3.71
CA AVG
4.22
Rank
#230 / 327
| +4% | -12% |
$0
Facility
$0
CA AVG
$56.5k
Rank
#1 / 334
| - |
47
Facility
47
CA AVG
50.2
Rank
#194 / 327
|
3.4
Facility
3.4
CA AVG
4.6
Rank
#96 / 327
| - | 174 | - |
68
Facility
68
CA AVG
57
Rank
#804 / 2087
| Chandan Cheema |
$34.4MFiscal year ending 12/2023
Facility
$34.4MFiscal year ending 12/2023
CA AVG
$17.0M
Rank
#15 / 327
|
$18.6MFiscal year ending 12/2023
Facility
$18.6MFiscal year ending 12/2023
CA AVG
$7.0M
Rank
#8 / 327
|
54%Fiscal year ending 12/2023
Facility
54%Fiscal year ending 12/2023
CA AVG
45.2%
Rank
#231 / 327
| 55886 |
Pine Creek Care Center is located in Roseville, California.
Here are the financial assistance programs available to residents in California.
Pine Creek Care Center is in the Cirby Side neighborhood of Roseville.
Pine Creek Care Center has a walk score of 48. Somewhat walkable. A few nearby services may be reachable on foot, but most trips require transportation.
Pine Creek Care Center's occupancy is 93.9%.
No, Pine Creek Care Center has a no-pet policy.
Pine Creek Care Center is registered as a for-profit in CA.
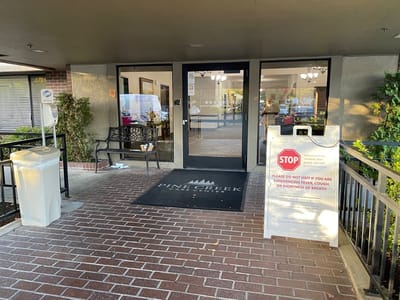
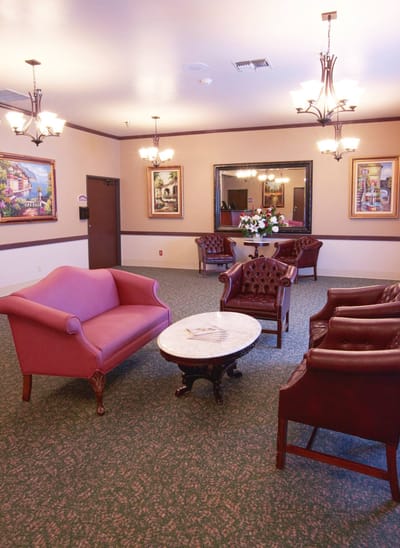
Yes — there are 7 photos of Pine Creek Care Center in the photo gallery on this page.
Pine Creek Care Center is located at 1139 Cirby Way, Roseville, CA 95661.
Care Cost Calculator: See Prices in Your Area
Nursing Home Data Explorer
Don’t Wait Too Long: 7 Red Flag Signs Your Parent Needs Assisted Living Now
The True Cost of Assisted Living in 2025 – And How Families Are Paying For It
Understanding Senior Living Costs: Pricing Models, Discounts & Financial Assistance


