Occupancy rate
84%

We arrange tours, appointments, and even moving support so you don’t have to
Thank you for your interest!
Our team will be in touch shortly to help with next steps.
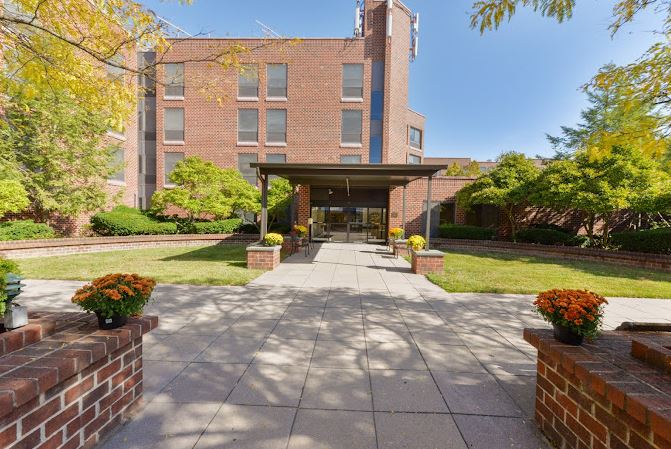
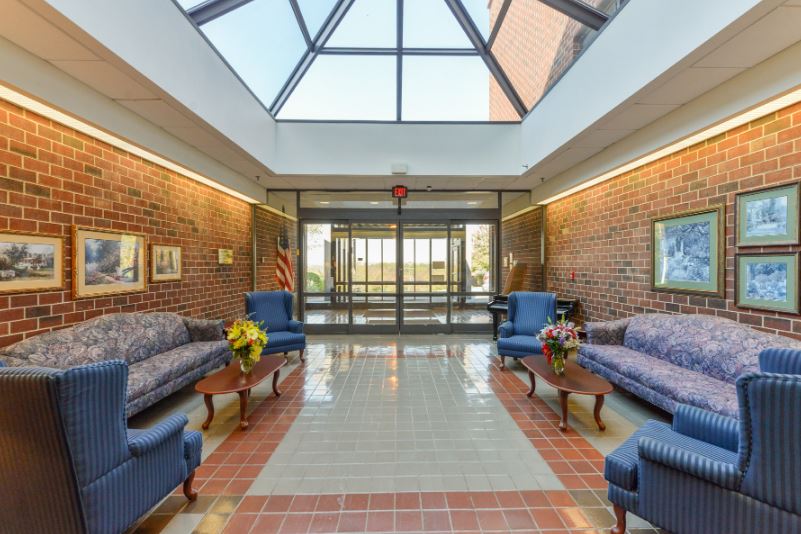
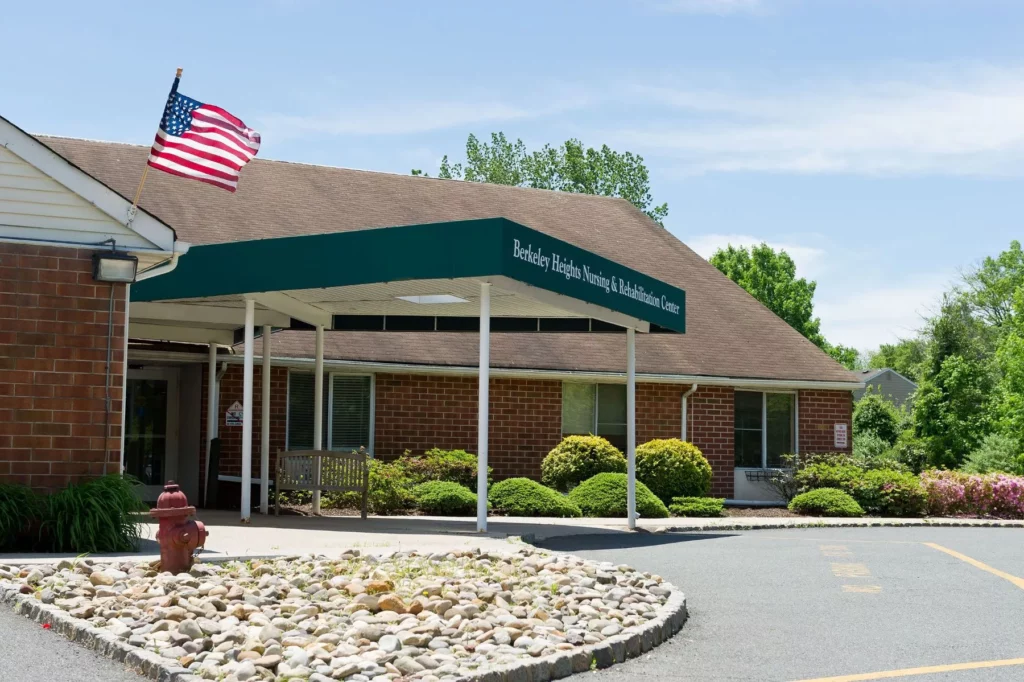
Located in Berkeley Heights, New Jersey, Runnells Care Center is an exceptional community offering comprehensive care services, including short-term sub-acute, long-term care, a specialized dementia unit, and hospice care. Situated on a breathtaking 35-acre campus with lush greenery and magnificent outdoor gardens, the community provides a serene environment for healing. Runnells’ commitment to nurturing mind, body, and spirit is evident in their dedication to providing the highest quality medical care with the help of their dedicated team of professionals.
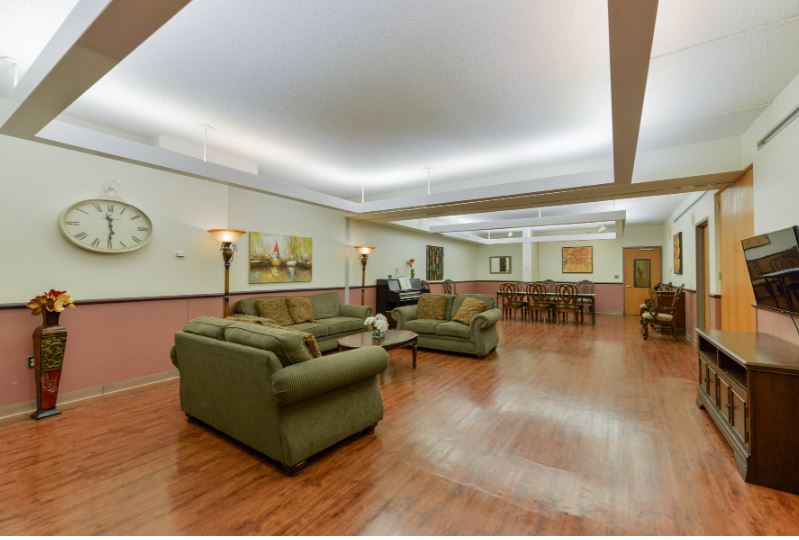
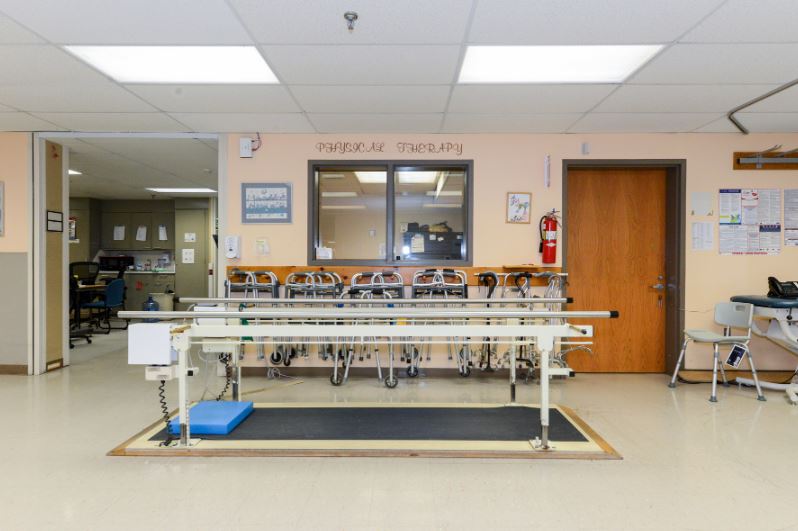
Runnells Care Center’s mission is to make residents and their families feel like a part of their own family, ensuring a warm and inviting atmosphere. The community features luxurious amenities such as spacious, elegantly appointed suites with orthopedic units, flat-screen cable TVs, WiFi, and temperature controls. Residents can also enjoy a state-of-the-art fitness center, therapy gyms, and on-site beauty services, setting a new standard in luxury healthcare.
May provide extensive amenities, services and programs.
Lower occupancy suggests more openings may be available.
Most residents typically stay for a few weeks or months before returning home or moving on.
43% of new residents, usually for short-term rehab.
23% of new residents, often for short stays.
34% of new residents, often for long-term daily care.
Runnells Care Center is legally operated by Runnells Operating Llc, and administrated by Joseph Garrett.
Avraham Rosenberg, Esther Rosenberg, Jonathan Rosenberg, Moshe Rosenberg, Zvi Rosenberg
In New Jersey, the Department of Health, Health Facilities Evaluation and Licensing conducts mandatory unannounced surveys to ensure facilities provide safe and effective resident care.
8 complaint inspections
6 routine inspections
New Jersey average: 8 visits/inspections
New Jersey average: 6 inspections
On a scale from A (least severe) to L (most severe).
Deficiencies indicate regulatory issues. A higher number implies the facility had several areas requiring improvement.
New Jersey average: 18 deficiencies
Deficiencies indicate regulatory issues. A higher number implies the facility had several areas requiring improvement.
New Jersey average: 18 deficiencies
New Jersey average 4
Last Health inspection on Oct 2025
New Jersey average 20.9
New Jersey average 5.35
Health citations are formal notices following inspections when they fail to comply with safety and care standards.
21 of 26 citations resulted from standard inspections; and 5 of 26 resulted from complaint investigations.
New Jersey average: 0.7
New Jersey average: 0.4
Data sourced from CMS Health Deficiencies reports. Citation severity codes range from A (least serious) to L (most serious). Immediate Jeopardy (J-L) citations indicate situations where the facility's noncompliance has placed residents at risk of death or serious harm.
Nursing Home Licensed facility providing 24/7 skilled nursing care for residents with complex, ongoing medical needs. Staffed by RNs, LPNs, and CNAs. Inspected and star-rated annually by CMS. Accepts Medicare (short-term rehab) and Medicaid (long-term care).
Assisted Living A licensed, long-term care setting for seniors or individuals with disabilities who need help with daily activities — like bathing, dressing, and medication management — but not 24-hour skilled nursing. Offers housing, meals, and around-the-clock support while aiming to maximize resident independence.
Memory Care Secured, specialized care for people living with Alzheimer's or dementia. Staff trained in cognitive impairment, with higher staff-to-resident ratios and an environment designed to reduce confusion and wandering risk.
Nursing Home Licensed facility providing 24/7 skilled nursing care for residents with complex, ongoing medical needs. Staffed by RNs, LPNs, and CNAs. Inspected and star-rated annually by CMS. Accepts Medicare (short-term rehab) and Medicaid (long-term care).
Assisted Living A licensed, long-term care setting for seniors or individuals with disabilities who need help with daily activities — like bathing, dressing, and medication management — but not 24-hour skilled nursing. Offers housing, meals, and around-the-clock support while aiming to maximize resident independence.
Home Care Professional care delivered in the person's own home — from companionship and errands to skilled nursing and therapy. Allows seniors to age in place. Medicare covers skilled home health when medically necessary.
Independent Living Lifestyle-focused communities for older adults offering dining, activities, and transportation with minimal personal care. Best for active, independent seniors who want community without medical support.
Memory Care Secured, specialized care for people living with Alzheimer's or dementia. Staff trained in cognitive impairment, with higher staff-to-resident ratios and an environment designed to reduce confusion and wandering risk.
Respite Care Short-term temporary care — days to weeks — to give family caregivers a break. Full care provided during the stay. Often used after hospitalization or to trial a facility before a permanent placement decision.
Assisted Living A licensed, long-term care setting for seniors or individuals with disabilities who need help with daily activities — like bathing, dressing, and medication management — but not 24-hour skilled nursing. Offers housing, meals, and around-the-clock support while aiming to maximize resident independence.
Nursing Home Licensed facility providing 24/7 skilled nursing care for residents with complex, ongoing medical needs. Staffed by RNs, LPNs, and CNAs. Inspected and star-rated annually by CMS. Accepts Medicare (short-term rehab) and Medicaid (long-term care).
Nursing Home Licensed facility providing 24/7 skilled nursing care for residents with complex, ongoing medical needs. Staffed by RNs, LPNs, and CNAs. Inspected and star-rated annually by CMS. Accepts Medicare (short-term rehab) and Medicaid (long-term care).
Assisted Living A licensed, long-term care setting for seniors or individuals with disabilities who need help with daily activities — like bathing, dressing, and medication management — but not 24-hour skilled nursing. Offers housing, meals, and around-the-clock support while aiming to maximize resident independence.
![]() 1.3 miles from city center — 4.86 miles to nearest hospital (Overlook Medical Center)
1.3 miles from city center — 4.86 miles to nearest hospital (Overlook Medical Center)
![]() 40 Watchung Way, Berkeley Heights, NJ 07922
40 Watchung Way, Berkeley Heights, NJ 07922
Add your location
This data corresponds to Q2 2025 and is based on CMS Payroll-Based Journal.
New Jersey average ratio: 1.77:1
New Jersey average: 8 hours
Manages medical care and health needs.
This role is partially covered by contractors.
Assists with medical care and medications.
No contractors work on this role.
Helps with daily care and mobility.
This role is partially covered by contractors.
Total hours from contractors
1,904 contractor hours this quarter
| Certified Nursing Assistant | 111 | 6 | 117 | 57,039 | 91 | 100% | 9.1 |
| Licensed Practical Nurse | 39 | 0 | 39 | 20,023 | 91 | 100% | 8.9 |
| Registered Nurse | 34 | 3 | 37 | 12,758 | 91 | 100% | 8.2 |
| Other Dietary Services Staff | 5 | 0 | 5 | 1,818 | 90 | 99% | 7.6 |
| Respiratory Therapy Technician | 3 | 0 | 3 | 1,387 | 67 | 74% | 8.1 |
| Physical Therapy Assistant | 3 | 0 | 3 | 1,336 | 69 | 76% | 7.7 |
| Clinical Nurse Specialist | 4 | 0 | 4 | 1,059 | 69 | 76% | 7.9 |
| Mental Health Service Worker | 4 | 0 | 4 | 920 | 63 | 69% | 7.8 |
| Administrator | 2 | 0 | 2 | 904 | 68 | 75% | 8 |
| Dental Services Staff | 3 | 0 | 3 | 749 | 58 | 64% | 7.6 |
| Occupational Therapy Aide | 2 | 0 | 2 | 537 | 61 | 67% | 7.5 |
| Dietitian | 1 | 0 | 1 | 512 | 64 | 70% | 8 |
| Nurse Practitioner | 2 | 0 | 2 | 496 | 62 | 68% | 8 |
| Respiratory Therapist | 1 | 0 | 1 | 478 | 60 | 66% | 8 |
| Therapeutic Recreation Specialist | 1 | 0 | 1 | 461 | 62 | 68% | 7.4 |
| Qualified Social Worker | 4 | 0 | 4 | 366 | 57 | 63% | 5.9 |
| Medical Director | 1 | 0 | 1 | 159 | 50 | 55% | 3.2 |
Source: CMS Long-Term Care Facility Characteristics (Data as of Jan 2026)
Residents meet regularly to discuss policies, care quality, and activities
Organized group of residents that meets regularly to discuss facility policies, quality of life, and activities.
Data sourced from CMS Long-Term Care Facility Characteristics quarterly report. Payer mix reflects the current resident census by primary payment source.
These measures show how residents usually do over time at this home, based on health outcomes and preventive care.
New Jersey average: 6.8
New Jersey average: 12.4
New Jersey average: 10.1%
New Jersey average: 11.0%
New Jersey average: 16.0%
New Jersey average: 2.4%
New Jersey average: 6.1%
New Jersey average: 1.0%
New Jersey average: 4.6%
New Jersey average: 11.3%
New Jersey average: 11.1%
New Jersey average: 93.0%
New Jersey average: 97.2%
New Jersey average: 2.08
New Jersey average: 1.12
New Jersey average: 78.9%
New Jersey average: 1.2%
New Jersey average: 80.1%
New Jersey average: 25.4%
New Jersey average: 8.2%
New Jersey average: 0.8%
New Jersey average: 53.7%
New Jersey average: 50.6%
Quality measures are calculated from Minimum Data Set (MDS) assessments. For most measures, lower percentages indicate better care quality.
Federal penalties imposed by CMS for regulatory violations, including civil money penalties (fines) and denials of payment for new Medicare/Medicaid admissions.
Source: CMS Penalties Database (Data as of Jan 2026)
New Jersey average: $77K
New Jersey average: 2.0
New Jersey average: 0.1
Penalties are imposed by CMS for violations of federal nursing home regulations.
Last updated: Jan 2026
Historical financial and operational data for Runnells Care Center based on CMS SNF Cost Reports.
Loading trend charts...
Care Cost Calculator: See Prices in Your Area
Nursing Home Data Explorer
Don’t Wait Too Long: 7 Red Flag Signs Your Parent Needs Assisted Living Now
The True Cost of Assisted Living in 2025 – And How Families Are Paying For It
Understanding Senior Living Costs: Pricing Models, Discounts & Financial Assistance
Touring a community? Use this expert-backed checklist to stay organized, ask the right questions, and find the perfect fit.
We'll send you a PDF version of the touring checklist.